| Param | Original file | Final file |
|---|---|---|
| Filename | modeM0/AS1G04_007T02_9000000220_01210cztM0_level2.evt | modeM0/AS1G04_007T02_9000000220_01210cztM0_level2_quad_clean.evt |
| Size (bytes) | 1,054,765,440 | 101,162,880 |
| Size | 1005.9 MB | 96.5 MB |
| Events in quadrant A | 7,851,686 | 661,635 |
| Events in quadrant B | 8,268,171 | 656,379 |
| Events in quadrant C | 7,971,431 | 641,216 |
| Events in quadrant D | 7,405,289 | 634,901 |
| Mode M9 | |||
|---|---|---|---|
| Quadrant | BADHDUFLAG | Total packets | Discarded packets |
| A | 0 | 9 | 0 |
| B | 0 | 9 | 0 |
| C | 0 | 9 | 0 |
| D | 0 | 9 | 0 |
| Mode M0 | |||
|---|---|---|---|
| Quadrant | BADHDUFLAG | Total packets | Discarded packets |
| A | 0 | 28098 | 2 |
| B | 0 | 29345 | 1 |
| C | 0 | 28423 | 1 |
| D | 0 | 26807 | 1 |
| Mode SS | |||
|---|---|---|---|
| Quadrant | BADHDUFLAG | Total packets | Discarded packets |
| A | 0 | 138 | 0 |
| B | 0 | 138 | 0 |
| C | 0 | 138 | 0 |
| D | 0 | 138 | 0 |
| Quadrant | Total seconds | Saturated seconds | Saturation percentage |
|---|---|---|---|
| A | 6732 | 11 | 0.163399% |
| B | 6732 | 10 | 0.148544% |
| C | 6732 | 6 | 0.089127% |
| D | 6732 | 66 | 0.980392% |
Noise dominated data is calculated using 1-second bins in cleaned event files. If a bin has >2000 counts, and if more than 50% of those come from <1% of pixels, then it is considered to be noise-dominated and hence unusable.
| Quadrant | # 1 sec bins | Bins with >0 counts | Bins with >2000 counts | High rate bins dominated by noise | Noise dominated (total time) | Noise dominated (detector-on time) | Marked lightcurve |
|---|---|---|---|---|---|---|---|
| A | 7637 | 6733 | 142 | 142 | 1.86% | 2.11% |  |
| B | 7637 | 6733 | 199 | 199 | 2.61% | 2.96% | 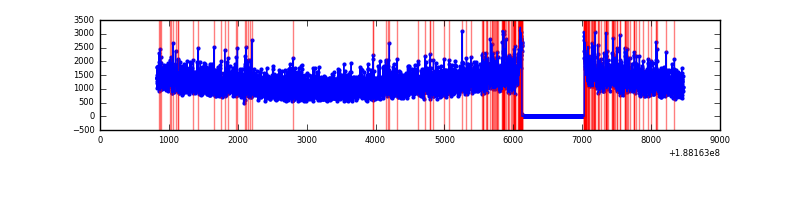 |
| C | 7637 | 6733 | 151 | 151 | 1.98% | 2.24% | 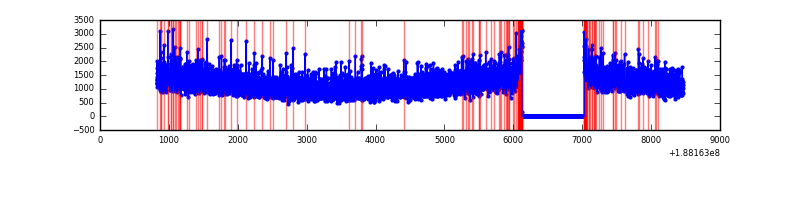 |
| D | 7637 | 6733 | 175 | 175 | 2.29% | 2.60% | 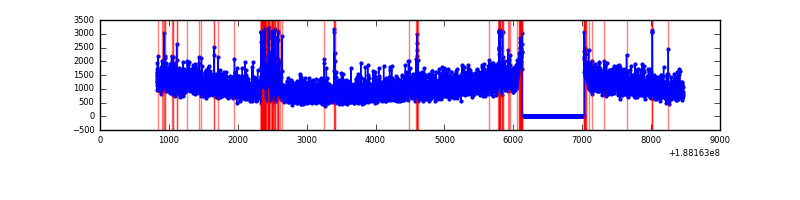 |
Top three noisy pixels from each quadrant. If the there are fewer than three noisy pixels in the level2.evt file, extra rows are filled as -1
| Pixel properties | Quadrant properties | ||||||
|---|---|---|---|---|---|---|---|
| Quadrant | DetID | PixID | Counts | Sigma | Mean | Median | Sigma |
| A | 8 | 14 | 62012 | 123.83 | 2013 | 2021 | 484.4 |
| A | 12 | 243 | 28827 | 55.33 | 2013 | 2021 | 484.4 |
| A | 14 | 238 | 23190 | 43.7 | 2013 | 2021 | 484.4 |
| B | 6 | 53 | 96033 | 187.92 | 2125 | 2130 | 499.7 |
| B | 15 | 22 | 47481 | 90.76 | 2125 | 2130 | 499.7 |
| B | 5 | 191 | 29690 | 55.15 | 2125 | 2130 | 499.7 |
| C | 15 | 241 | 349001 | 644.28 | 1935 | 2005 | 538.6 |
| C | 9 | 52 | 25421 | 43.48 | 1935 | 2005 | 538.6 |
| C | 3 | 111 | 25046 | 42.78 | 1935 | 2005 | 538.6 |
| D | 9 | 66 | 162554 | 278.38 | 1859 | 1925 | 577.0 |
| D | 10 | 84 | 121552 | 207.32 | 1859 | 1925 | 577.0 |
| D | 1 | 83 | 49873 | 83.1 | 1859 | 1925 | 577.0 |
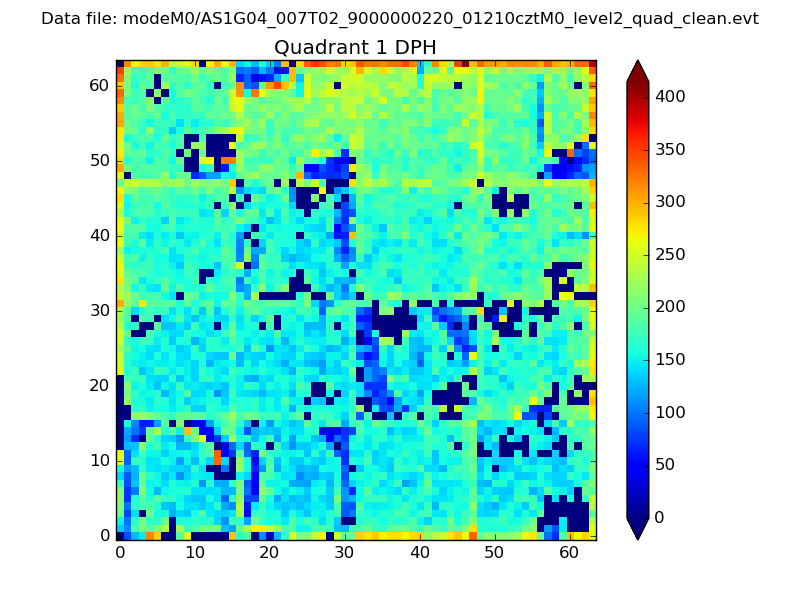
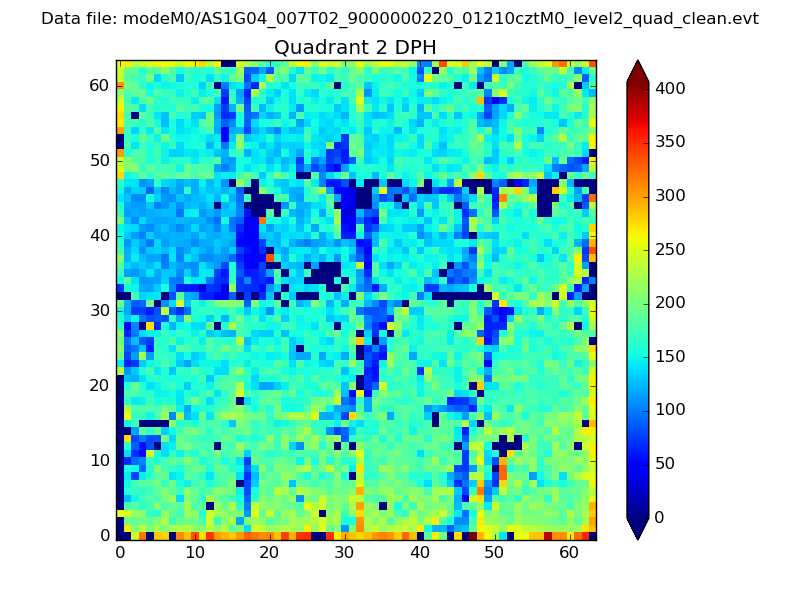
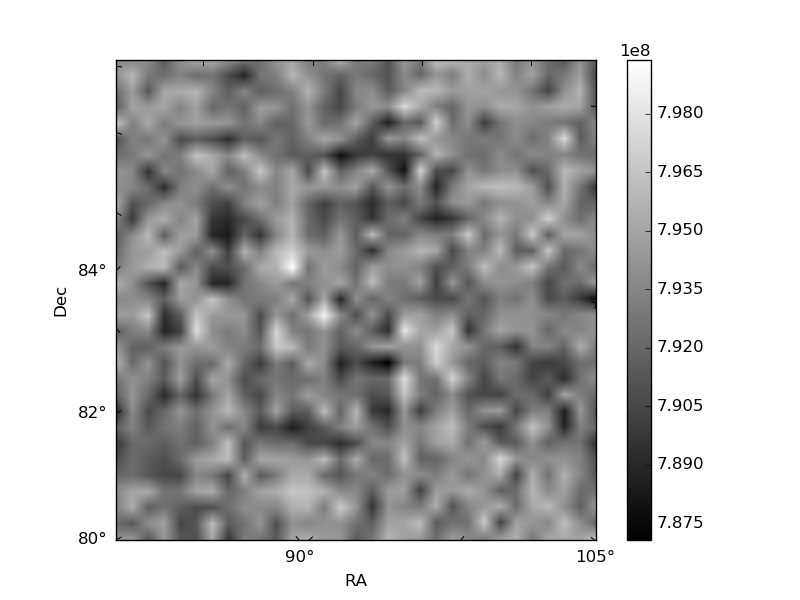
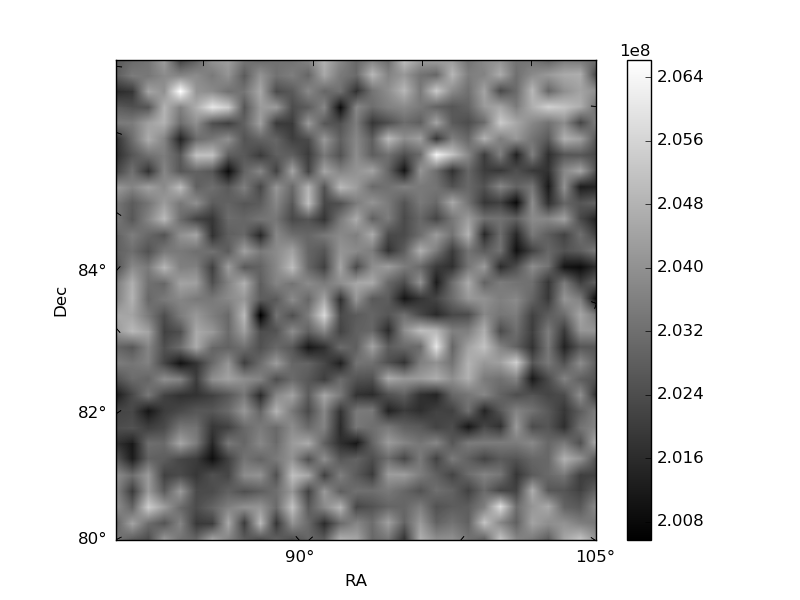
Histogram calculated using DETX and DETY for each event in the final _common_clean file
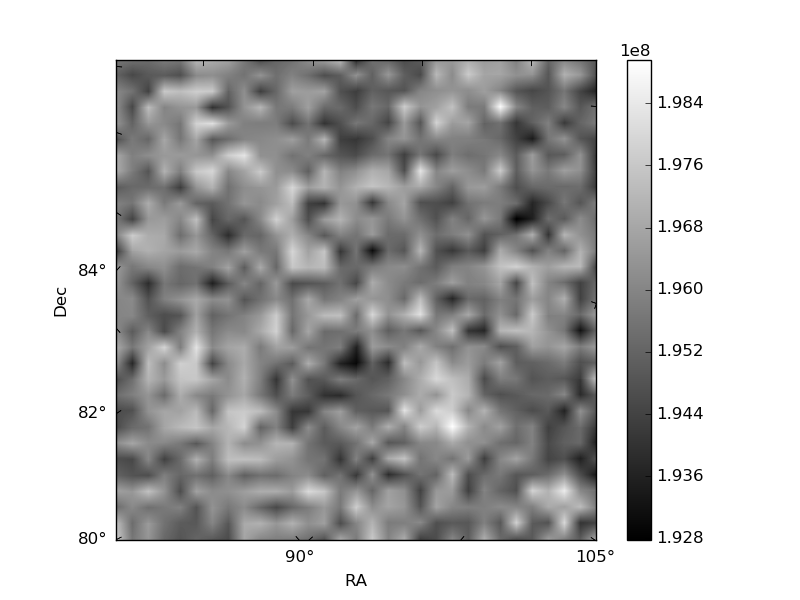
| Quadrant A | 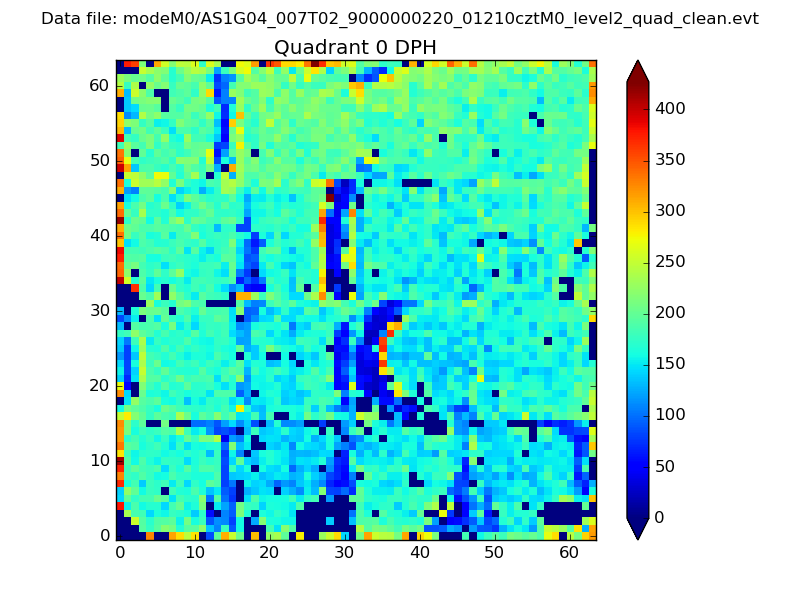 |
 |
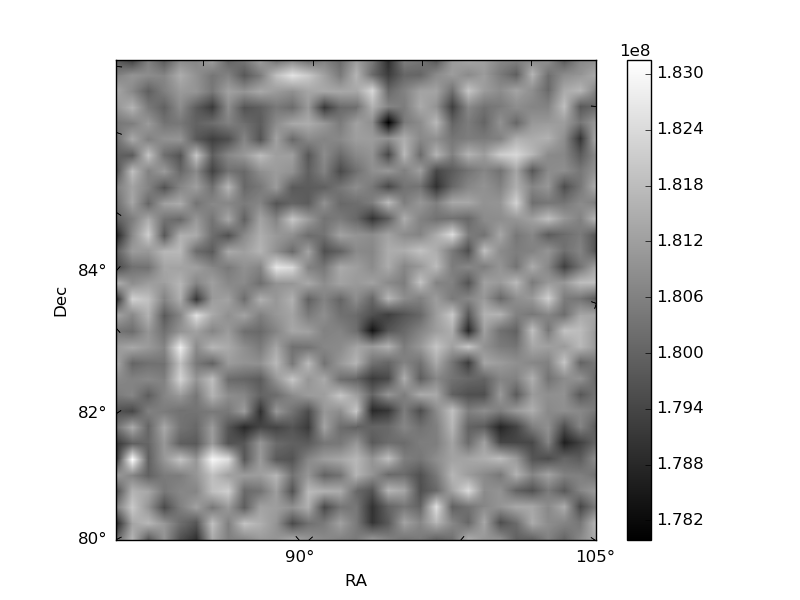
Quadrant B |
|---|---|---|---|
| Quadrant D | 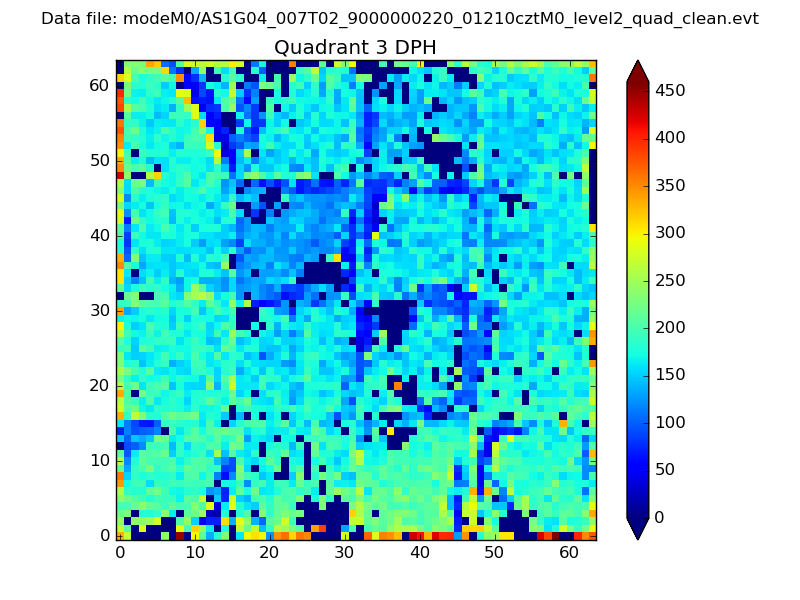 |
 |
Quadrant C |
| Plot type | Count rate plots | Images |
|---|---|---|
| Comparison with Poisson distribution Blue bars denote a histogram of data divided into 1 sec bins. Red curve is a Poisson curve with rate = median count rate of data. |
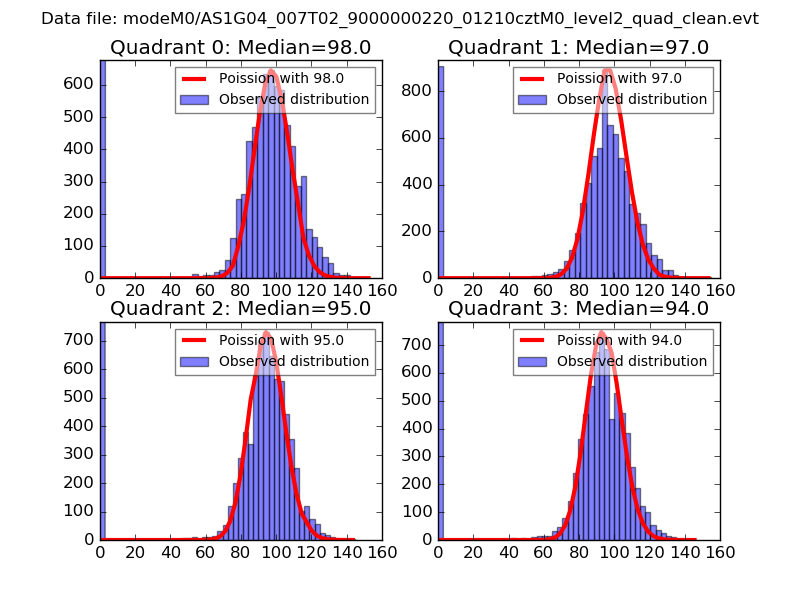 |
 |
| Quadrant-wise count rates Data is divided into 100 sec bins |
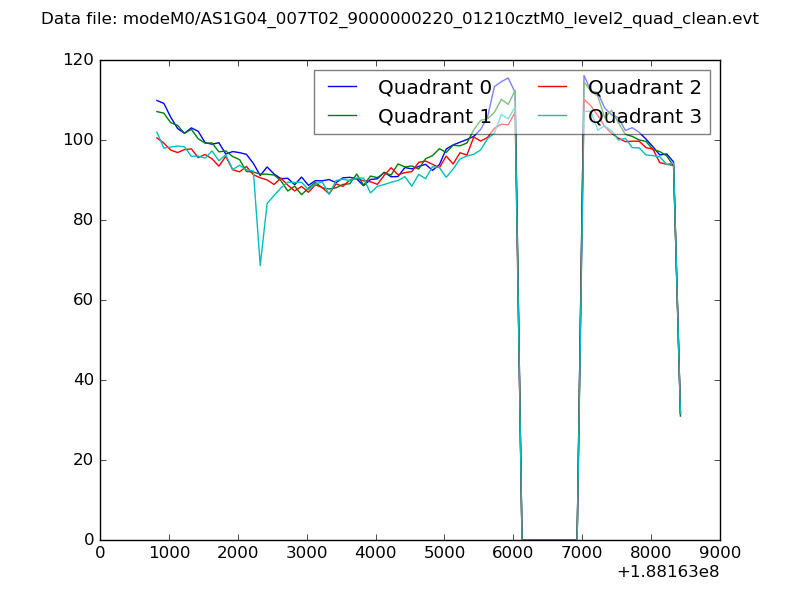 |
|
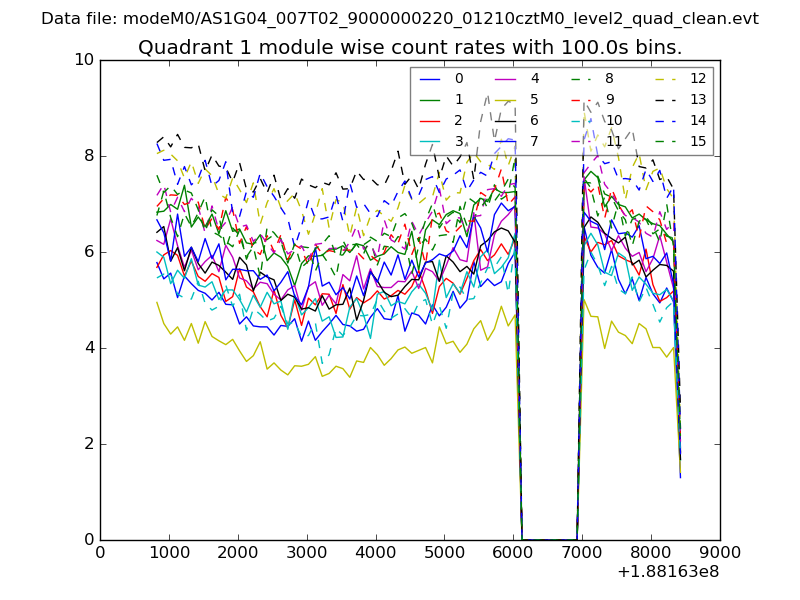
| Module-wise count rates for Quadrant A Data is divided into 100 sec bins |
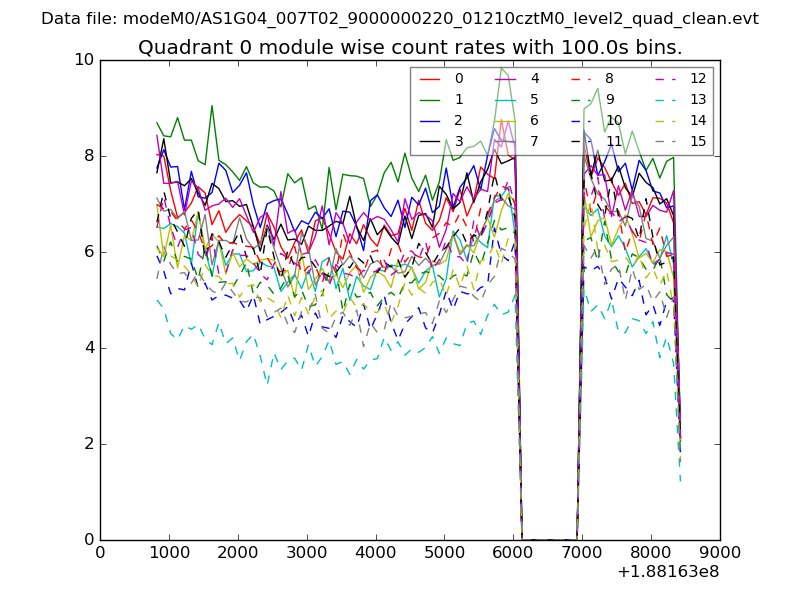 |
 |
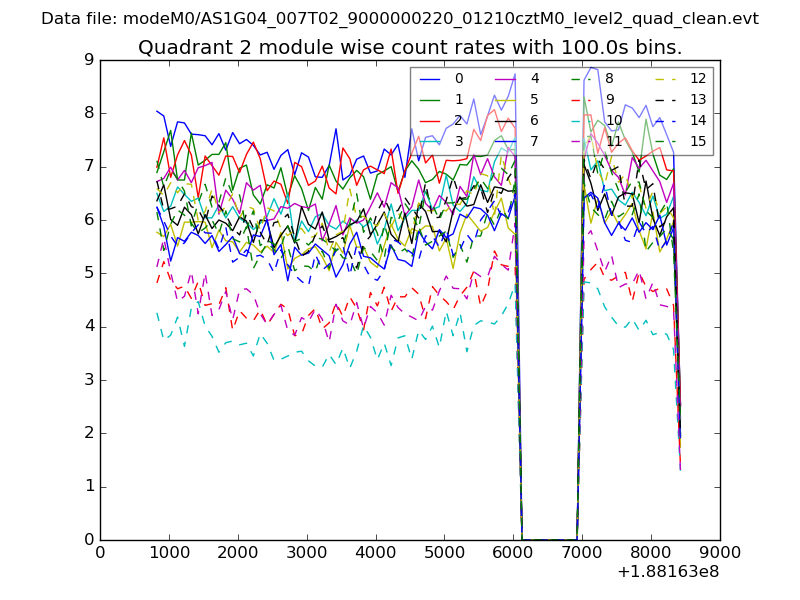
| Module-wise count rates for Quadrant B Data is divided into 100 sec bins |
 |
 |
| Module-wise count rates for Quadrant C Data is divided into 100 sec bins |
 |
 |
| Module-wise count rates for Quadrant D Data is divided into 100 sec bins |
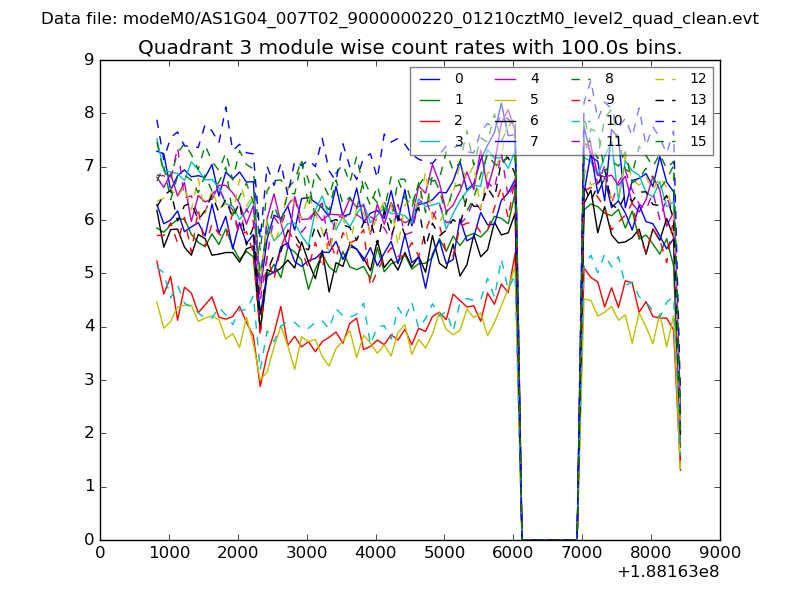 |
 |
| Parameter | Plot |
|---|---|
| CZT HV Monitor | 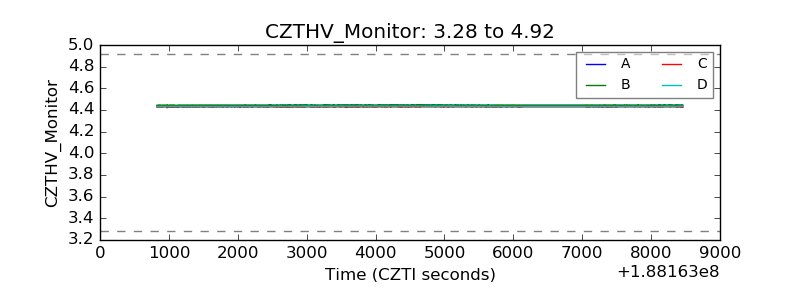 |
| D_VDD | 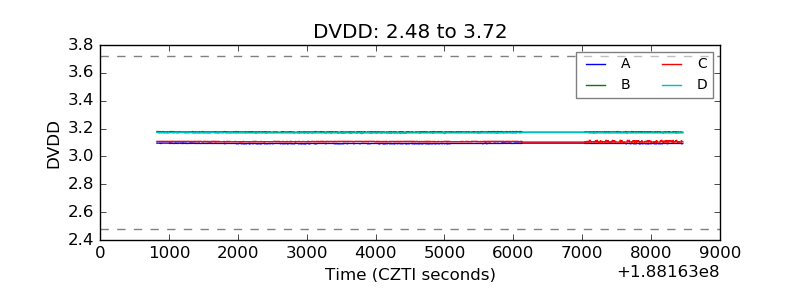 |
| Temperature 1 | 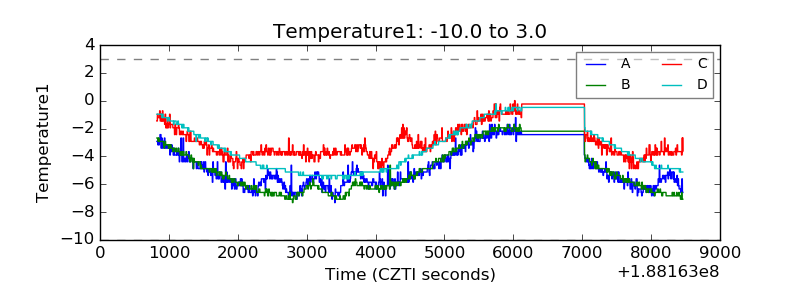 |
| Veto HV Monitor | 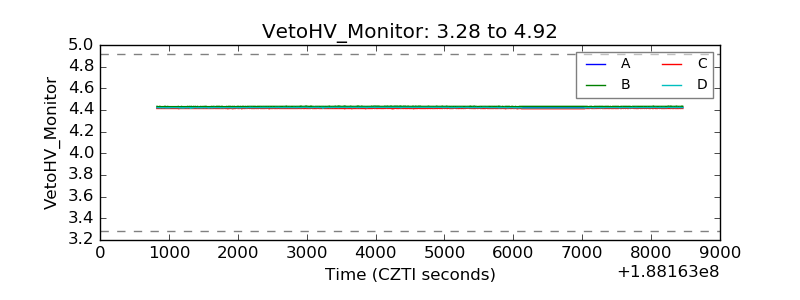 |
| Veto LLD | 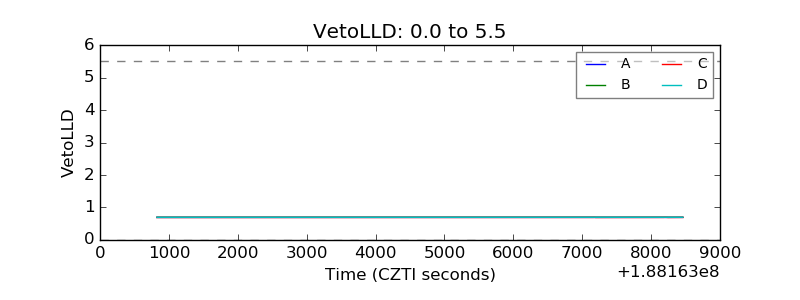 |
| Alpha Counter | 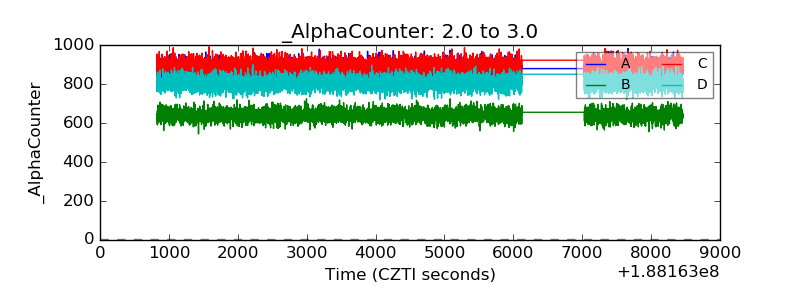 |
| _CPM_Rate | 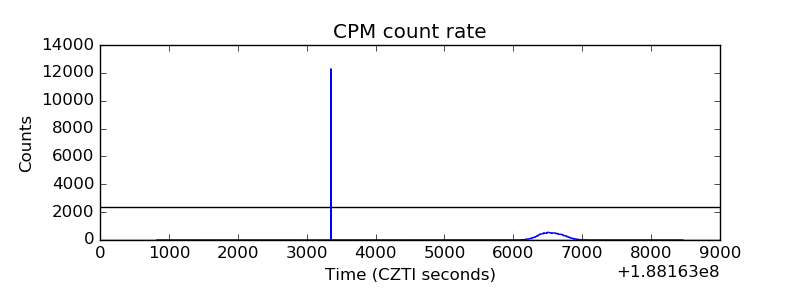 |
| CZT Counter | 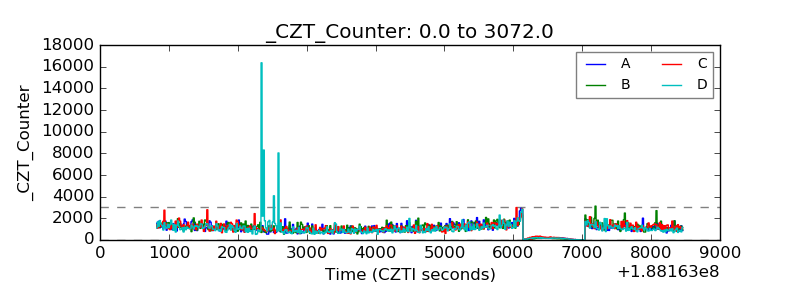 |
| +2.5 Volts monitor |  |
| +5 Volts monitor |  |
| _ROLL_ROT | 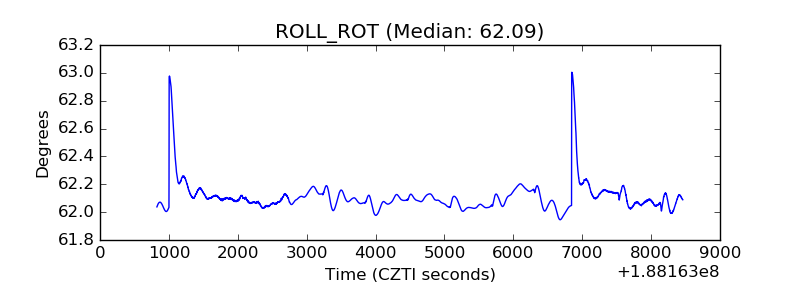 |
| _Roll_DEC | 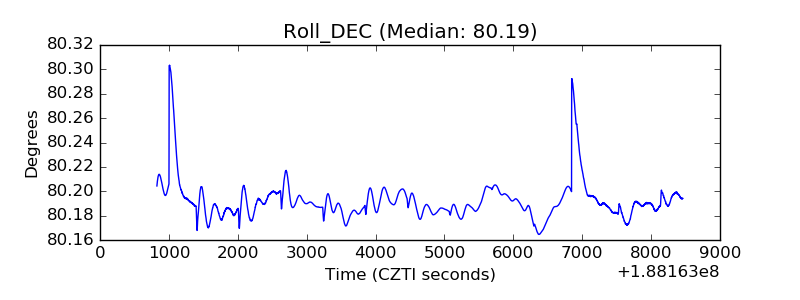 |
| _Roll_RA | 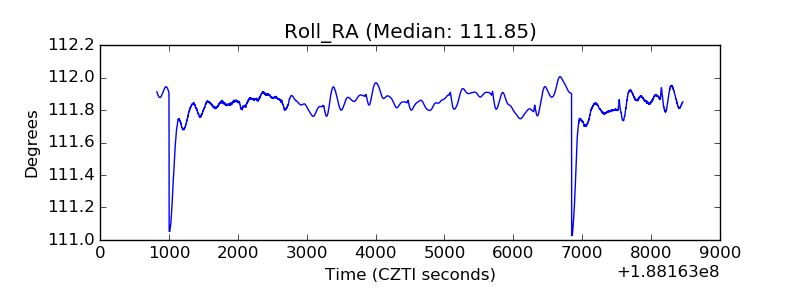 |
| Veto Counter | 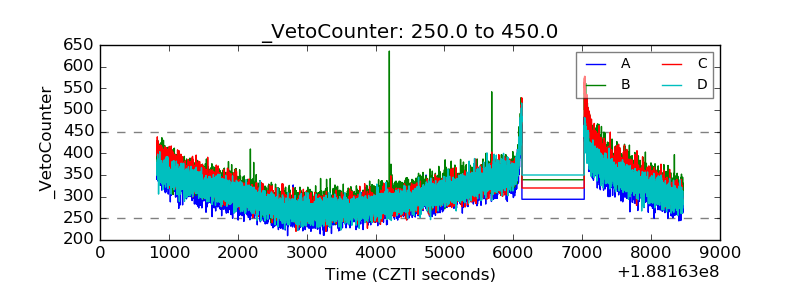 |