| Param | Original file | Final file |
|---|---|---|
| Filename | modeM0/AS1G04_007T02_9000000220_01213cztM0_level2.evt | modeM0/AS1G04_007T02_9000000220_01213cztM0_level2_quad_clean.evt |
| Size (bytes) | 371,116,800 | 39,818,880 |
| Size | 353.9 MB | 38.0 MB |
| Events in quadrant A | 2,744,656 | 257,576 |
| Events in quadrant B | 2,971,549 | 258,134 |
| Events in quadrant C | 2,808,981 | 255,483 |
| Events in quadrant D | 2,540,943 | 250,141 |
| Mode M0 | |||
|---|---|---|---|
| Quadrant | BADHDUFLAG | Total packets | Discarded packets |
| A | 0 | 10006 | 1 |
| B | 0 | 10656 | 1 |
| C | 0 | 10195 | 1 |
| D | 0 | 9383 | 1 |
| Mode SS | |||
|---|---|---|---|
| Quadrant | BADHDUFLAG | Total packets | Discarded packets |
| A | 0 | 52 | 0 |
| B | 0 | 52 | 0 |
| C | 0 | 52 | 0 |
| D | 0 | 52 | 0 |
| Quadrant | Total seconds | Saturated seconds | Saturation percentage |
|---|---|---|---|
| A | 2564 | 0 | 0.000000% |
| B | 2564 | 2 | 0.078003% |
| C | 2564 | 0 | 0.000000% |
| D | 2564 | 3 | 0.117005% |
Noise dominated data is calculated using 1-second bins in cleaned event files. If a bin has >2000 counts, and if more than 50% of those come from <1% of pixels, then it is considered to be noise-dominated and hence unusable.
| Quadrant | # 1 sec bins | Bins with >0 counts | Bins with >2000 counts | High rate bins dominated by noise | Noise dominated (total time) | Noise dominated (detector-on time) | Marked lightcurve |
|---|---|---|---|---|---|---|---|
| A | 2564 | 2564 | 24 | 24 | 0.94% | 0.94% | 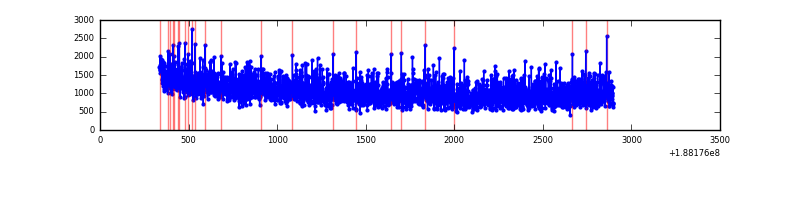 |
| B | 2564 | 2564 | 47 | 47 | 1.83% | 1.83% | 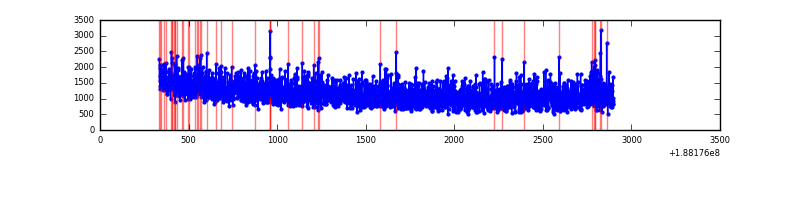 |
| C | 2564 | 2564 | 23 | 23 | 0.90% | 0.90% |  |
| D | 2564 | 2564 | 25 | 25 | 0.98% | 0.98% | 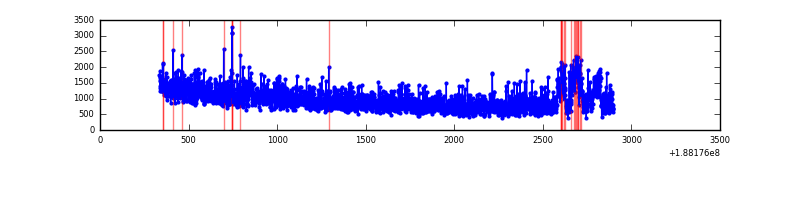 |
Top three noisy pixels from each quadrant. If the there are fewer than three noisy pixels in the level2.evt file, extra rows are filled as -1
| Pixel properties | Quadrant properties | ||||||
|---|---|---|---|---|---|---|---|
| Quadrant | DetID | PixID | Counts | Sigma | Mean | Median | Sigma |
| A | 12 | 243 | 12786 | 71.15 | 708 | 714 | 169.7 |
| A | 15 | 233 | 7760 | 41.53 | 708 | 714 | 169.7 |
| A | 0 | 31 | 5801 | 29.98 | 708 | 714 | 169.7 |
| B | 6 | 53 | 45261 | 248.9 | 765 | 770 | 178.8 |
| B | 15 | 22 | 5825 | 28.28 | 765 | 770 | 178.8 |
| B | 0 | 49 | 5285 | 25.26 | 765 | 770 | 178.8 |
| C | 15 | 241 | 133260 | 700.13 | 681 | 706 | 189.3 |
| C | 3 | 111 | 7227 | 34.44 | 681 | 706 | 189.3 |
| C | 3 | 79 | 4677 | 20.97 | 681 | 706 | 189.3 |
| D | 9 | 66 | 129725 | 646.24 | 633 | 652 | 199.7 |
| D | 13 | 205 | 38302 | 188.51 | 633 | 652 | 199.7 |
| D | 13 | 252 | 4314 | 18.33 | 633 | 652 | 199.7 |
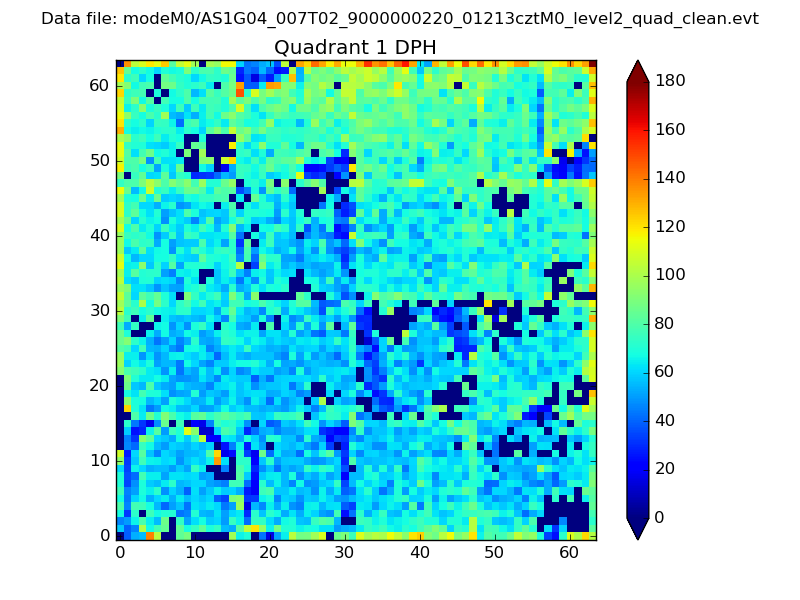
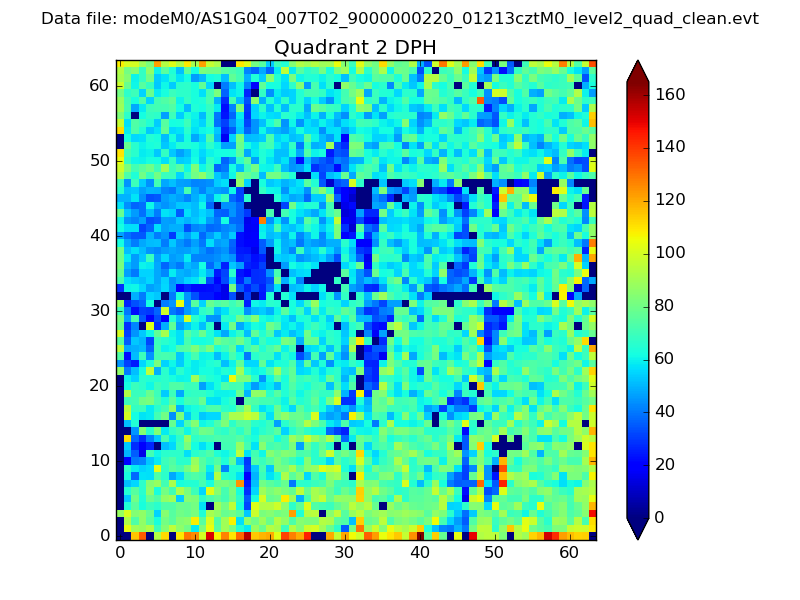
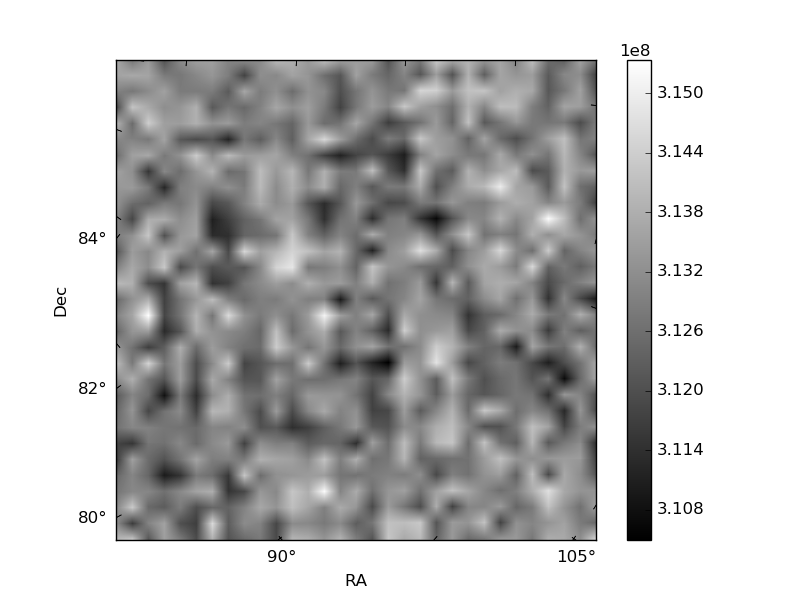
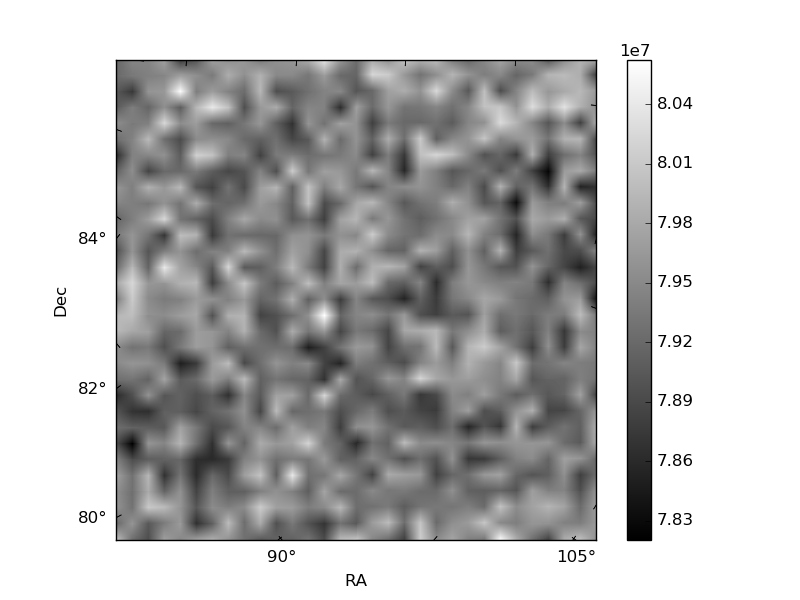
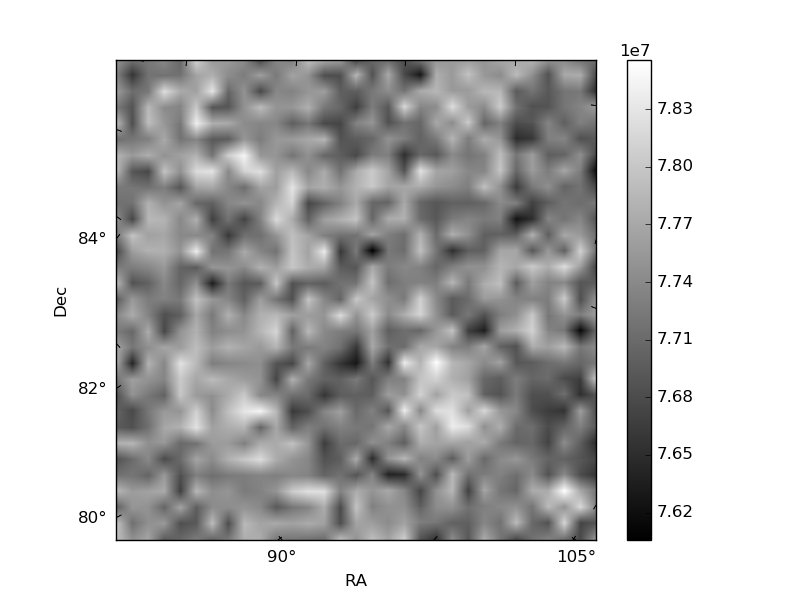
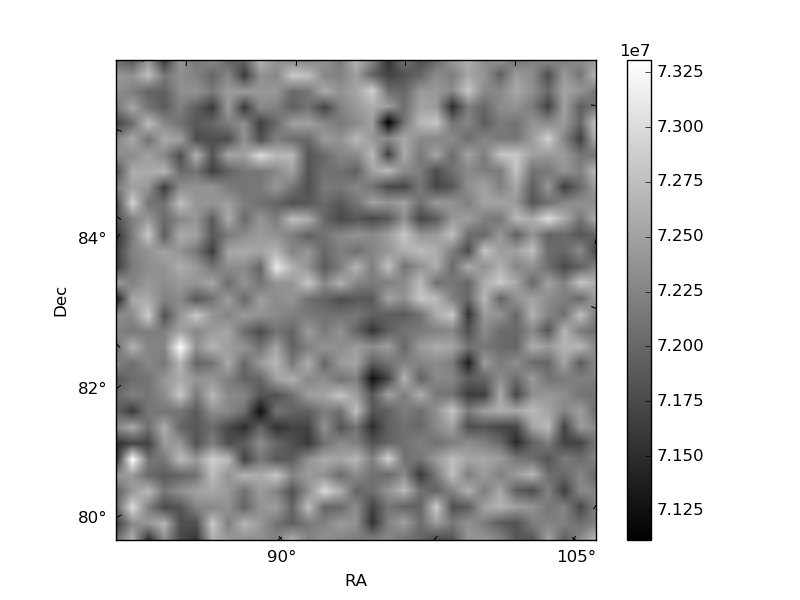
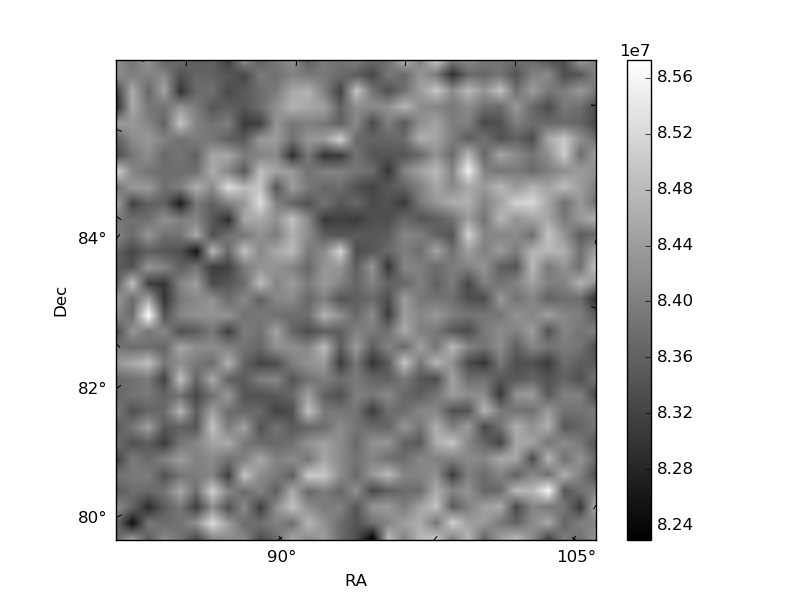
Histogram calculated using DETX and DETY for each event in the final _common_clean file
| Quadrant A | 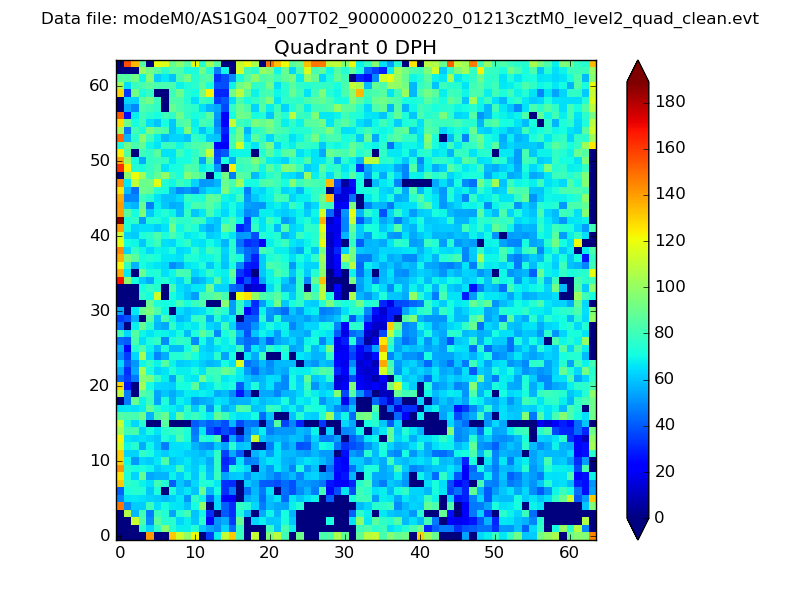 |
 |
Quadrant B |
|---|---|---|---|
| Quadrant D | 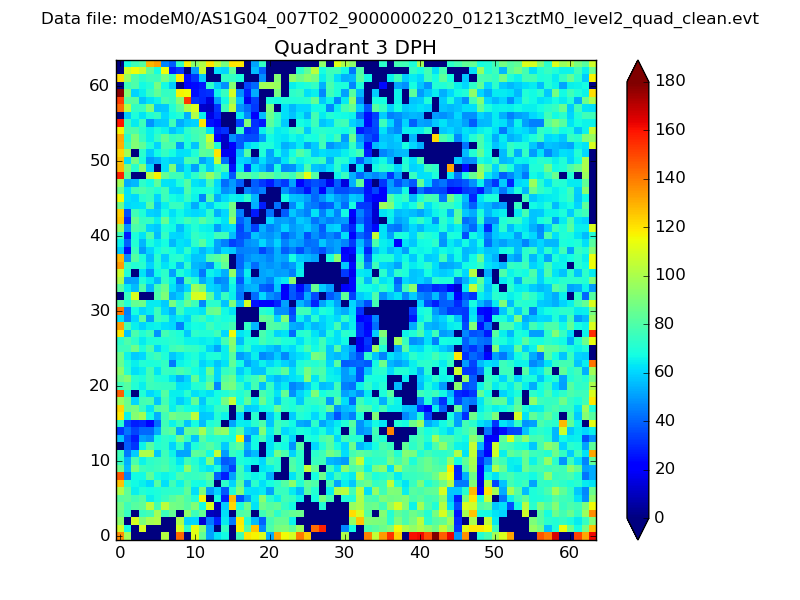 |
 |
Quadrant C |
| Plot type | Count rate plots | Images |
|---|---|---|
| Comparison with Poisson distribution Blue bars denote a histogram of data divided into 1 sec bins. Red curve is a Poisson curve with rate = median count rate of data. |
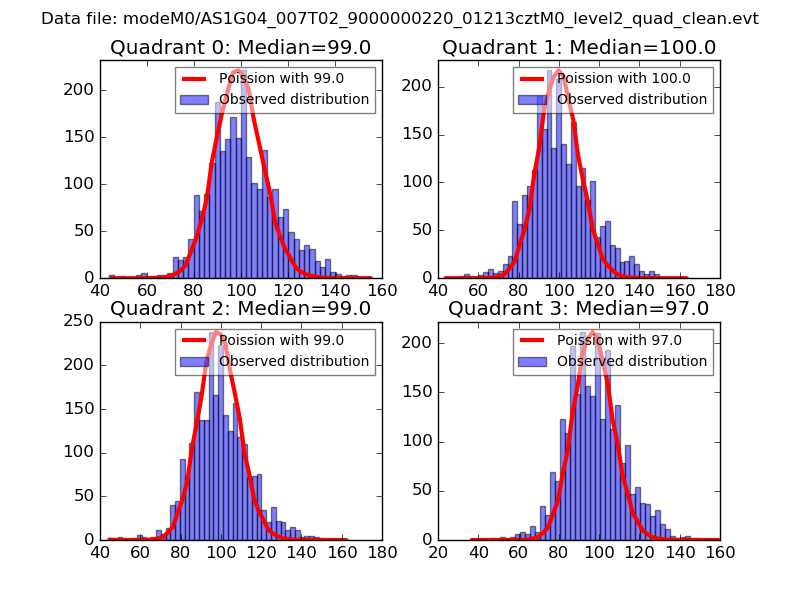 |
 |
| Quadrant-wise count rates Data is divided into 100 sec bins |
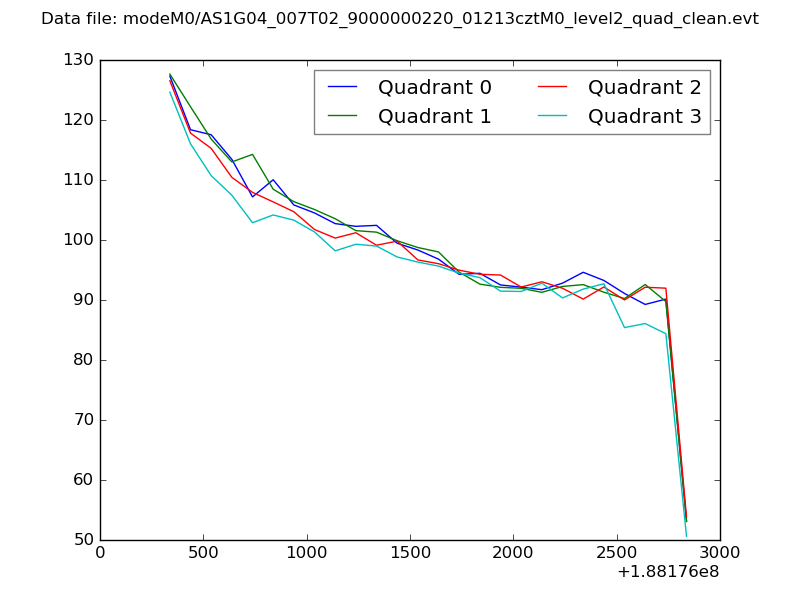 |
|
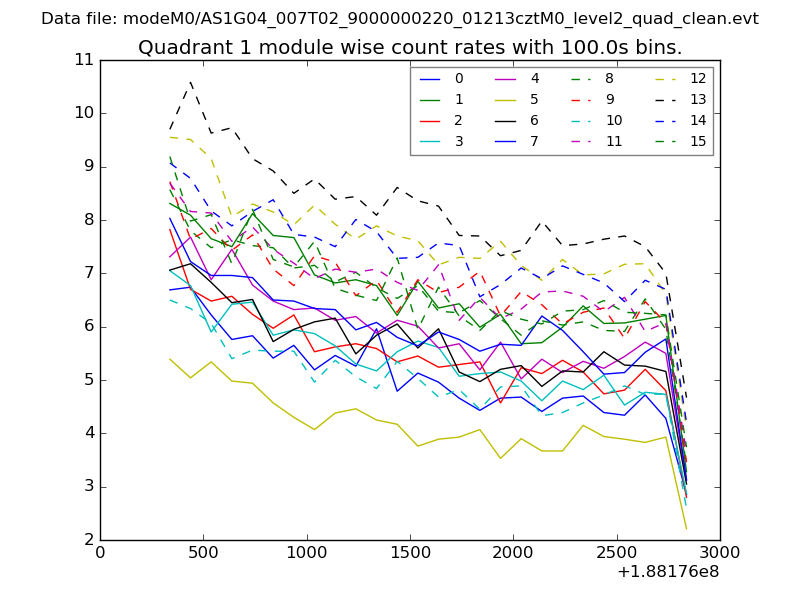
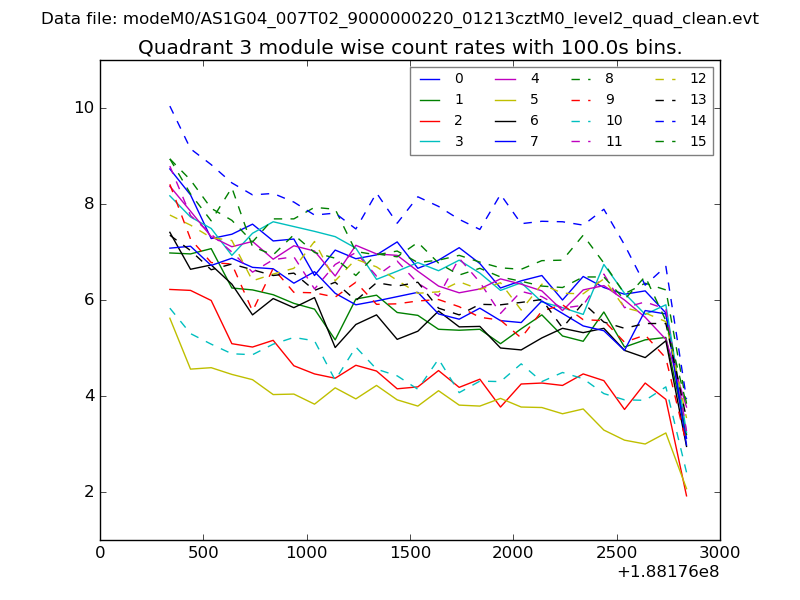
| Module-wise count rates for Quadrant A Data is divided into 100 sec bins |
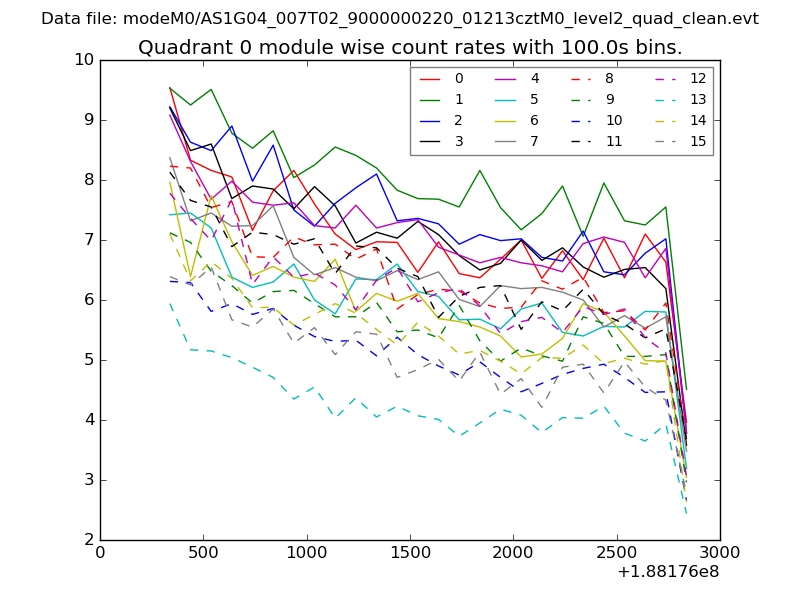 |
 |
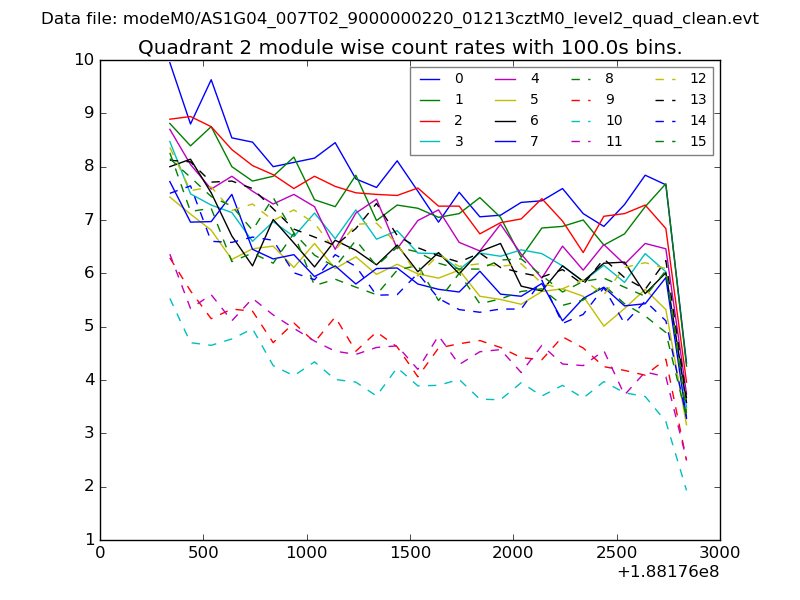
| Module-wise count rates for Quadrant B Data is divided into 100 sec bins |
 |
 |
| Module-wise count rates for Quadrant C Data is divided into 100 sec bins |
 |
 |
| Module-wise count rates for Quadrant D Data is divided into 100 sec bins |
 |
 |
| Parameter | Plot |
|---|---|
| CZT HV Monitor | 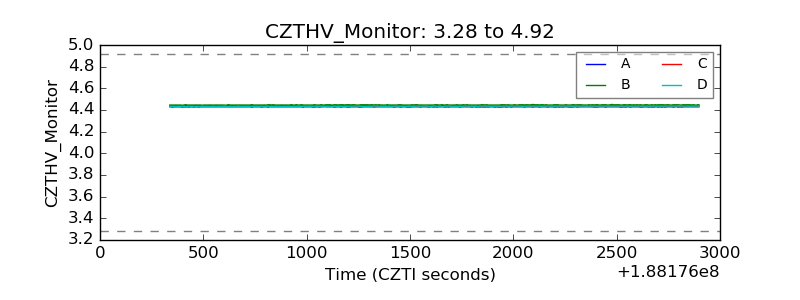 |
| D_VDD | 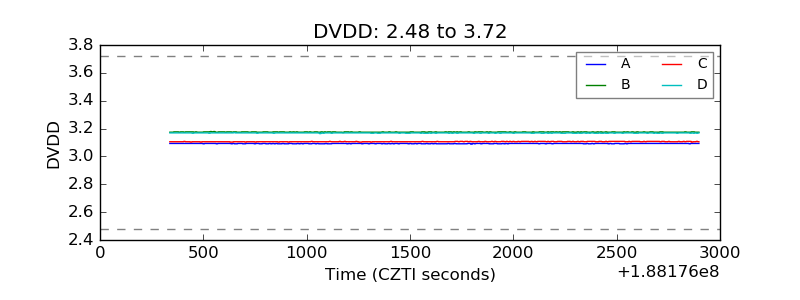 |
| Temperature 1 |  |
| Veto HV Monitor | 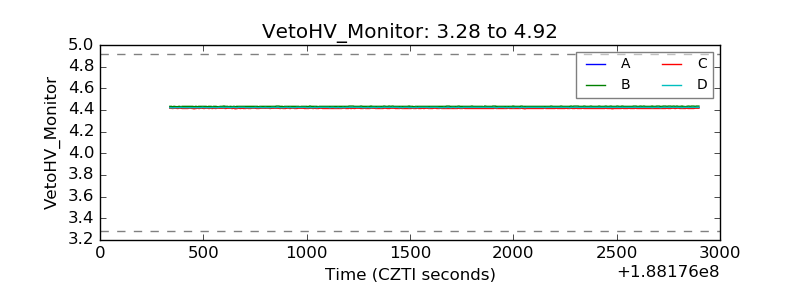 |
| Veto LLD | 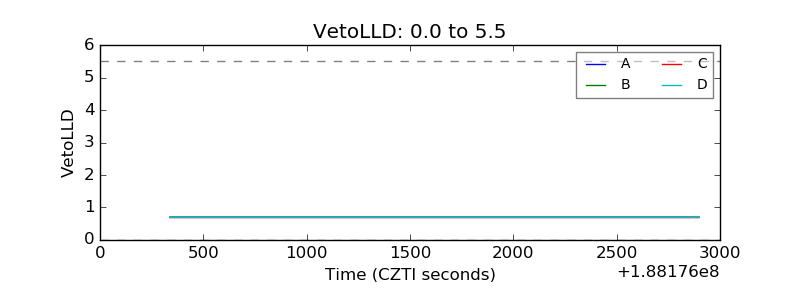 |
| Alpha Counter | 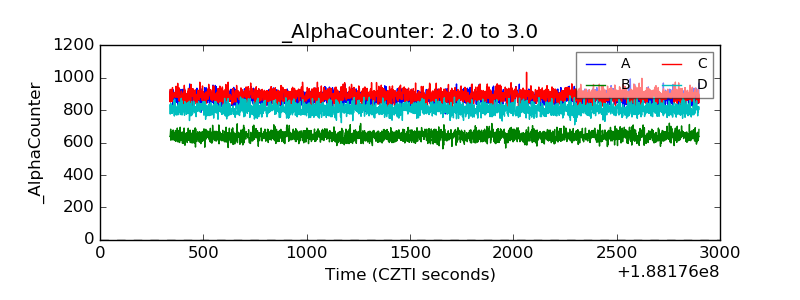 |
| _CPM_Rate | 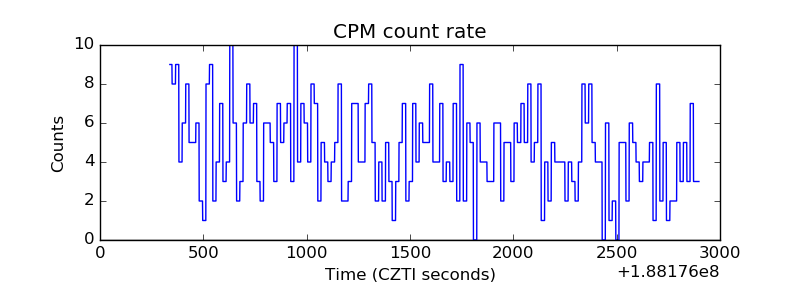 |
| CZT Counter | 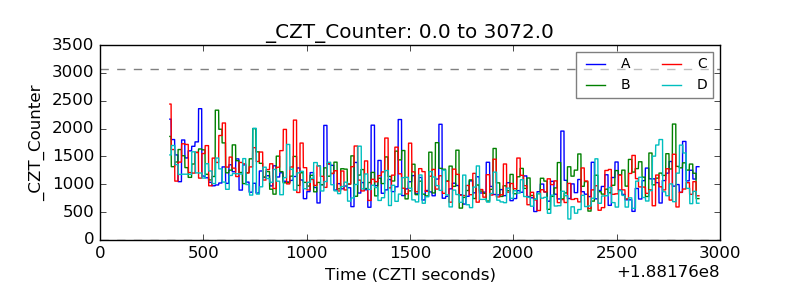 |
| +2.5 Volts monitor |  |
| +5 Volts monitor |  |
| _ROLL_ROT | 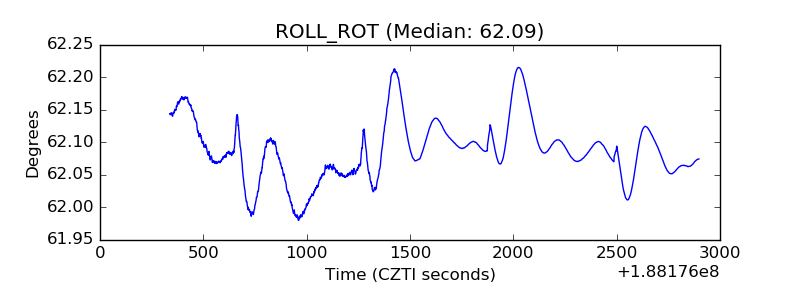 |
| _Roll_DEC | 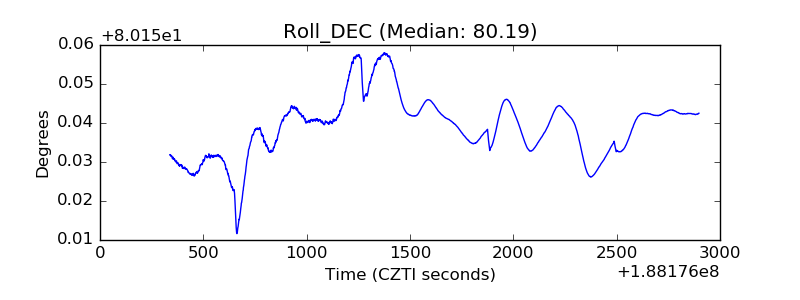 |
| _Roll_RA | 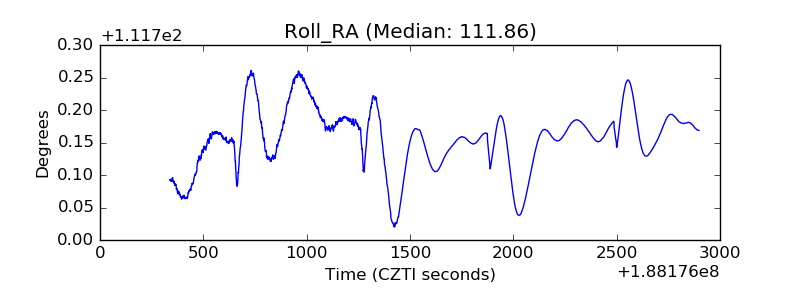 |
| Veto Counter | 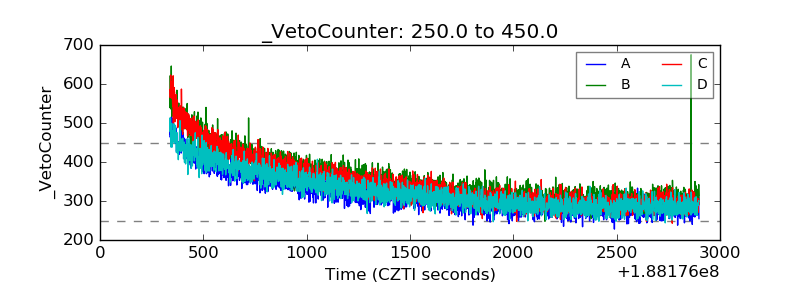 |