| Param | Original file | Final file |
|---|---|---|
| Filename | modeM0/AS1G04_007T02_9000000220_01215cztM0_level2.evt | modeM0/AS1G04_007T02_9000000220_01215cztM0_level2_quad_clean.evt |
| Size (bytes) | 892,595,520 | 91,013,760 |
| Size | 851.2 MB | 86.8 MB |
| Events in quadrant A | 6,649,539 | 603,915 |
| Events in quadrant B | 6,988,133 | 608,500 |
| Events in quadrant C | 6,452,623 | 580,650 |
| Events in quadrant D | 6,565,953 | 567,362 |
| Mode M9 | |||
|---|---|---|---|
| Quadrant | BADHDUFLAG | Total packets | Discarded packets |
| A | 0 | 13 | 0 |
| B | 0 | 13 | 0 |
| C | 0 | 13 | 0 |
| D | 0 | 13 | 0 |
| Mode M0 | |||
|---|---|---|---|
| Quadrant | BADHDUFLAG | Total packets | Discarded packets |
| A | 0 | 23740 | 3 |
| B | 0 | 24783 | 2 |
| C | 0 | 23189 | 2 |
| D | 0 | 23542 | 2 |
| Mode SS | |||
|---|---|---|---|
| Quadrant | BADHDUFLAG | Total packets | Discarded packets |
| A | 0 | 114 | 0 |
| B | 0 | 114 | 0 |
| C | 0 | 114 | 0 |
| D | 0 | 114 | 0 |
| Quadrant | Total seconds | Saturated seconds | Saturation percentage |
|---|---|---|---|
| A | 5664 | 6 | 0.105932% |
| B | 5664 | 26 | 0.459040% |
| C | 5664 | 5 | 0.088277% |
| D | 5664 | 30 | 0.529661% |
Noise dominated data is calculated using 1-second bins in cleaned event files. If a bin has >2000 counts, and if more than 50% of those come from <1% of pixels, then it is considered to be noise-dominated and hence unusable.
| Quadrant | # 1 sec bins | Bins with >0 counts | Bins with >2000 counts | High rate bins dominated by noise | Noise dominated (total time) | Noise dominated (detector-on time) | Marked lightcurve |
|---|---|---|---|---|---|---|---|
| A | 6969 | 5666 | 122 | 122 | 1.75% | 2.15% | 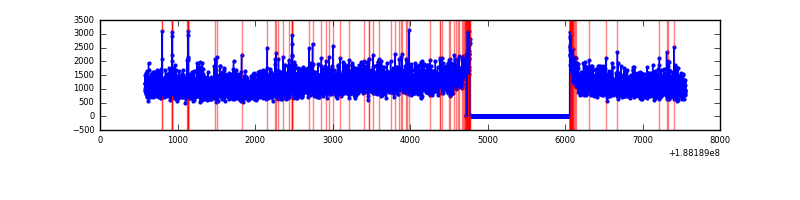 |
| B | 6969 | 5664 | 191 | 191 | 2.74% | 3.37% | 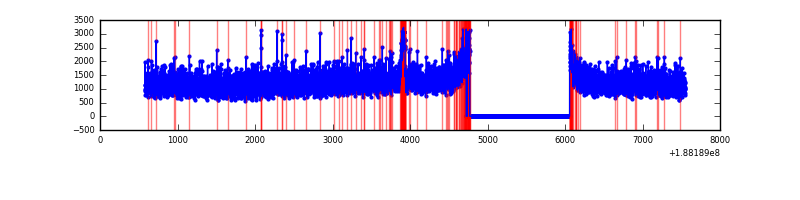 |
| C | 6969 | 5666 | 108 | 108 | 1.55% | 1.91% | 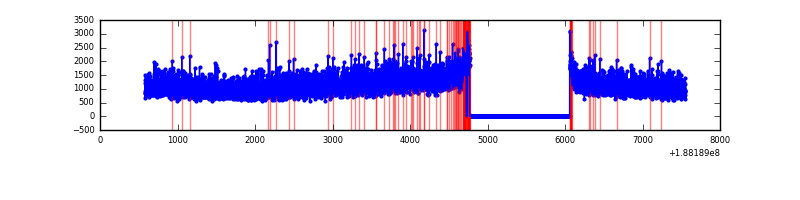 |
| D | 6969 | 5666 | 320 | 320 | 4.59% | 5.65% | 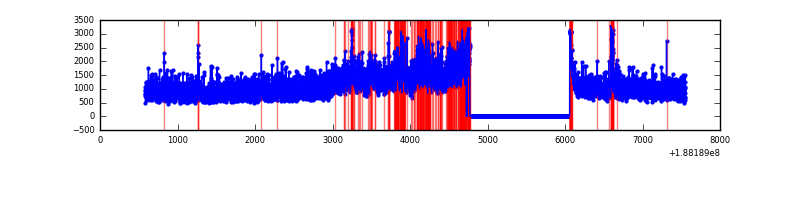 |
Top three noisy pixels from each quadrant. If the there are fewer than three noisy pixels in the level2.evt file, extra rows are filled as -1
| Pixel properties | Quadrant properties | ||||||
|---|---|---|---|---|---|---|---|
| Quadrant | DetID | PixID | Counts | Sigma | Mean | Median | Sigma |
| A | 12 | 243 | 30004 | 69.05 | 1717 | 1727 | 409.5 |
| A | 4 | 32 | 26289 | 59.98 | 1717 | 1727 | 409.5 |
| A | 11 | 79 | 7230 | 13.44 | 1717 | 1727 | 409.5 |
| B | 14 | 53 | 92087 | 218.02 | 1770 | 1778 | 414.2 |
| B | 12 | 52 | 54972 | 128.42 | 1770 | 1778 | 414.2 |
| B | 7 | 221 | 33522 | 76.64 | 1770 | 1778 | 414.2 |
| C | 15 | 241 | 294017 | 676.83 | 1561 | 1610 | 432.0 |
| C | 3 | 79 | 20910 | 44.67 | 1561 | 1610 | 432.0 |
| C | 3 | 111 | 20665 | 44.11 | 1561 | 1610 | 432.0 |
| D | 1 | 239 | 568665 | 1203.29 | 1531 | 1588 | 471.3 |
| D | 1 | 83 | 75181 | 156.16 | 1531 | 1588 | 471.3 |
| D | 10 | 84 | 69941 | 145.04 | 1531 | 1588 | 471.3 |
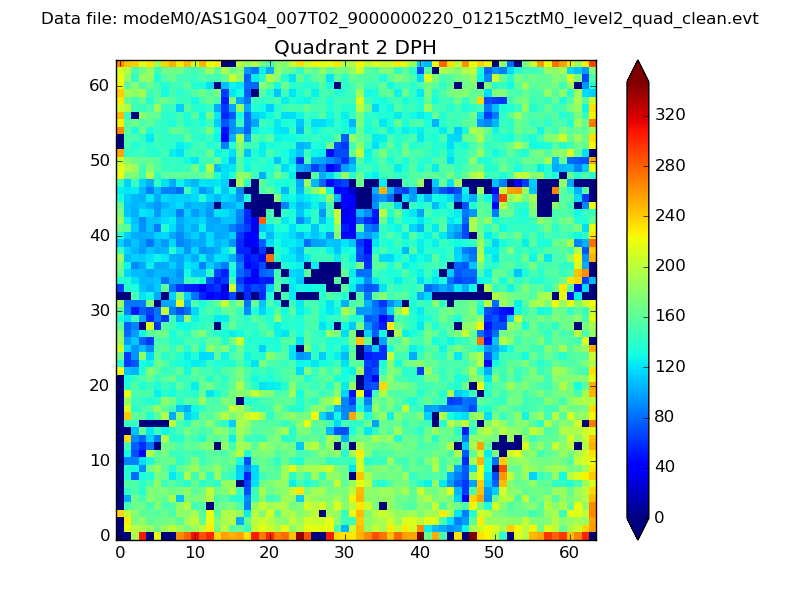
Histogram calculated using DETX and DETY for each event in the final _common_clean file
| Quadrant A | 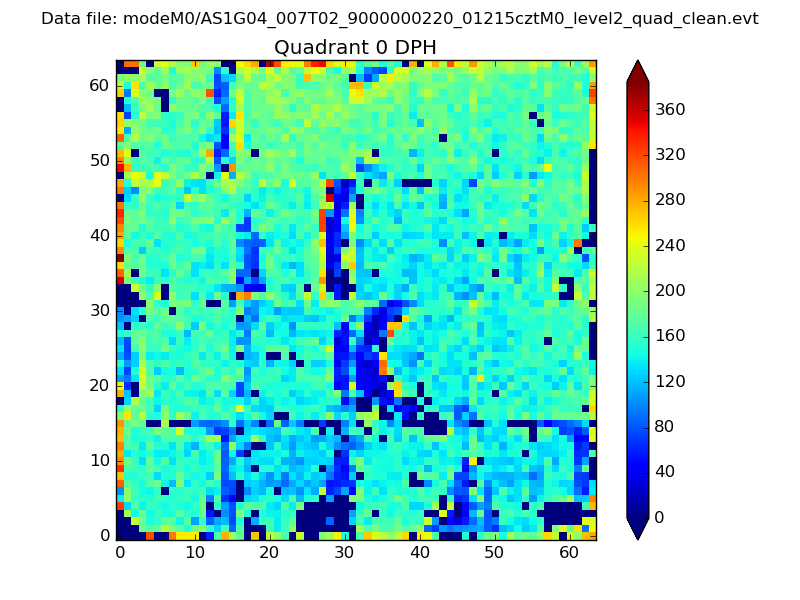 |
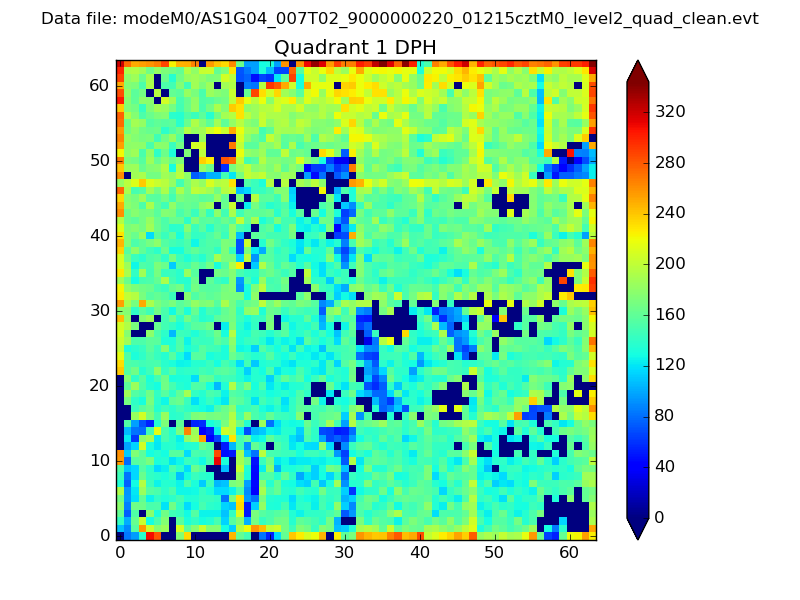 |
Quadrant B |
|---|---|---|---|
| Quadrant D | 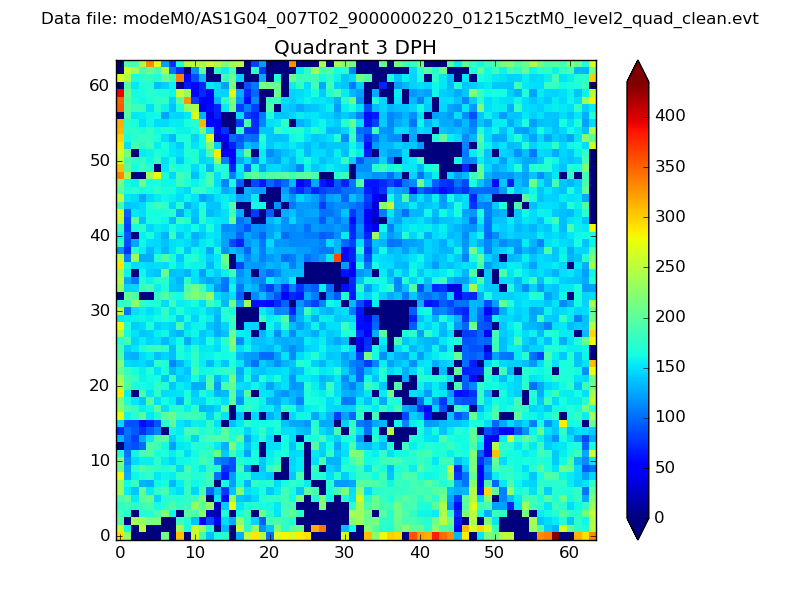 |
 |
Quadrant C |
| Plot type | Count rate plots | Images |
|---|---|---|
| Comparison with Poisson distribution Blue bars denote a histogram of data divided into 1 sec bins. Red curve is a Poisson curve with rate = median count rate of data. |
 |
 |
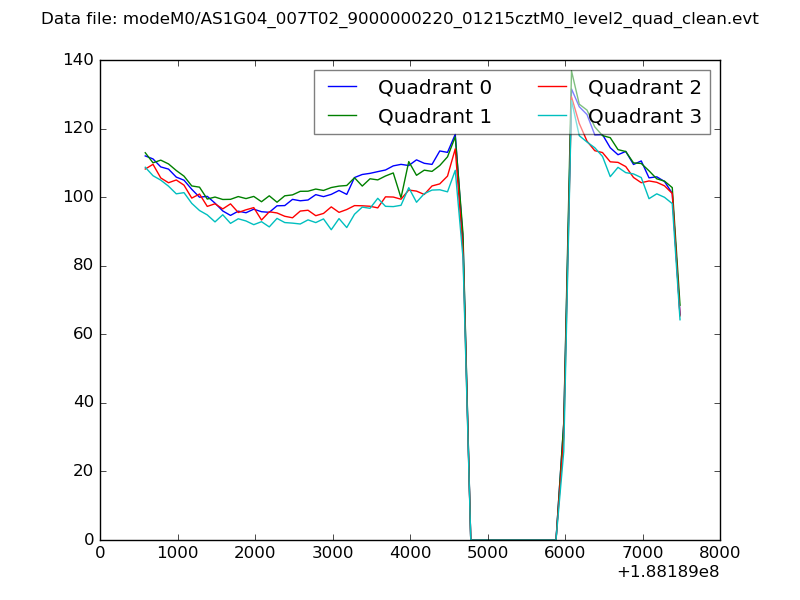
| Quadrant-wise count rates Data is divided into 100 sec bins |
 |
|
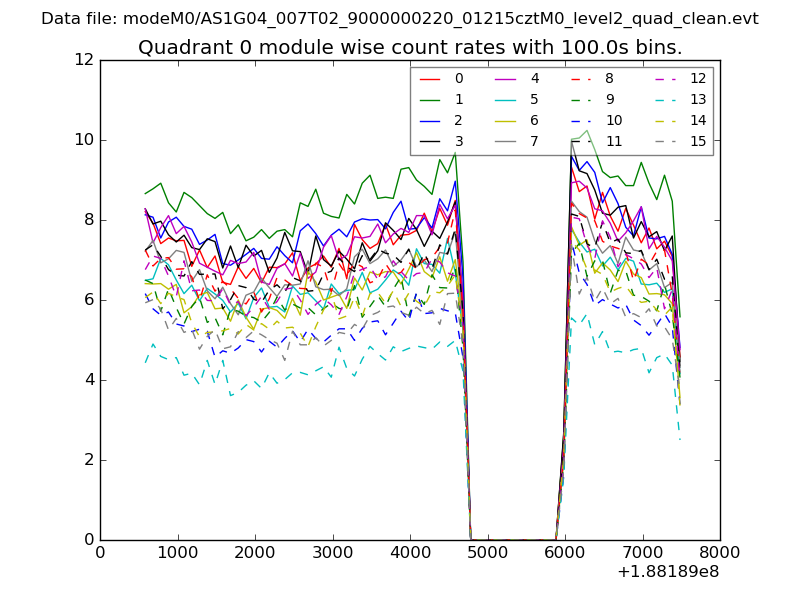
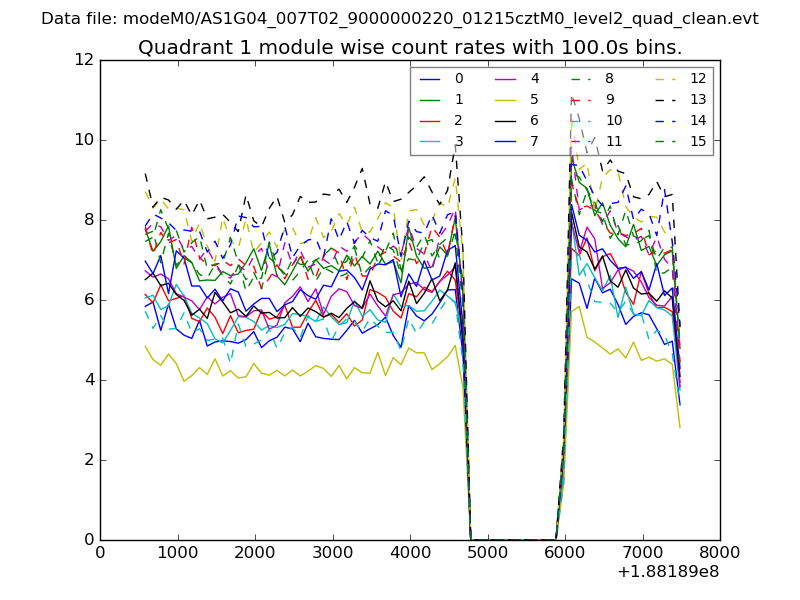
| Module-wise count rates for Quadrant A Data is divided into 100 sec bins |
 |
 |
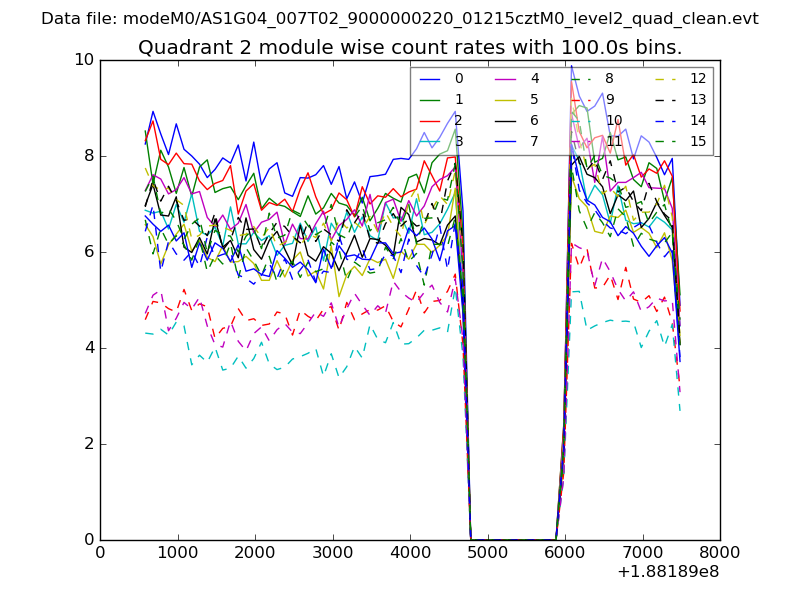
| Module-wise count rates for Quadrant B Data is divided into 100 sec bins |
 |
 |
| Module-wise count rates for Quadrant C Data is divided into 100 sec bins |
 |
 |
| Module-wise count rates for Quadrant D Data is divided into 100 sec bins |
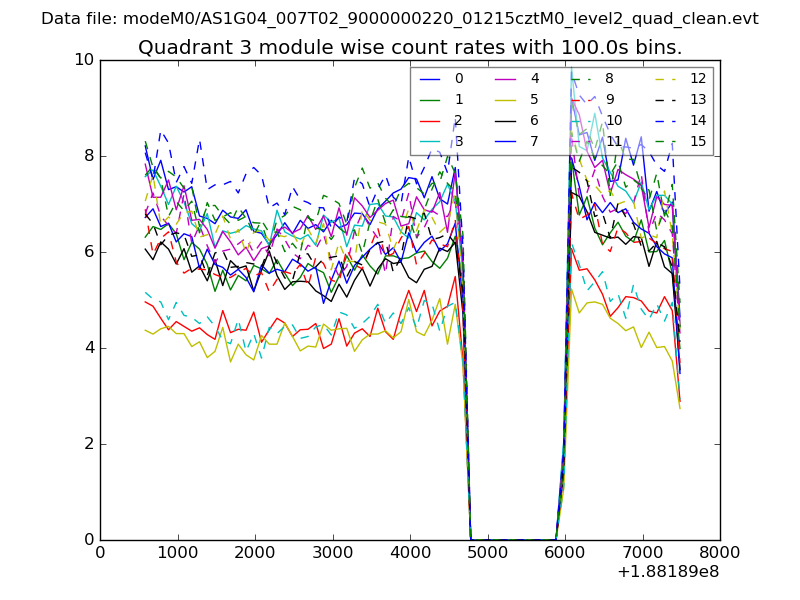 |
 |
| Parameter | Plot |
|---|---|
| CZT HV Monitor | 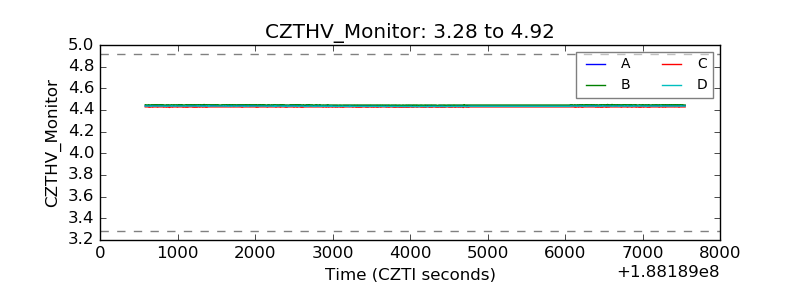 |
| D_VDD | 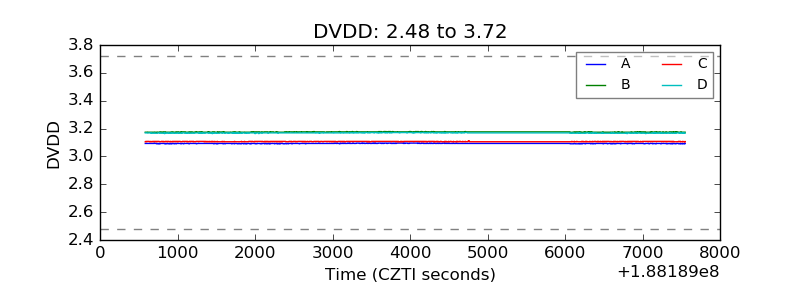 |
| Temperature 1 | 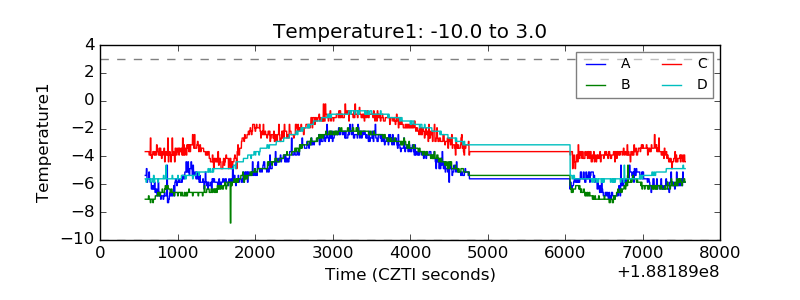 |
| Veto HV Monitor | 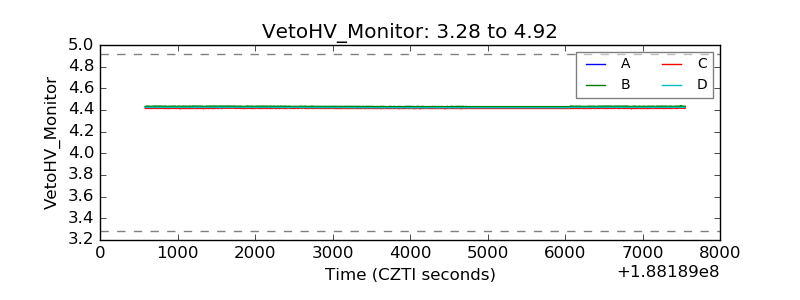 |
| Veto LLD | 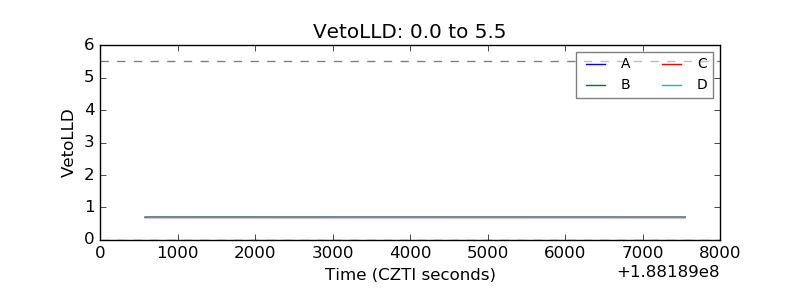 |
| Alpha Counter | 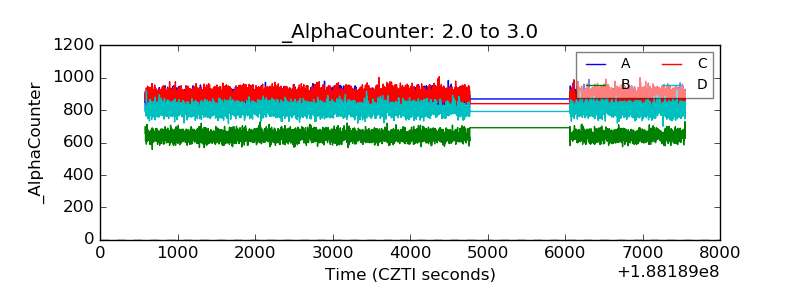 |
| _CPM_Rate | 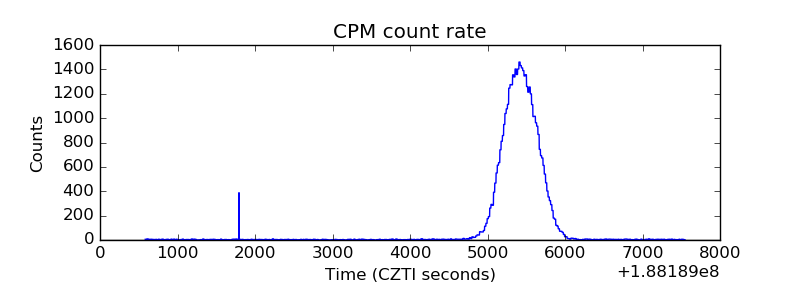 |
| CZT Counter | 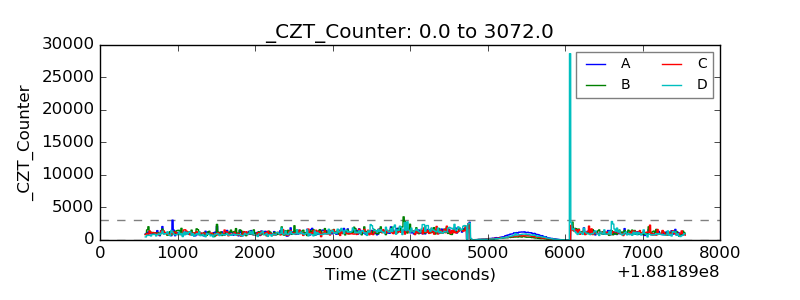 |
| +2.5 Volts monitor |  |
| +5 Volts monitor |  |
| _ROLL_ROT | 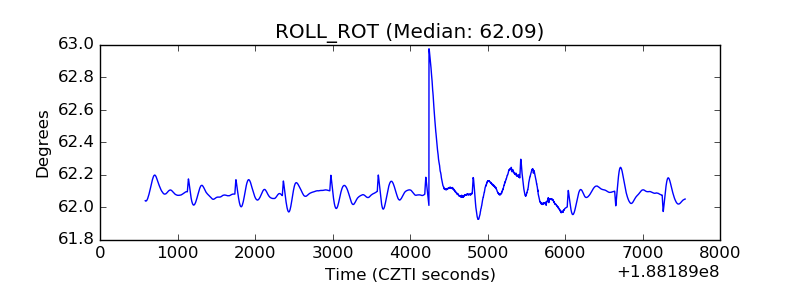 |
| _Roll_DEC | 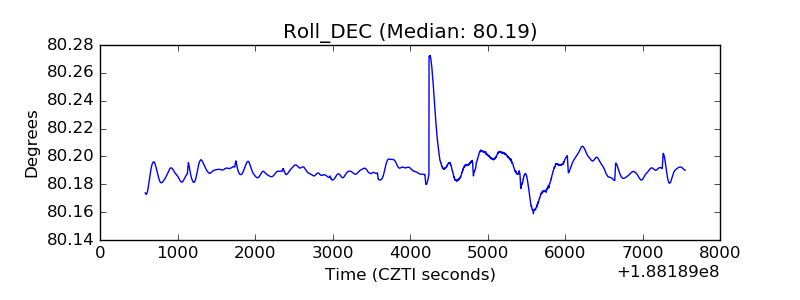 |
| _Roll_RA | 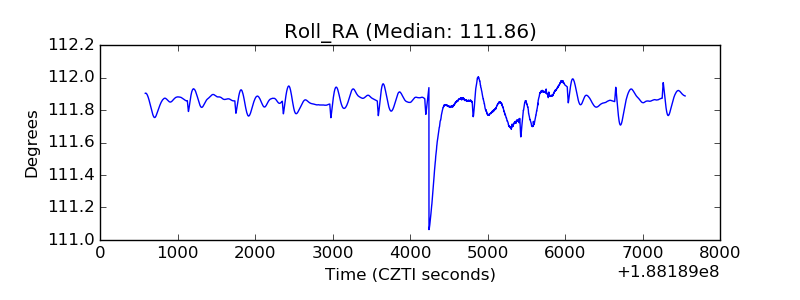 |
| Veto Counter |  |