| Param | Original file | Final file |
|---|---|---|
| Filename | modeM0/AS1G04_007T02_9000000220_01217cztM0_level2.evt | modeM0/AS1G04_007T02_9000000220_01217cztM0_level2_quad_clean.evt |
| Size (bytes) | 1,065,669,120 | 98,576,640 |
| Size | 1016.3 MB | 94.0 MB |
| Events in quadrant A | 7,677,522 | 652,615 |
| Events in quadrant B | 7,997,293 | 657,064 |
| Events in quadrant C | 7,444,182 | 627,971 |
| Events in quadrant D | 8,734,894 | 605,063 |
| Mode M9 | |||
|---|---|---|---|
| Quadrant | BADHDUFLAG | Total packets | Discarded packets |
| A | 0 | 11 | 0 |
| B | 0 | 11 | 0 |
| C | 0 | 11 | 0 |
| D | 0 | 11 | 0 |
| Mode M0 | |||
|---|---|---|---|
| Quadrant | BADHDUFLAG | Total packets | Discarded packets |
| A | 0 | 27279 | 2 |
| B | 0 | 28271 | 1 |
| C | 0 | 26585 | 1 |
| D | 0 | 30433 | 1 |
| Mode SS | |||
|---|---|---|---|
| Quadrant | BADHDUFLAG | Total packets | Discarded packets |
| A | 0 | 130 | 0 |
| B | 0 | 130 | 0 |
| C | 0 | 130 | 0 |
| D | 0 | 130 | 0 |
| Quadrant | Total seconds | Saturated seconds | Saturation percentage |
|---|---|---|---|
| A | 6339 | 25 | 0.394384% |
| B | 6339 | 60 | 0.946522% |
| C | 6339 | 19 | 0.299732% |
| D | 6339 | 231 | 3.644108% |
Noise dominated data is calculated using 1-second bins in cleaned event files. If a bin has >2000 counts, and if more than 50% of those come from <1% of pixels, then it is considered to be noise-dominated and hence unusable.
| Quadrant | # 1 sec bins | Bins with >0 counts | Bins with >2000 counts | High rate bins dominated by noise | Noise dominated (total time) | Noise dominated (detector-on time) | Marked lightcurve |
|---|---|---|---|---|---|---|---|
| A | 7429 | 6339 | 225 | 225 | 3.03% | 3.55% |  |
| B | 7429 | 6340 | 295 | 295 | 3.97% | 4.65% |  |
| C | 7429 | 6340 | 216 | 216 | 2.91% | 3.41% |  |
| D | 7429 | 6340 | 923 | 923 | 12.42% | 14.56% |  |
Top three noisy pixels from each quadrant. If the there are fewer than three noisy pixels in the level2.evt file, extra rows are filled as -1
| Pixel properties | Quadrant properties | ||||||
|---|---|---|---|---|---|---|---|
| Quadrant | DetID | PixID | Counts | Sigma | Mean | Median | Sigma |
| A | 15 | 127 | 103824 | 215.06 | 1969 | 1981 | 473.6 |
| A | 8 | 14 | 10894 | 18.82 | 1969 | 1981 | 473.6 |
| A | 11 | 79 | 8623 | 14.03 | 1969 | 1981 | 473.6 |
| B | 6 | 53 | 123840 | 255.26 | 2028 | 2035 | 477.2 |
| B | 15 | 22 | 54169 | 109.25 | 2028 | 2035 | 477.2 |
| B | 7 | 221 | 30115 | 58.84 | 2028 | 2035 | 477.2 |
| C | 15 | 241 | 326137 | 645.82 | 1805 | 1862 | 502.1 |
| C | 3 | 79 | 24631 | 45.35 | 1805 | 1862 | 502.1 |
| C | 3 | 111 | 23723 | 43.54 | 1805 | 1862 | 502.1 |
| D | 1 | 239 | 1204639 | 2216.5 | 1759 | 1819 | 542.7 |
| D | 2 | 16 | 731261 | 1344.18 | 1759 | 1819 | 542.7 |
| D | 13 | 70 | 83727 | 150.94 | 1759 | 1819 | 542.7 |
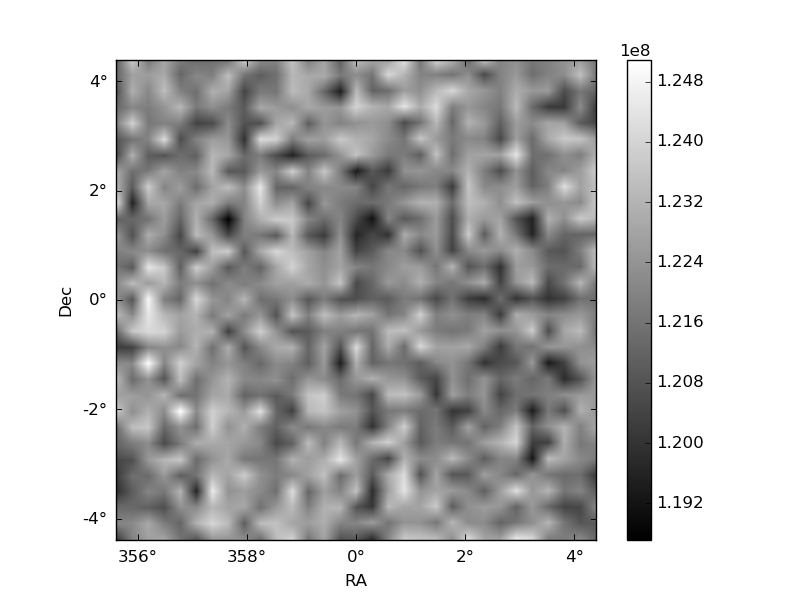
Histogram calculated using DETX and DETY for each event in the final _common_clean file
| Quadrant A | 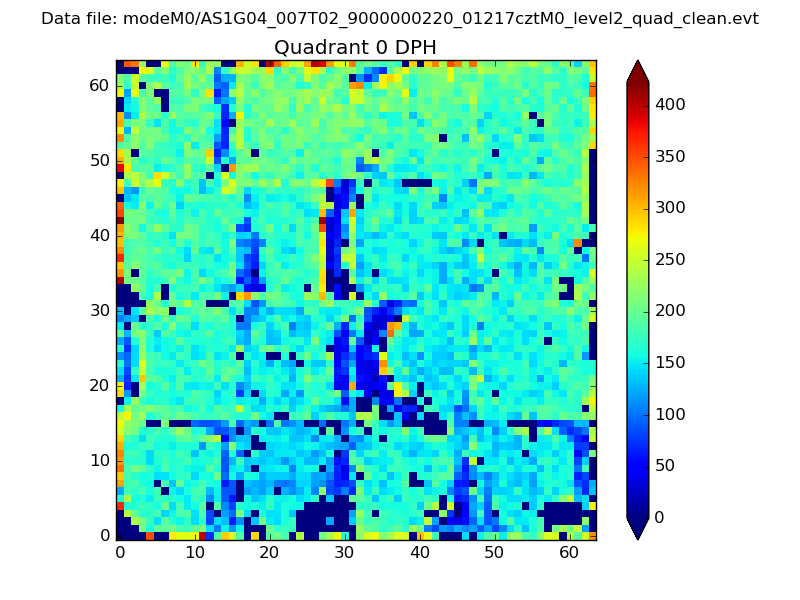 |
 |
Quadrant B |
|---|---|---|---|
| Quadrant D |  |
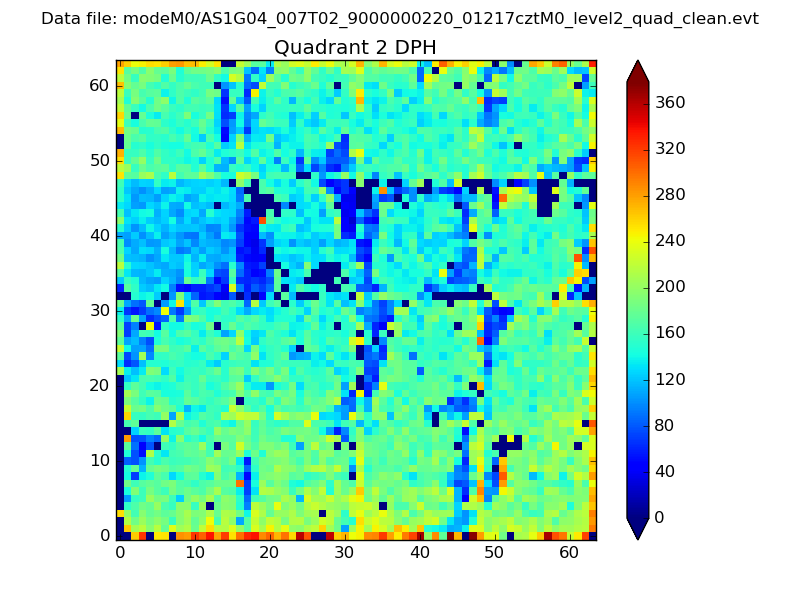 |
Quadrant C |
| Plot type | Count rate plots | Images |
|---|---|---|
| Comparison with Poisson distribution Blue bars denote a histogram of data divided into 1 sec bins. Red curve is a Poisson curve with rate = median count rate of data. |
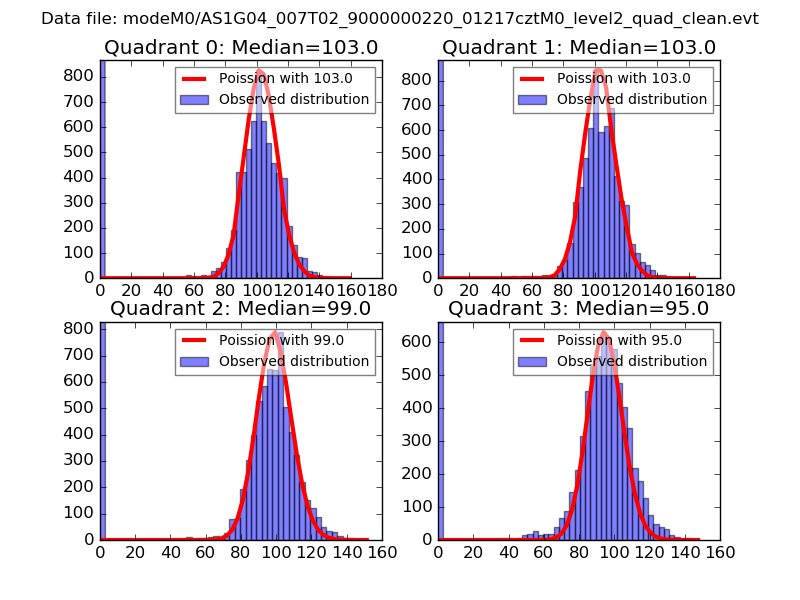 |
 |
| Quadrant-wise count rates Data is divided into 100 sec bins |
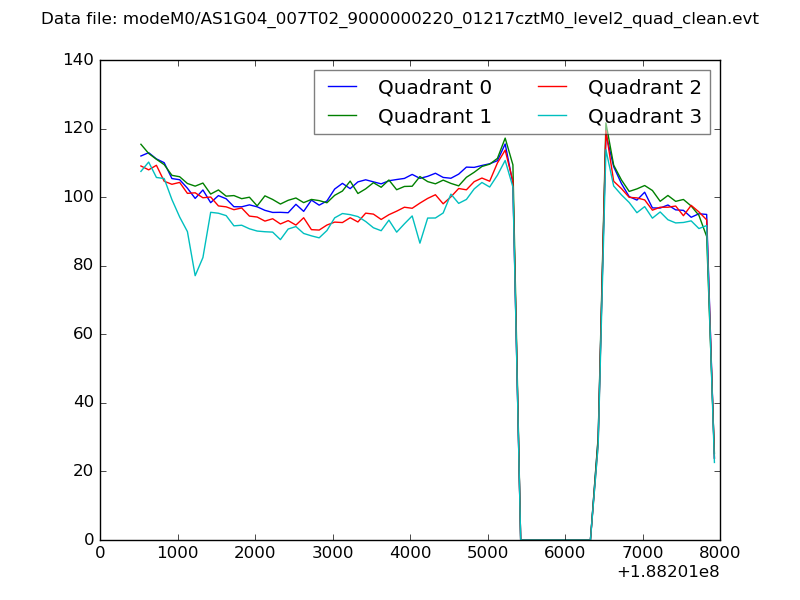 |
|
| Module-wise count rates for Quadrant A Data is divided into 100 sec bins |
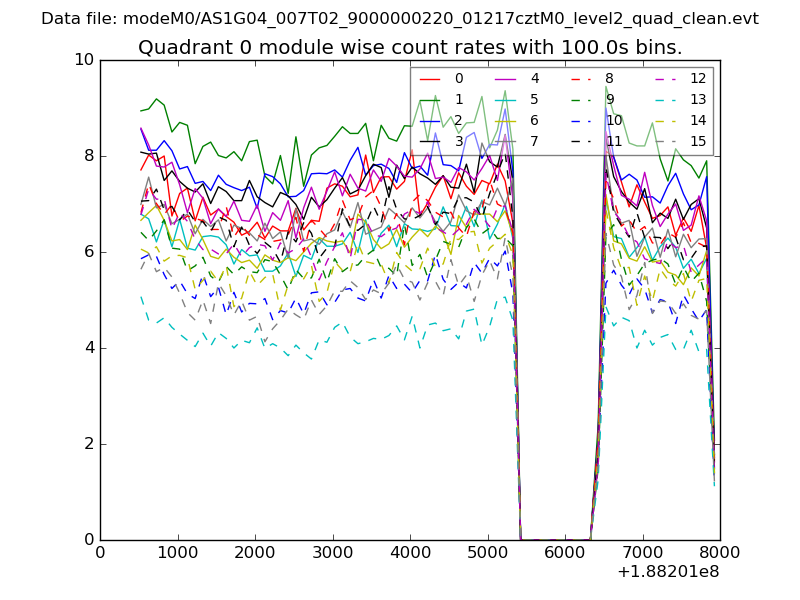 |
 |
| Module-wise count rates for Quadrant B Data is divided into 100 sec bins |
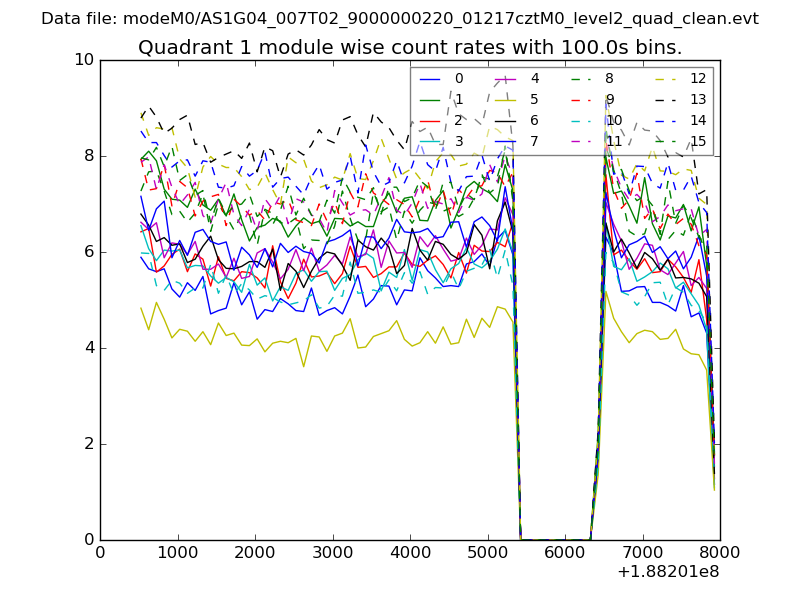 |
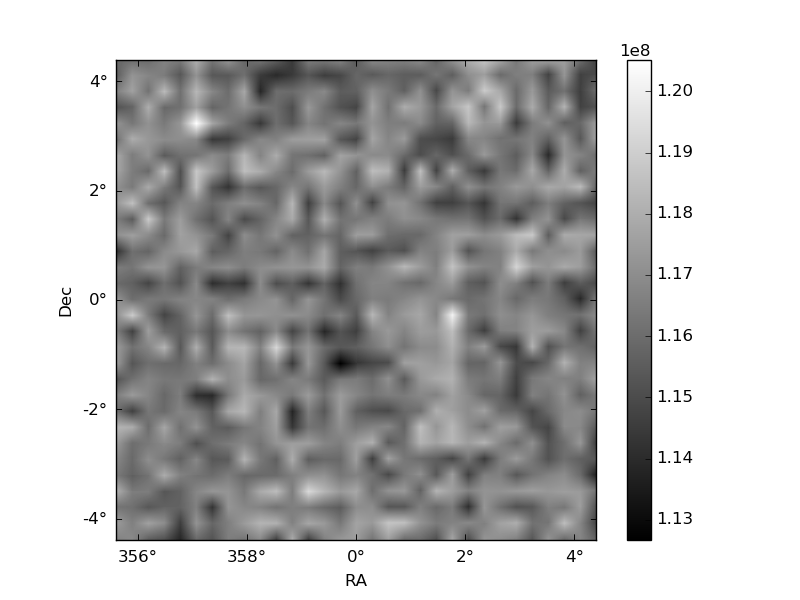 |
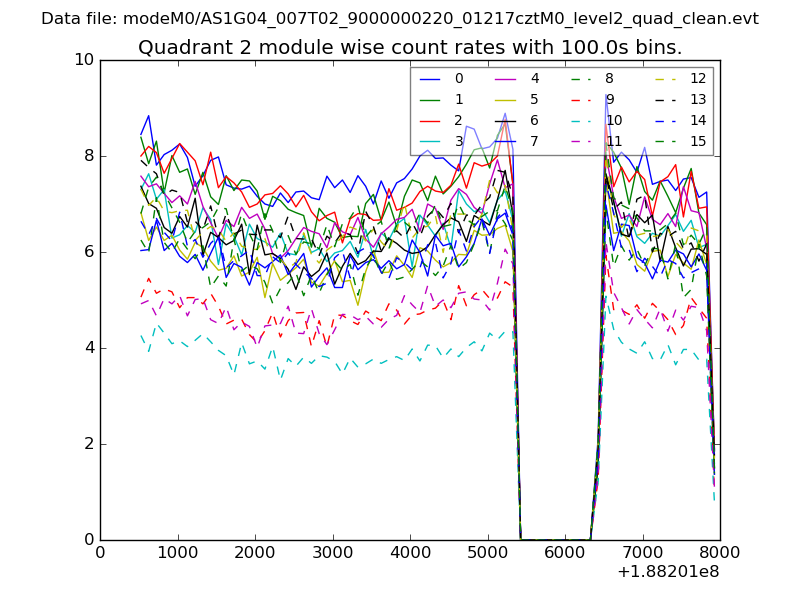
| Module-wise count rates for Quadrant C Data is divided into 100 sec bins |
 |
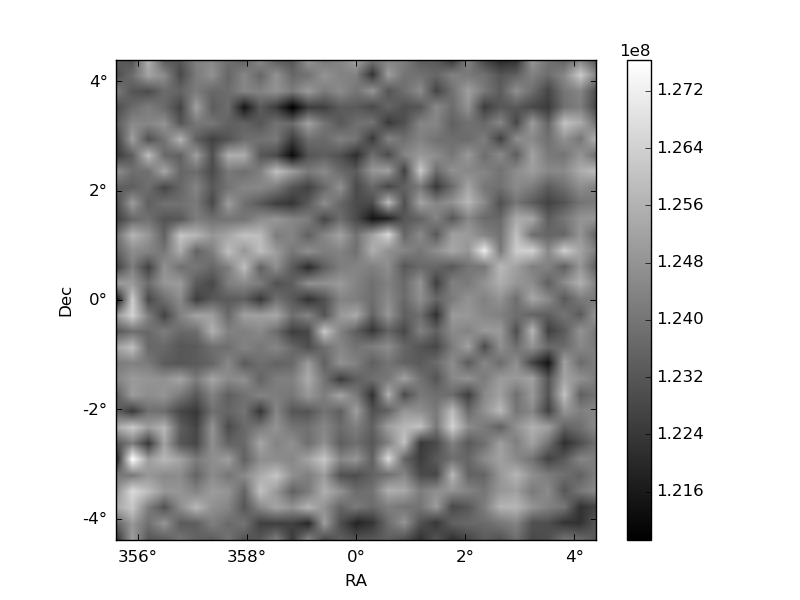 |
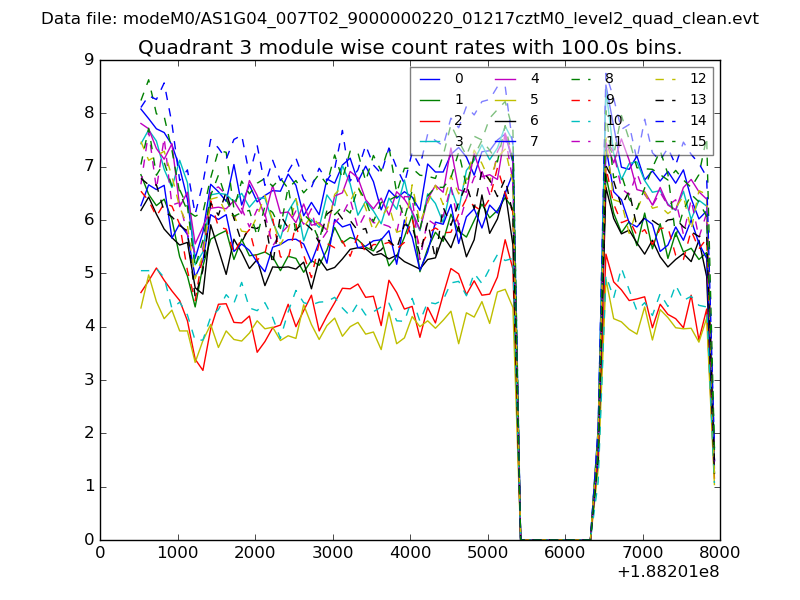
| Module-wise count rates for Quadrant D Data is divided into 100 sec bins |
 |
 |
| Parameter | Plot |
|---|---|
| CZT HV Monitor | 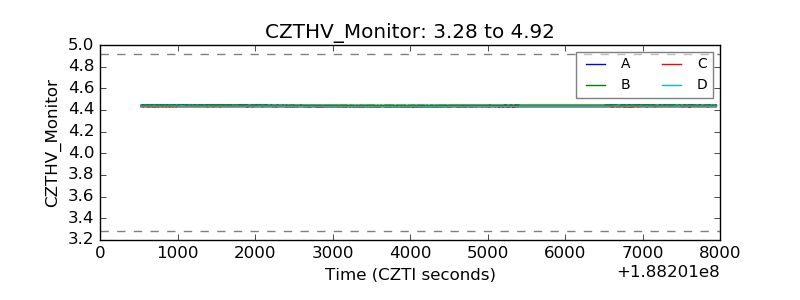 |
| D_VDD | 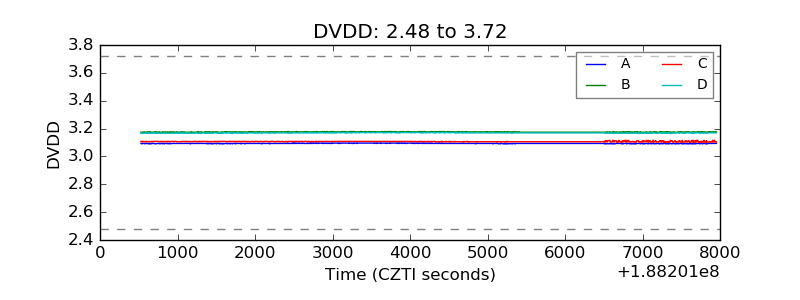 |
| Temperature 1 | 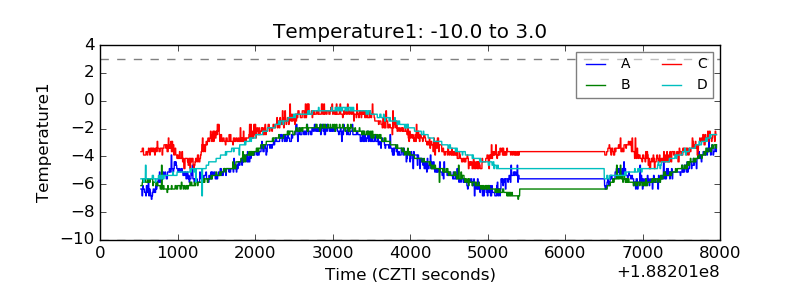 |
| Veto HV Monitor | 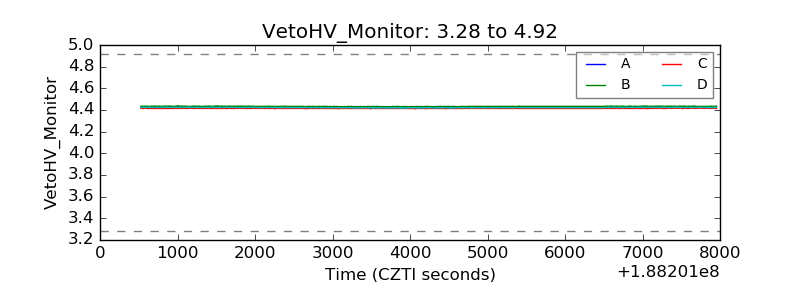 |
| Veto LLD | 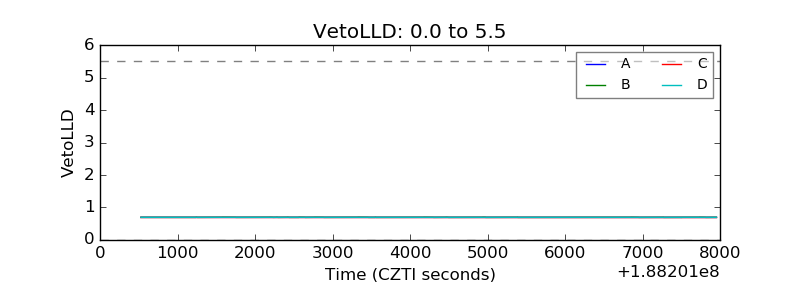 |
| Alpha Counter | 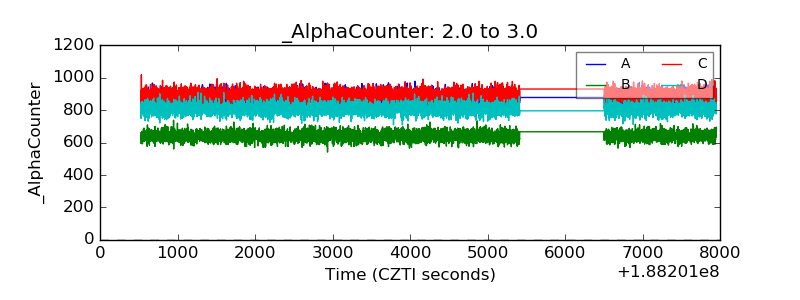 |
| _CPM_Rate | 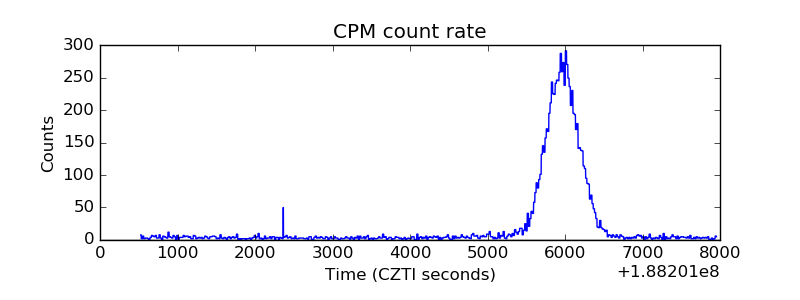 |
| CZT Counter | 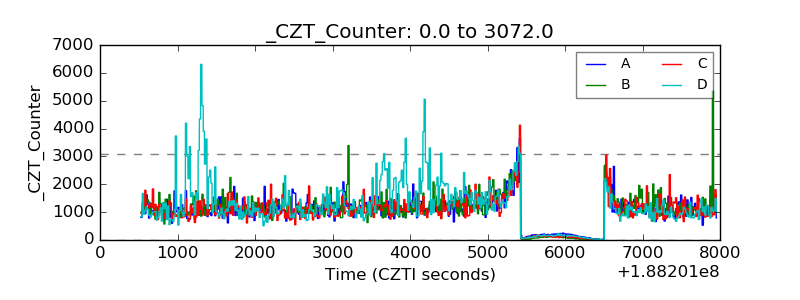 |
| +2.5 Volts monitor |  |
| +5 Volts monitor |  |
| _ROLL_ROT | 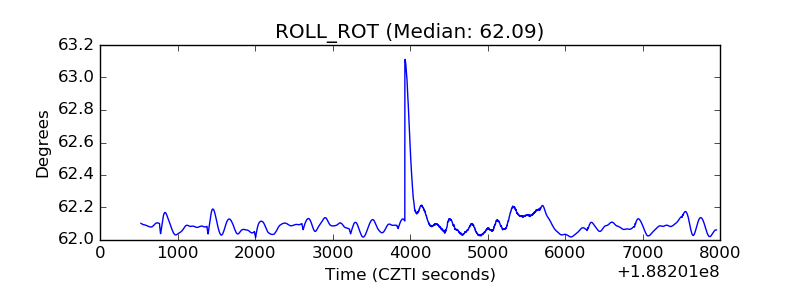 |
| _Roll_DEC | 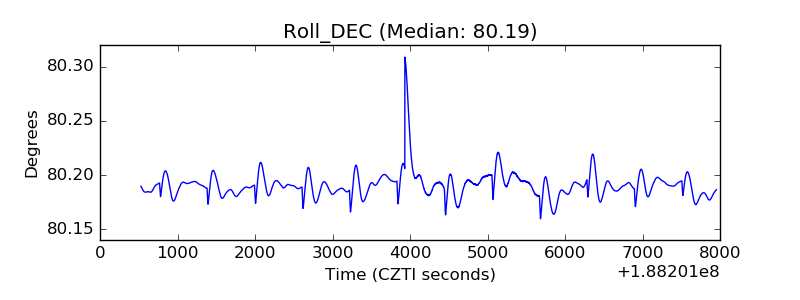 |
| _Roll_RA | 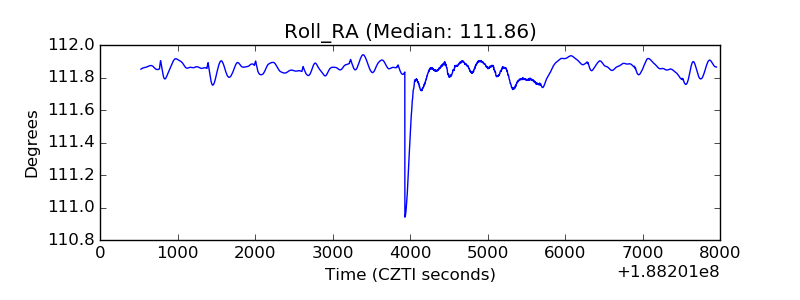 |
| Veto Counter | 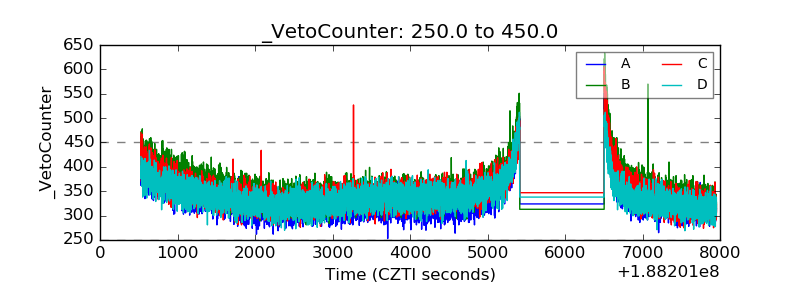 |