| Param | Original file | Final file |
|---|---|---|
| Filename | modeM0/AS1G04_007T02_9000000220_01219cztM0_level2.evt | modeM0/AS1G04_007T02_9000000220_01219cztM0_level2_quad_clean.evt |
| Size (bytes) | 1,305,371,520 | 101,027,520 |
| Size | 1.2 GB | 96.3 MB |
| Events in quadrant A | 8,917,254 | 672,557 |
| Events in quadrant B | 9,179,022 | 672,029 |
| Events in quadrant C | 8,414,664 | 649,073 |
| Events in quadrant D | 12,573,322 | 590,562 |
| Mode M9 | |||
|---|---|---|---|
| Quadrant | BADHDUFLAG | Total packets | Discarded packets |
| A | 0 | 1 | 0 |
| B | 0 | 1 | 0 |
| C | 0 | 1 | 0 |
| D | 0 | 1 | 0 |
| Mode M0 | |||
|---|---|---|---|
| Quadrant | BADHDUFLAG | Total packets | Discarded packets |
| A | 0 | 31290 | 2 |
| B | 0 | 32080 | 1 |
| C | 0 | 29850 | 1 |
| D | 0 | 42314 | 1 |
| Mode SS | |||
|---|---|---|---|
| Quadrant | BADHDUFLAG | Total packets | Discarded packets |
| A | 0 | 138 | 0 |
| B | 0 | 138 | 0 |
| C | 0 | 138 | 0 |
| D | 0 | 138 | 0 |
| Quadrant | Total seconds | Saturated seconds | Saturation percentage |
|---|---|---|---|
| A | 6814 | 132 | 1.937188% |
| B | 6814 | 85 | 1.247432% |
| C | 6814 | 39 | 0.572351% |
| D | 6814 | 1113 | 16.334018% |
Noise dominated data is calculated using 1-second bins in cleaned event files. If a bin has >2000 counts, and if more than 50% of those come from <1% of pixels, then it is considered to be noise-dominated and hence unusable.
| Quadrant | # 1 sec bins | Bins with >0 counts | Bins with >2000 counts | High rate bins dominated by noise | Noise dominated (total time) | Noise dominated (detector-on time) | Marked lightcurve |
|---|---|---|---|---|---|---|---|
| A | 6934 | 6816 | 631 | 631 | 9.10% | 9.26% | 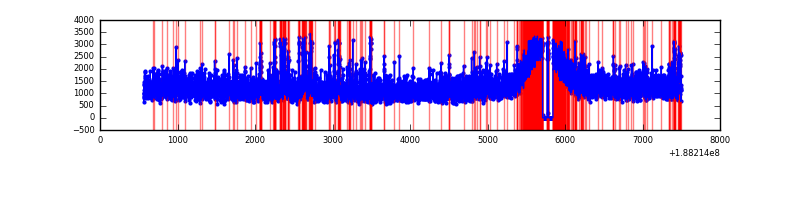 |
| B | 6934 | 6815 | 605 | 605 | 8.73% | 8.88% | 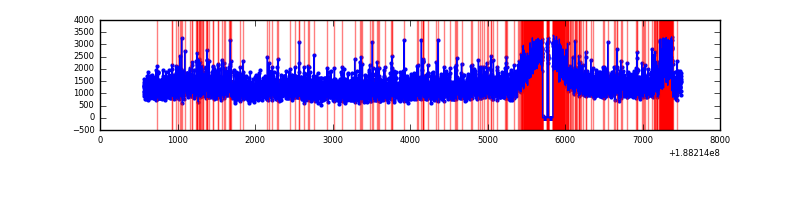 |
| C | 6934 | 6815 | 357 | 357 | 5.15% | 5.24% | 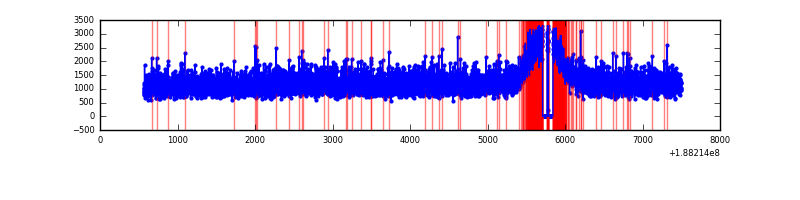 |
| D | 6933 | 6815 | 2594 | 2594 | 37.42% | 38.06% | 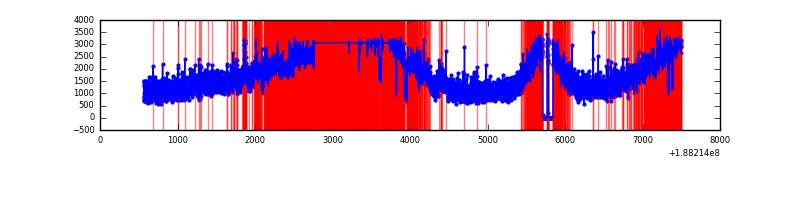 |
Top three noisy pixels from each quadrant. If the there are fewer than three noisy pixels in the level2.evt file, extra rows are filled as -1
| Pixel properties | Quadrant properties | ||||||
|---|---|---|---|---|---|---|---|
| Quadrant | DetID | PixID | Counts | Sigma | Mean | Median | Sigma |
| A | 15 | 127 | 445470 | 831.25 | 2202 | 2219 | 533.2 |
| A | 13 | 34 | 16122 | 26.07 | 2202 | 2219 | 533.2 |
| A | 11 | 79 | 8180 | 11.18 | 2202 | 2219 | 533.2 |
| B | 2 | 32 | 208437 | 381.01 | 2257 | 2261 | 541.1 |
| B | 12 | 52 | 127259 | 230.99 | 2257 | 2261 | 541.1 |
| B | 6 | 53 | 75847 | 135.98 | 2257 | 2261 | 541.1 |
| C | 15 | 241 | 360756 | 628.42 | 2039 | 2111 | 570.7 |
| C | 3 | 79 | 41923 | 69.76 | 2039 | 2111 | 570.7 |
| C | 3 | 111 | 31643 | 51.75 | 2039 | 2111 | 570.7 |
| D | 1 | 239 | 4858179 | 8036.52 | 1933 | 2003 | 604.3 |
| D | 13 | 70 | 176222 | 288.32 | 1933 | 2003 | 604.3 |
| D | 1 | 83 | 76141 | 122.69 | 1933 | 2003 | 604.3 |
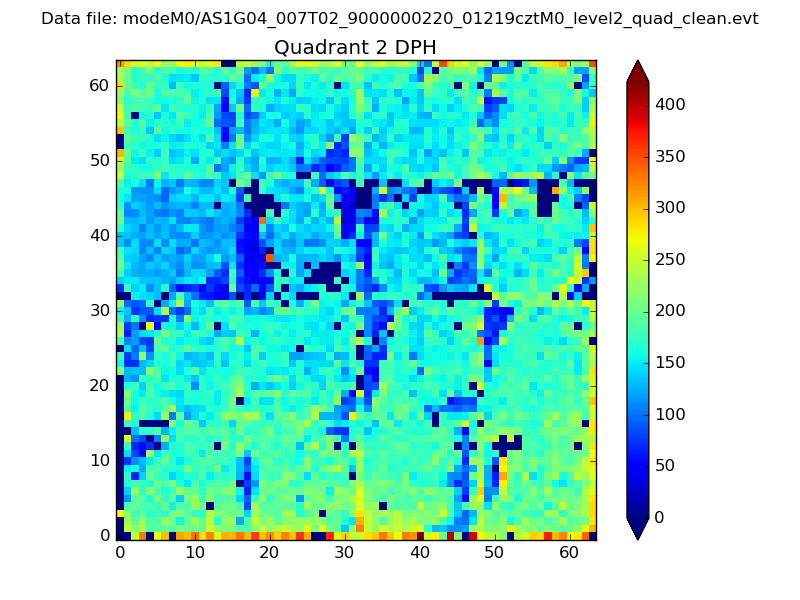
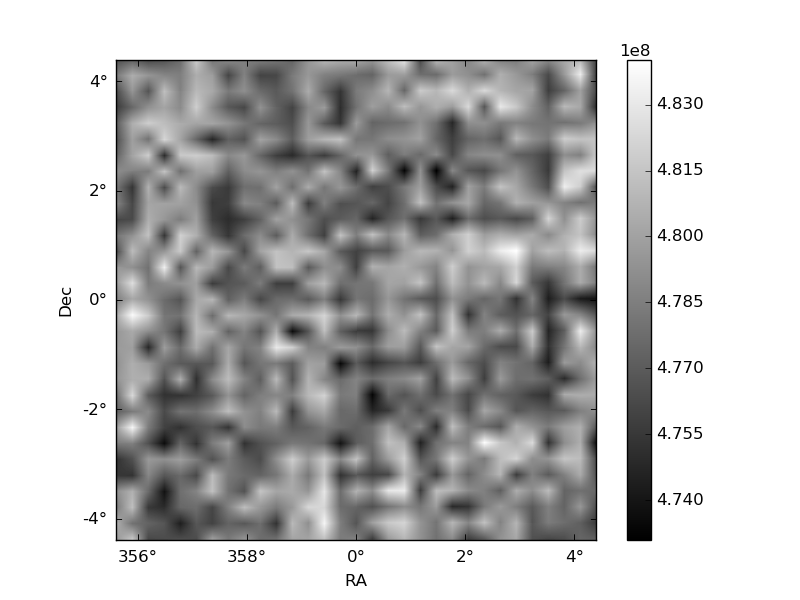
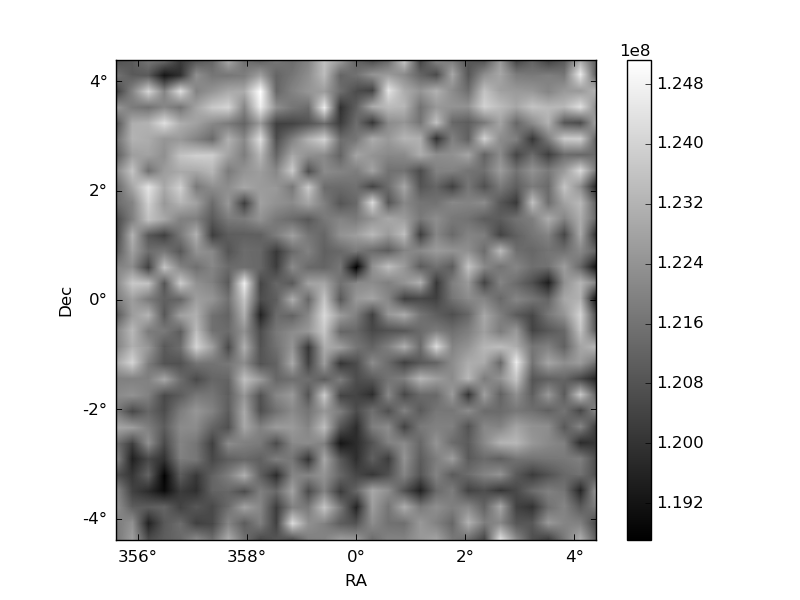
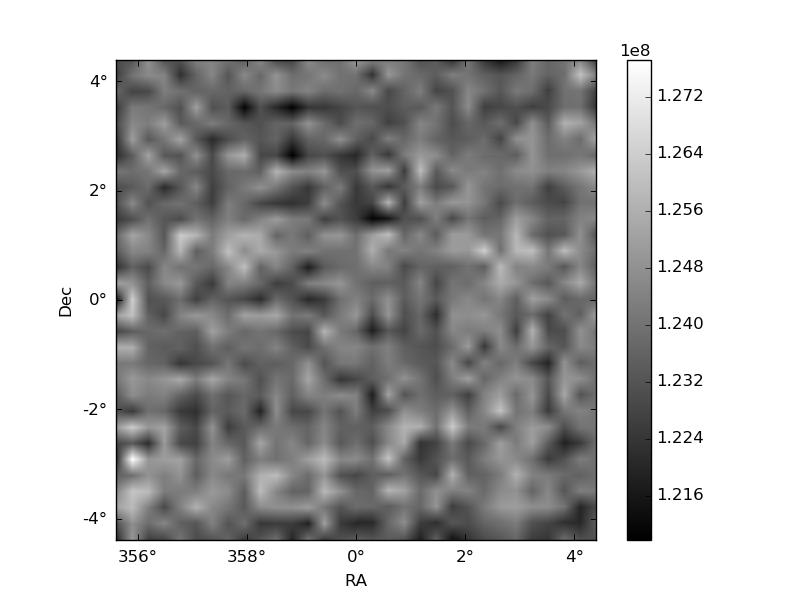
Histogram calculated using DETX and DETY for each event in the final _common_clean file
| Quadrant A | 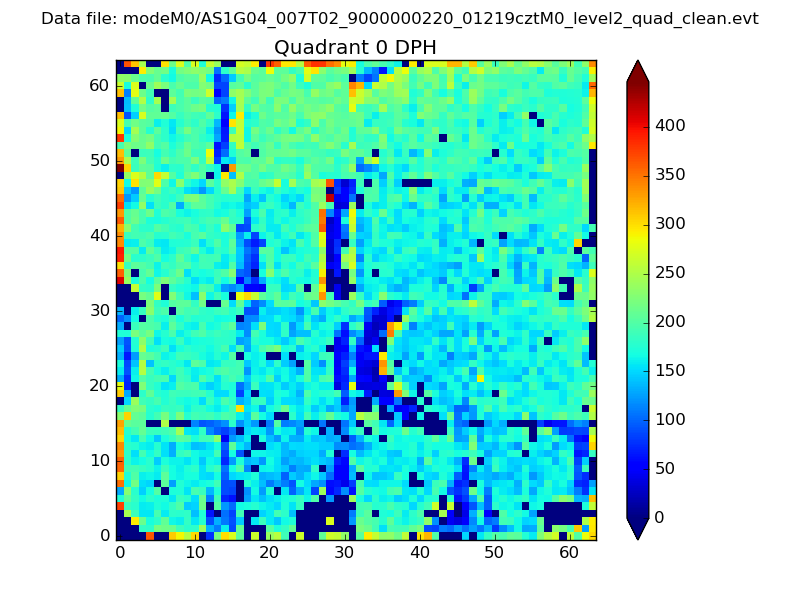 |
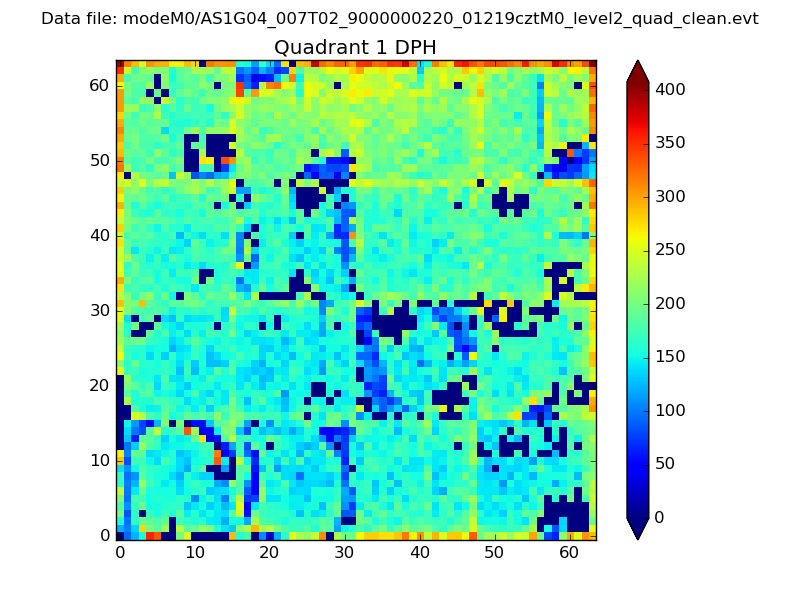 |
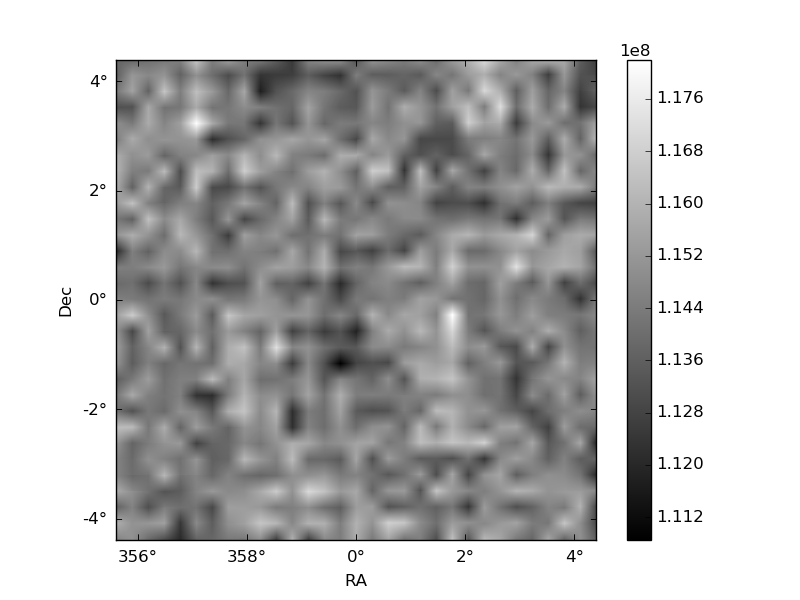
Quadrant B |
|---|---|---|---|
| Quadrant D | 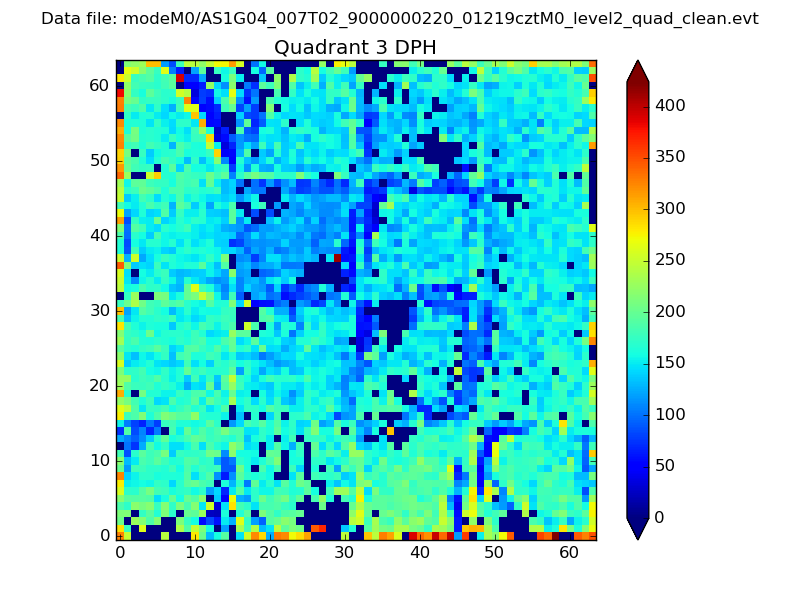 |
 |
Quadrant C |
| Plot type | Count rate plots | Images |
|---|---|---|
| Comparison with Poisson distribution Blue bars denote a histogram of data divided into 1 sec bins. Red curve is a Poisson curve with rate = median count rate of data. |
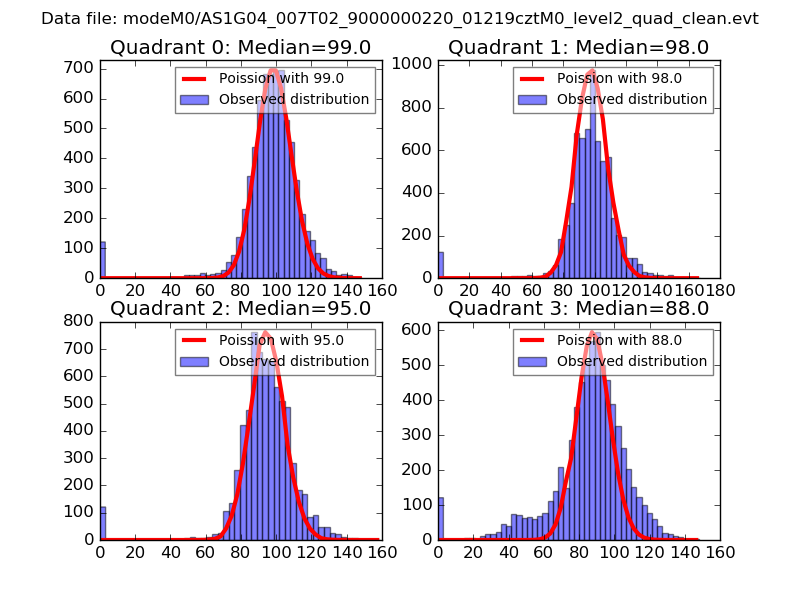 |
 |
| Quadrant-wise count rates Data is divided into 100 sec bins |
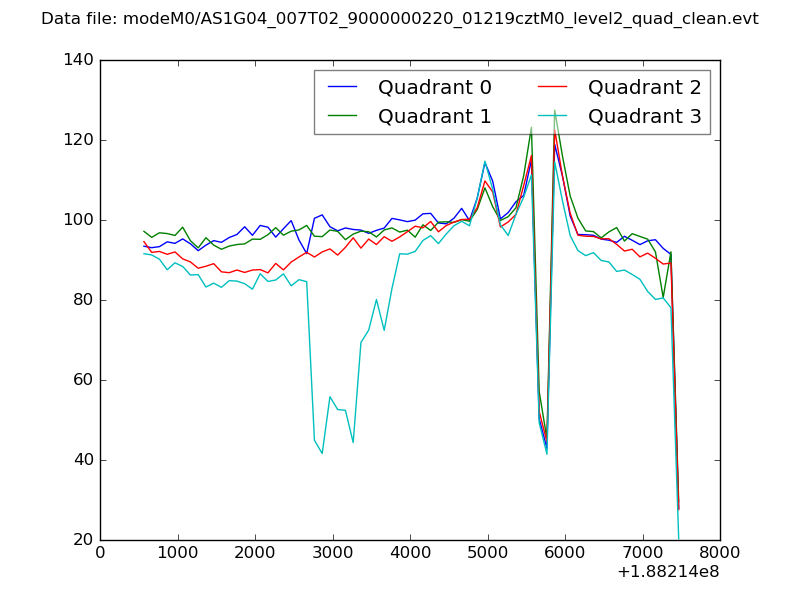 |
|
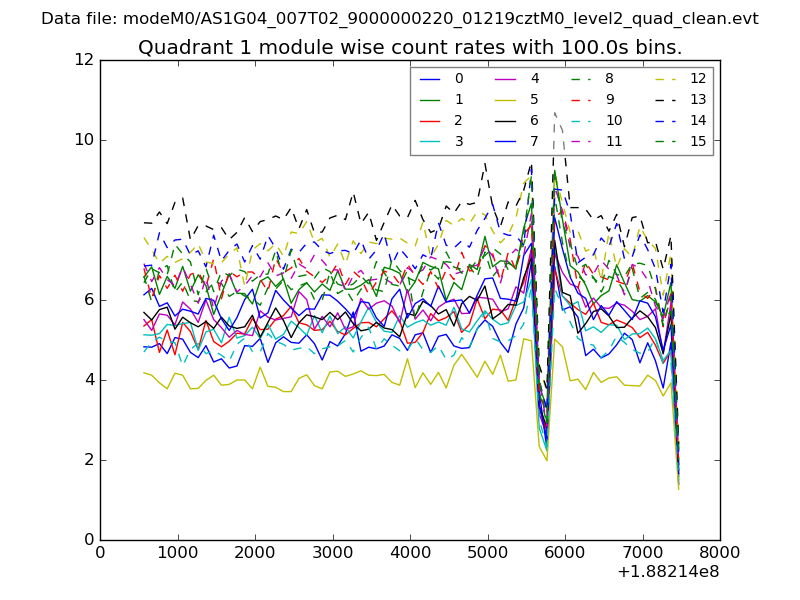
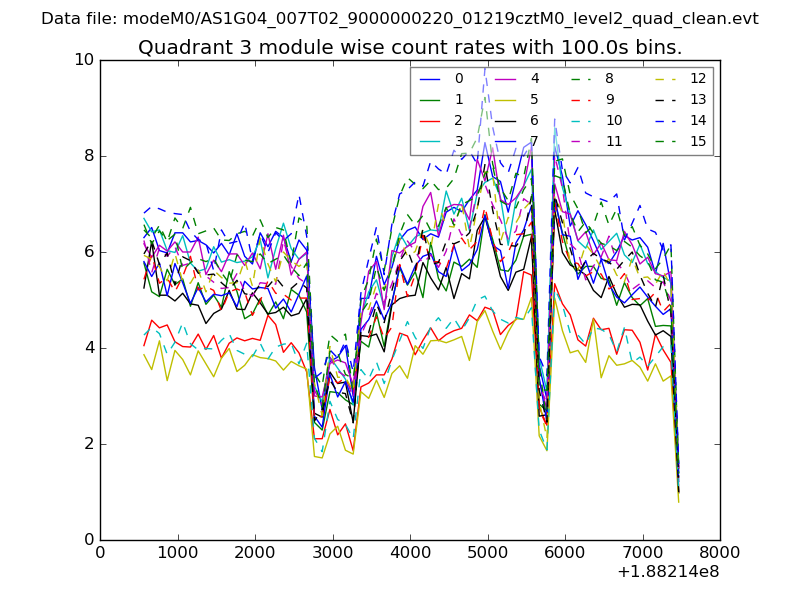
| Module-wise count rates for Quadrant A Data is divided into 100 sec bins |
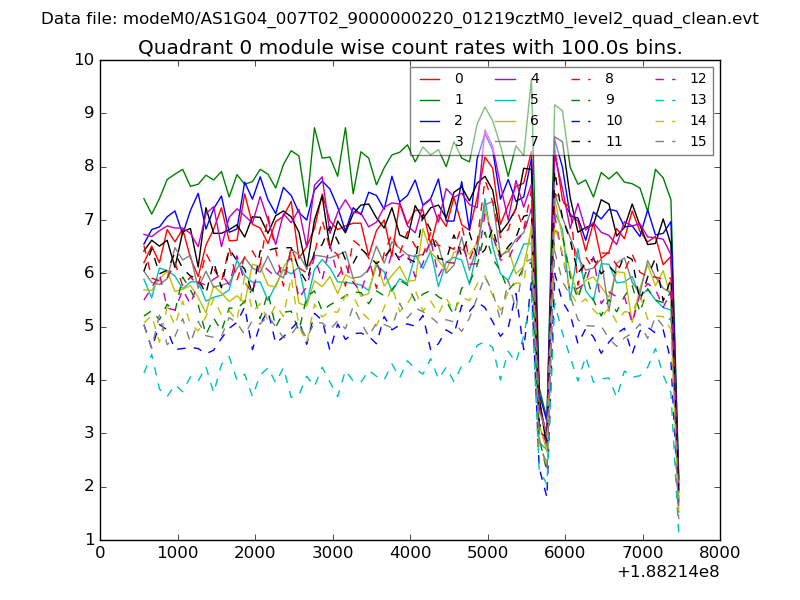 |
 |
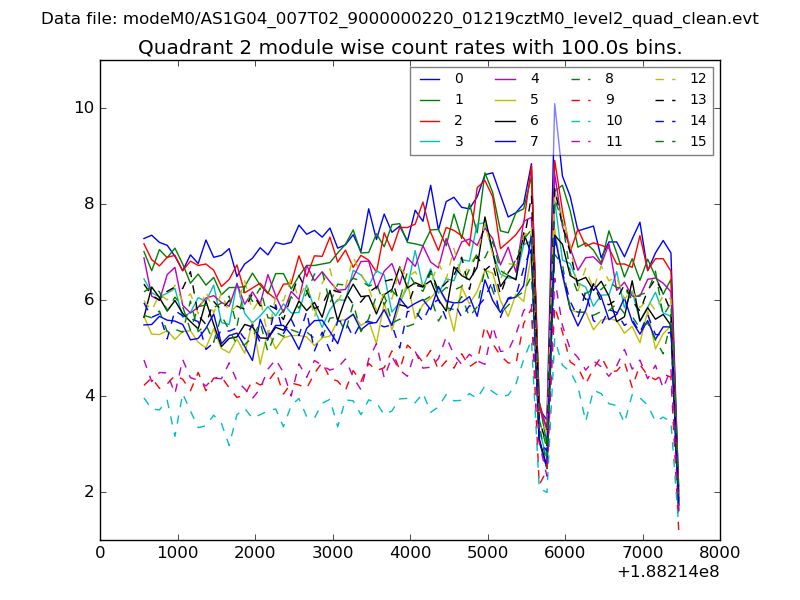
| Module-wise count rates for Quadrant B Data is divided into 100 sec bins |
 |
 |
| Module-wise count rates for Quadrant C Data is divided into 100 sec bins |
 |
 |
| Module-wise count rates for Quadrant D Data is divided into 100 sec bins |
 |
 |
| Parameter | Plot |
|---|---|
| CZT HV Monitor | 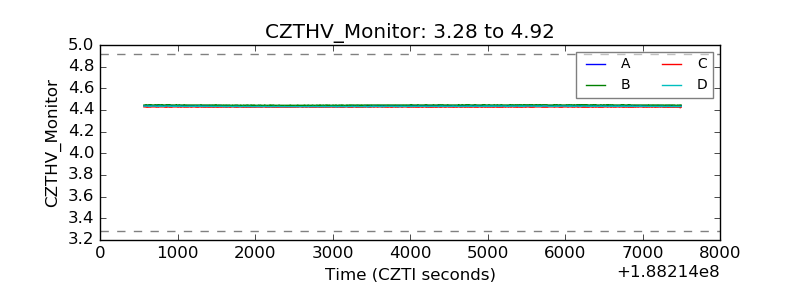 |
| D_VDD |  |
| Temperature 1 | 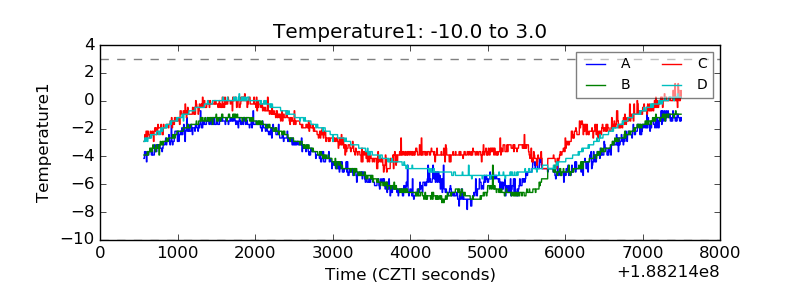 |
| Veto HV Monitor | 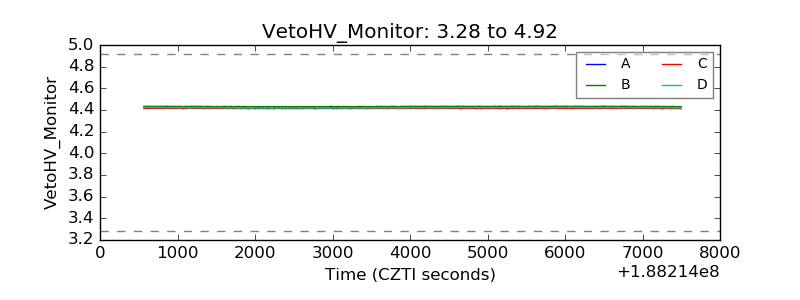 |
| Veto LLD | 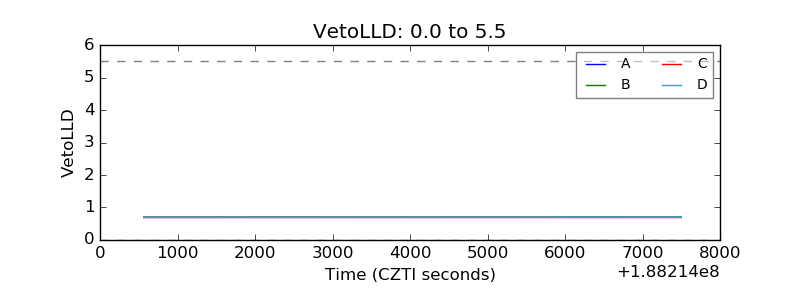 |
| Alpha Counter | 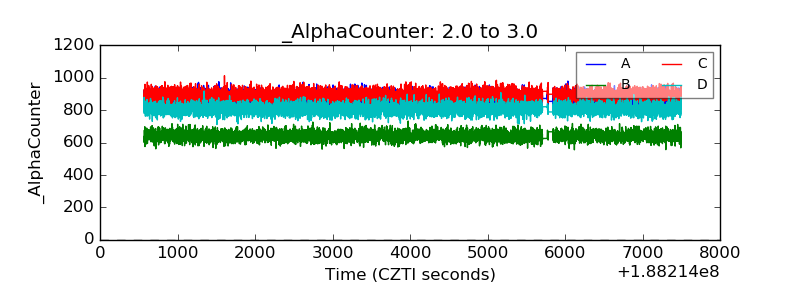 |
| _CPM_Rate | 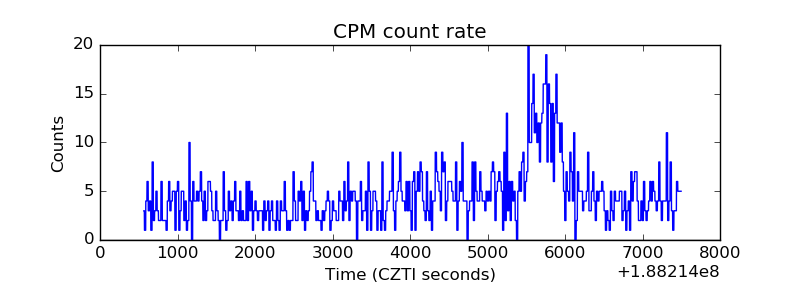 |
| CZT Counter | 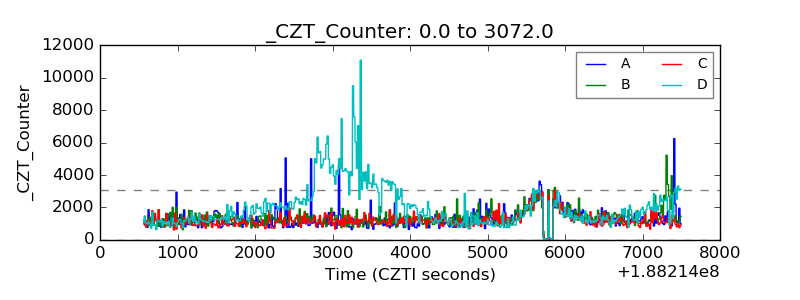 |
| +2.5 Volts monitor |  |
| +5 Volts monitor | 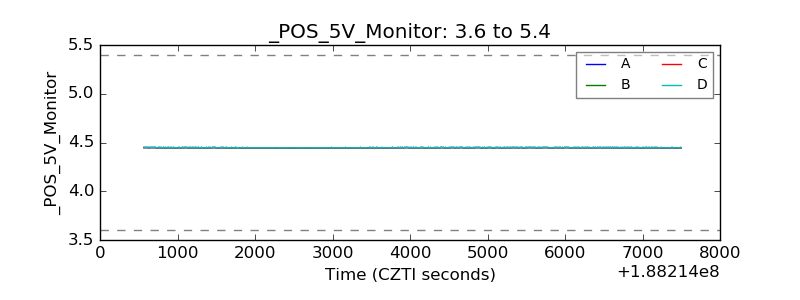 |
| _ROLL_ROT | 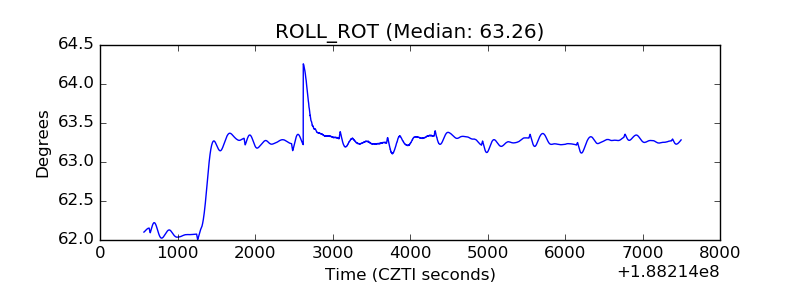 |
| _Roll_DEC | 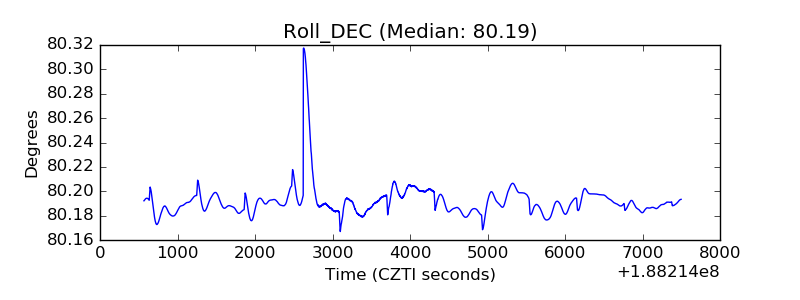 |
| _Roll_RA | 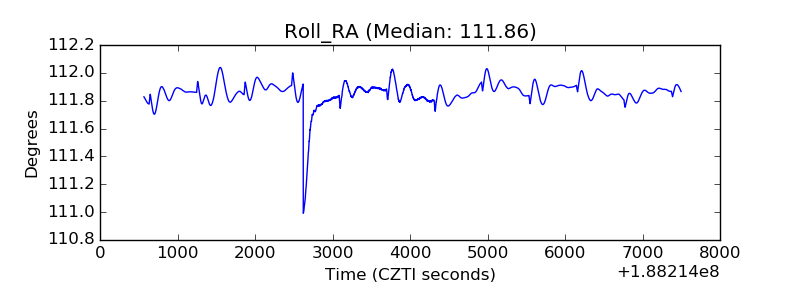 |
| Veto Counter | 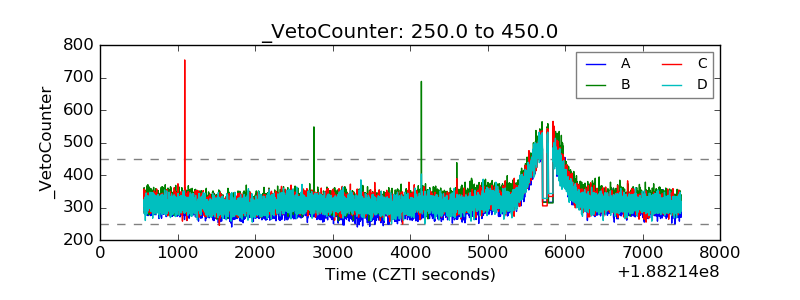 |