| Param | Original file | Final file |
|---|---|---|
| Filename | modeM0/AS1G04_007T02_9000000220_01220cztM0_level2.evt | modeM0/AS1G04_007T02_9000000220_01220cztM0_level2_quad_clean.evt |
| Size (bytes) | 1,425,965,760 | 106,752,960 |
| Size | 1.3 GB | 101.8 MB |
| Events in quadrant A | 9,306,812 | 717,129 |
| Events in quadrant B | 11,682,031 | 678,559 |
| Events in quadrant C | 8,980,288 | 687,295 |
| Events in quadrant D | 12,733,590 | 638,869 |
| Mode M0 | |||
|---|---|---|---|
| Quadrant | BADHDUFLAG | Total packets | Discarded packets |
| A | 0 | 32824 | 1 |
| B | 0 | 40008 | 0 |
| C | 0 | 31842 | 0 |
| D | 0 | 43129 | 0 |
| Mode SS | |||
|---|---|---|---|
| Quadrant | BADHDUFLAG | Total packets | Discarded packets |
| A | 0 | 146 | 0 |
| B | 0 | 146 | 0 |
| C | 0 | 146 | 0 |
| D | 0 | 146 | 0 |
| Quadrant | Total seconds | Saturated seconds | Saturation percentage |
|---|---|---|---|
| A | 7334 | 75 | 1.022634% |
| B | 7334 | 729 | 9.940005% |
| C | 7334 | 4 | 0.054540% |
| D | 7334 | 960 | 13.089719% |
Noise dominated data is calculated using 1-second bins in cleaned event files. If a bin has >2000 counts, and if more than 50% of those come from <1% of pixels, then it is considered to be noise-dominated and hence unusable.
| Quadrant | # 1 sec bins | Bins with >0 counts | Bins with >2000 counts | High rate bins dominated by noise | Noise dominated (total time) | Noise dominated (detector-on time) | Marked lightcurve |
|---|---|---|---|---|---|---|---|
| A | 7334 | 7334 | 445 | 445 | 6.07% | 6.07% | 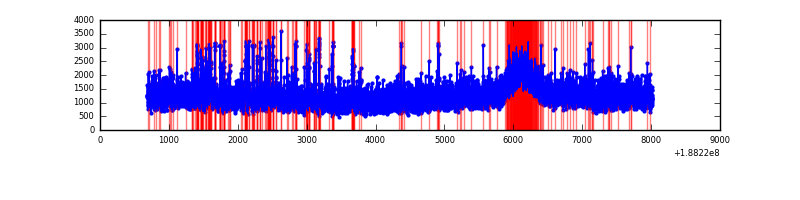 |
| B | 7334 | 7334 | 1552 | 1552 | 21.16% | 21.16% | 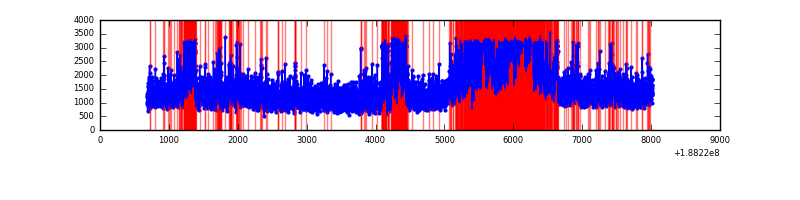 |
| C | 7334 | 7334 | 221 | 221 | 3.01% | 3.01% | 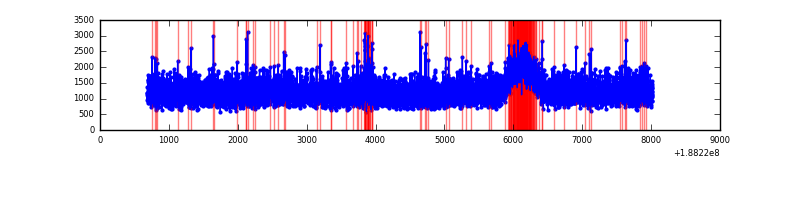 |
| D | 7334 | 7334 | 2408 | 2408 | 32.83% | 32.83% | 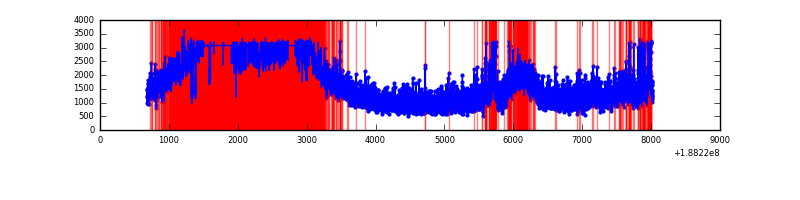 |
Top three noisy pixels from each quadrant. If the there are fewer than three noisy pixels in the level2.evt file, extra rows are filled as -1
| Pixel properties | Quadrant properties | ||||||
|---|---|---|---|---|---|---|---|
| Quadrant | DetID | PixID | Counts | Sigma | Mean | Median | Sigma |
| A | 15 | 127 | 453594 | 811.96 | 2297 | 2306 | 555.8 |
| A | 0 | 51 | 17886 | 28.03 | 2297 | 2306 | 555.8 |
| A | 0 | 5 | 11257 | 16.1 | 2297 | 2306 | 555.8 |
| B | 2 | 32 | 2519353 | 4680.27 | 2275 | 2283 | 537.8 |
| B | 6 | 53 | 191623 | 352.06 | 2275 | 2283 | 537.8 |
| B | 15 | 22 | 115520 | 210.55 | 2275 | 2283 | 537.8 |
| C | 15 | 241 | 387491 | 643.09 | 2148 | 2221 | 599.1 |
| C | 8 | 208 | 91970 | 149.81 | 2148 | 2221 | 599.1 |
| C | 3 | 79 | 64138 | 103.35 | 2148 | 2221 | 599.1 |
| D | 1 | 239 | 4010066 | 6307.33 | 2036 | 2110 | 635.4 |
| D | 13 | 70 | 515135 | 807.35 | 2036 | 2110 | 635.4 |
| D | 1 | 83 | 272497 | 425.51 | 2036 | 2110 | 635.4 |
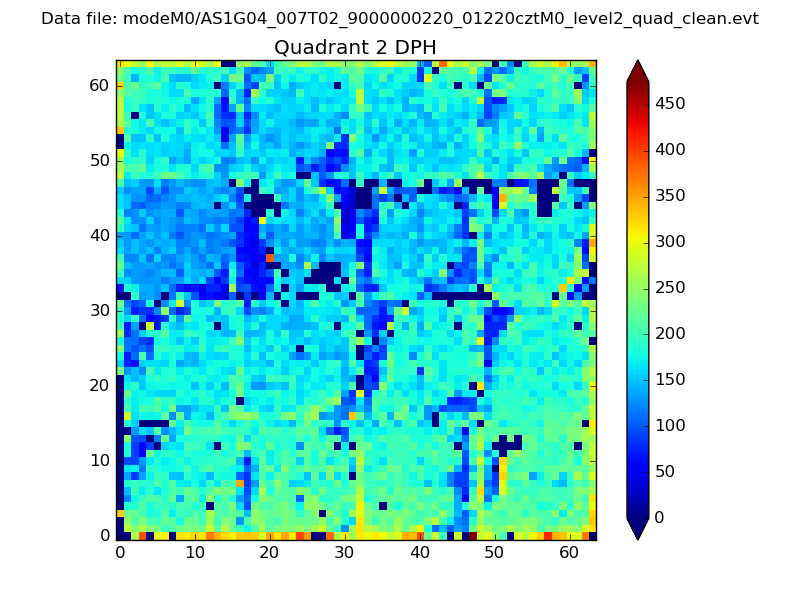
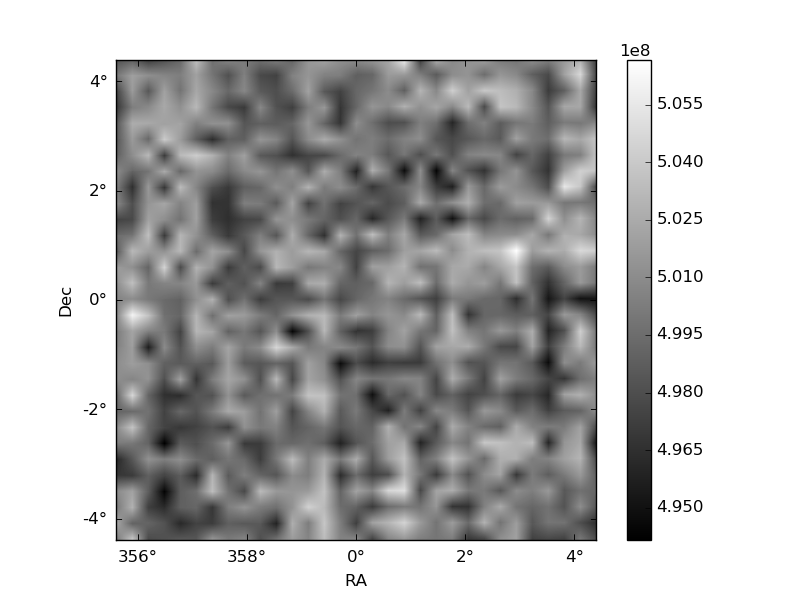
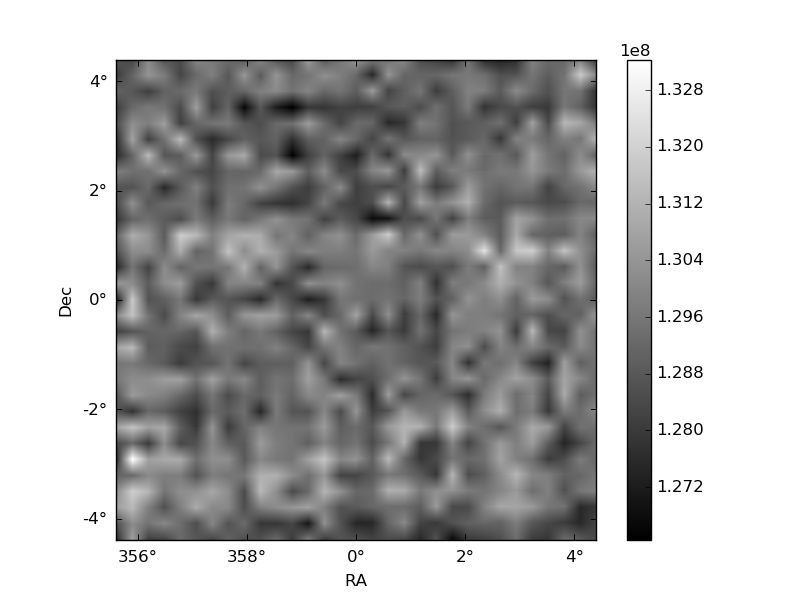
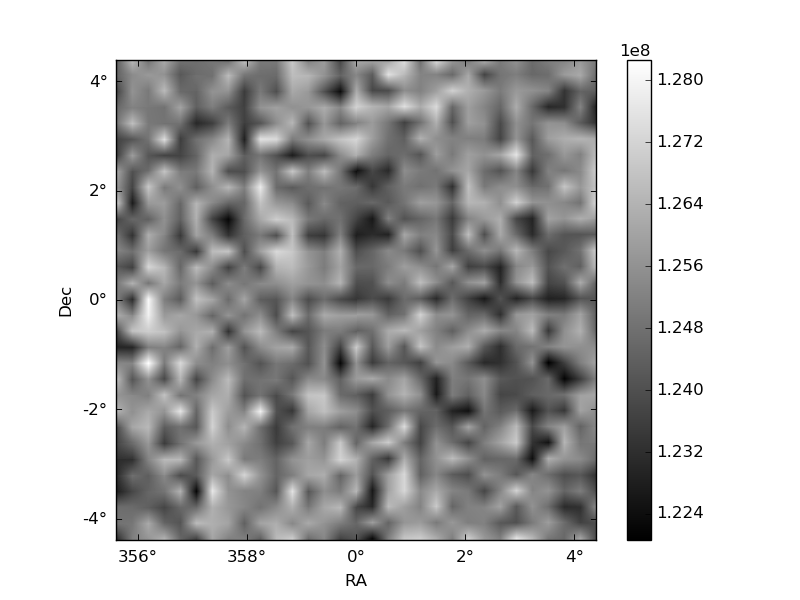
Histogram calculated using DETX and DETY for each event in the final _common_clean file
| Quadrant A | 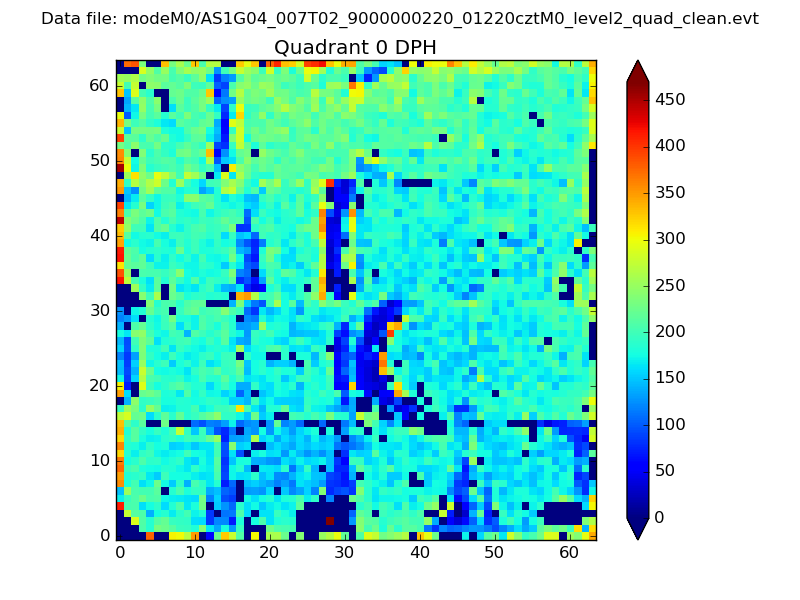 |
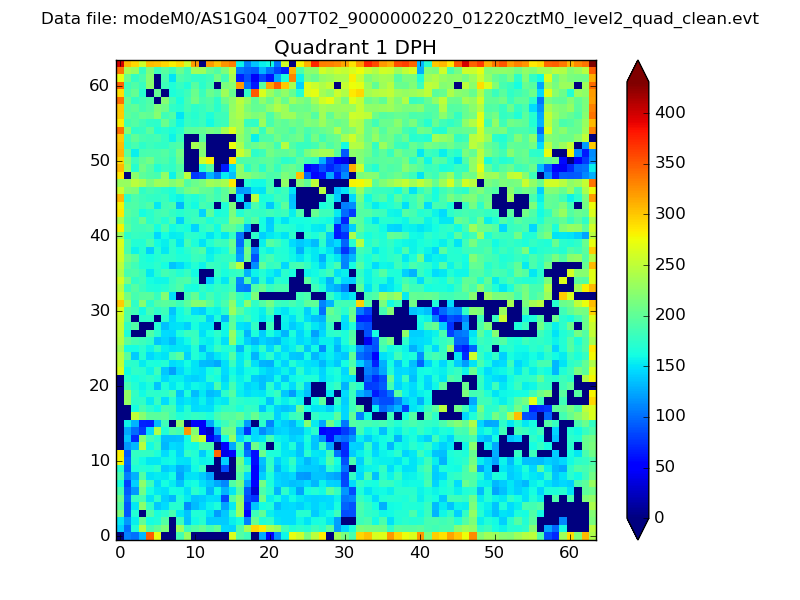 |
Quadrant B |
|---|---|---|---|
| Quadrant D | 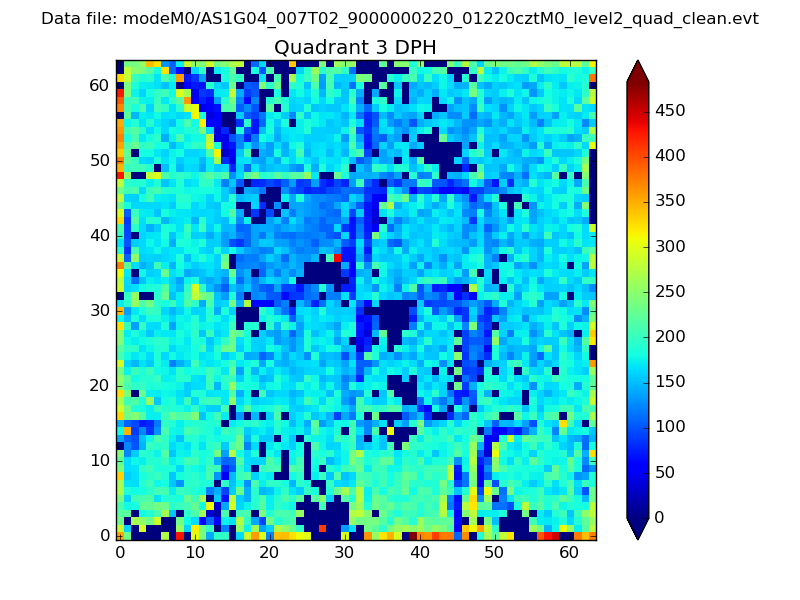 |
 |
Quadrant C |
| Plot type | Count rate plots | Images |
|---|---|---|
| Comparison with Poisson distribution Blue bars denote a histogram of data divided into 1 sec bins. Red curve is a Poisson curve with rate = median count rate of data. |
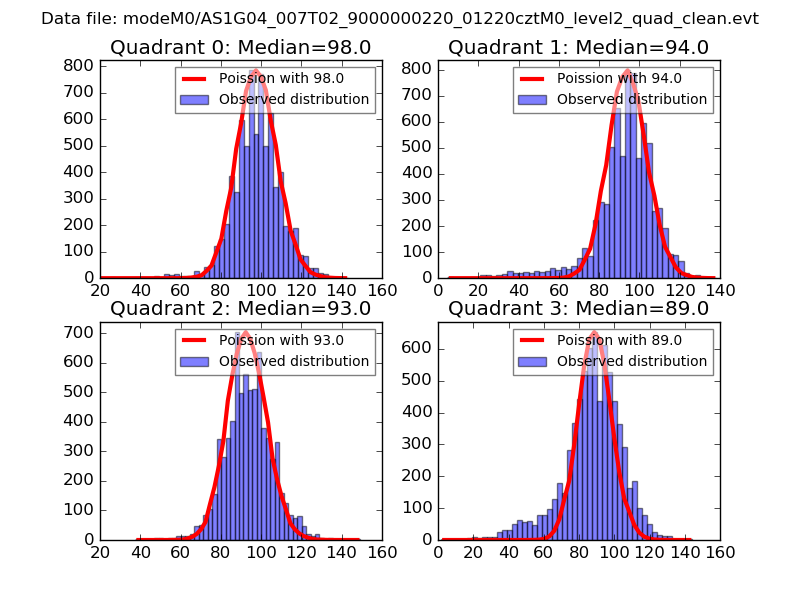 |
 |
| Quadrant-wise count rates Data is divided into 100 sec bins |
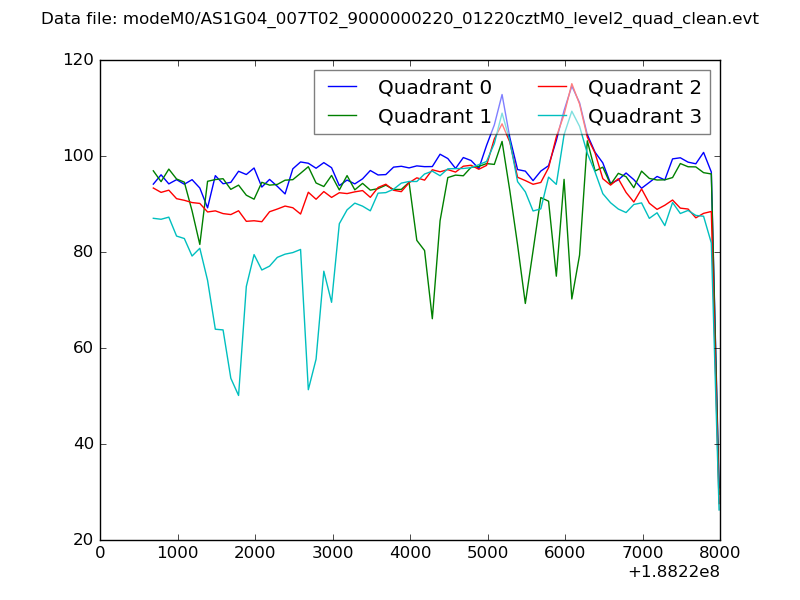 |
|
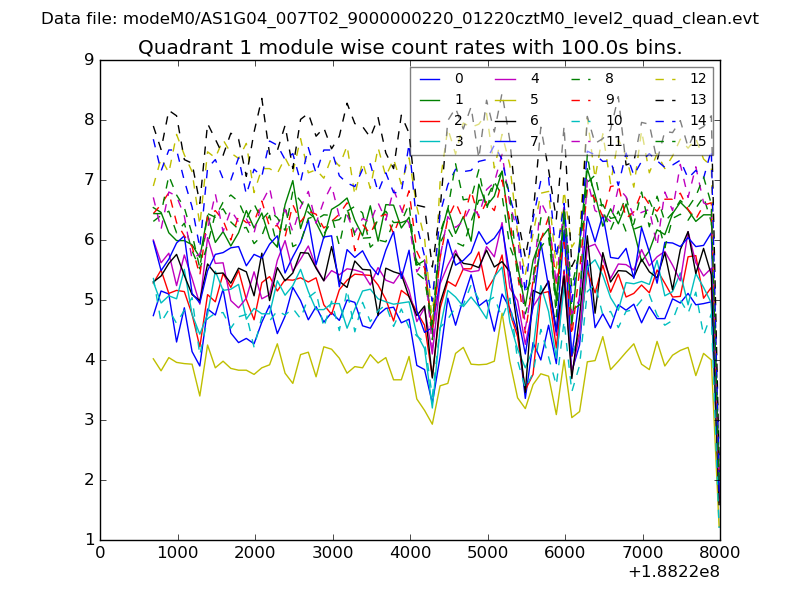
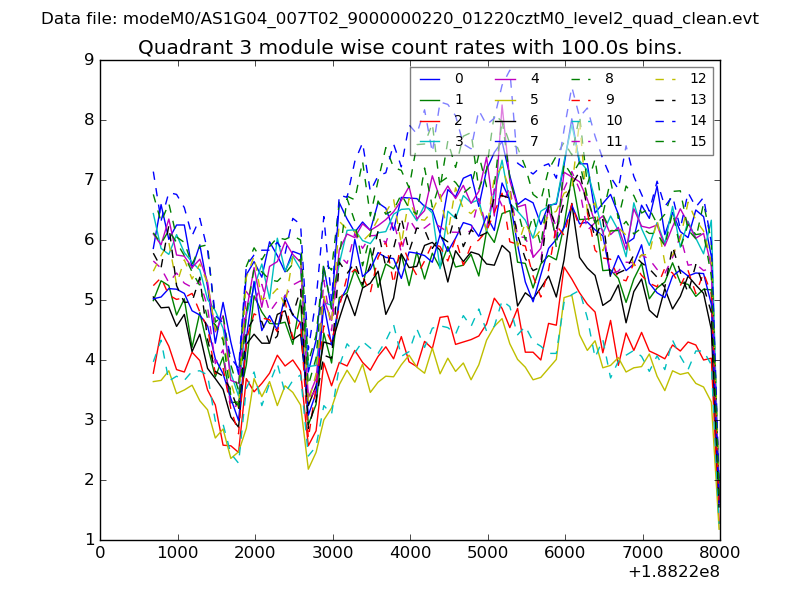
| Module-wise count rates for Quadrant A Data is divided into 100 sec bins |
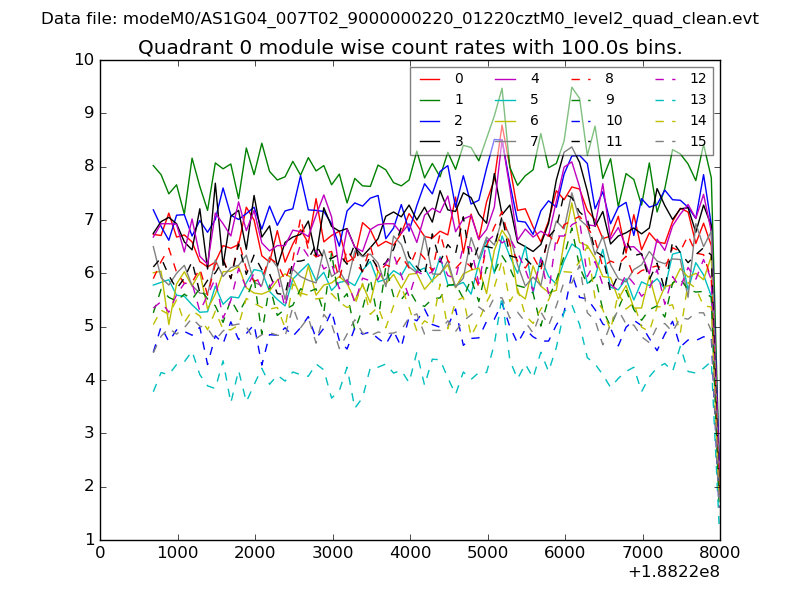 |
 |
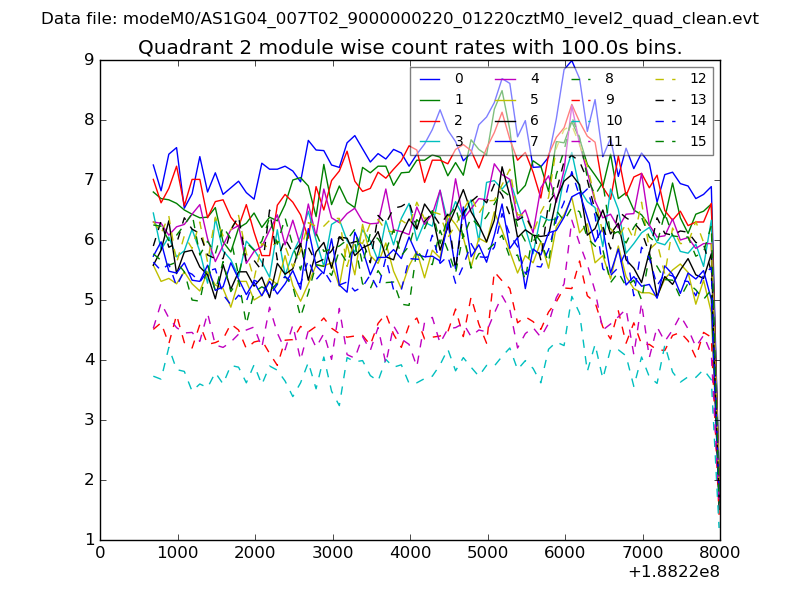
| Module-wise count rates for Quadrant B Data is divided into 100 sec bins |
 |
 |
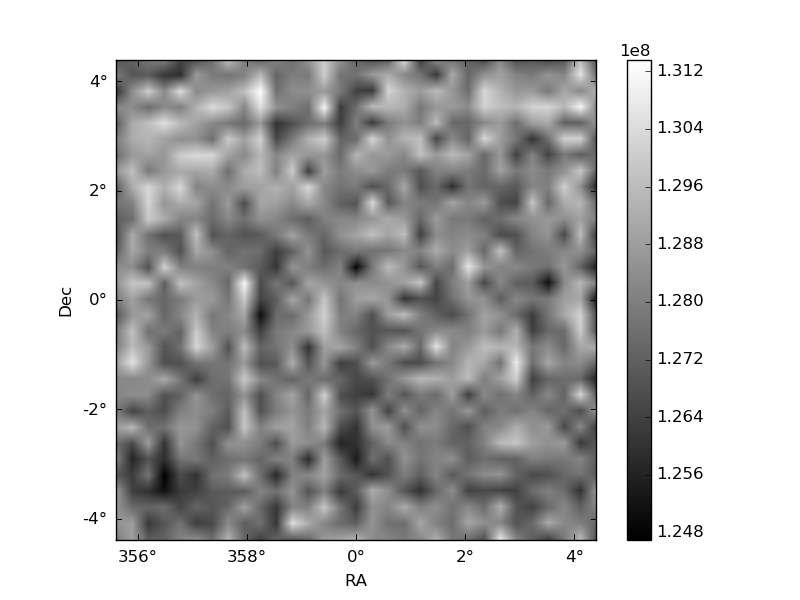
| Module-wise count rates for Quadrant C Data is divided into 100 sec bins |
 |
 |
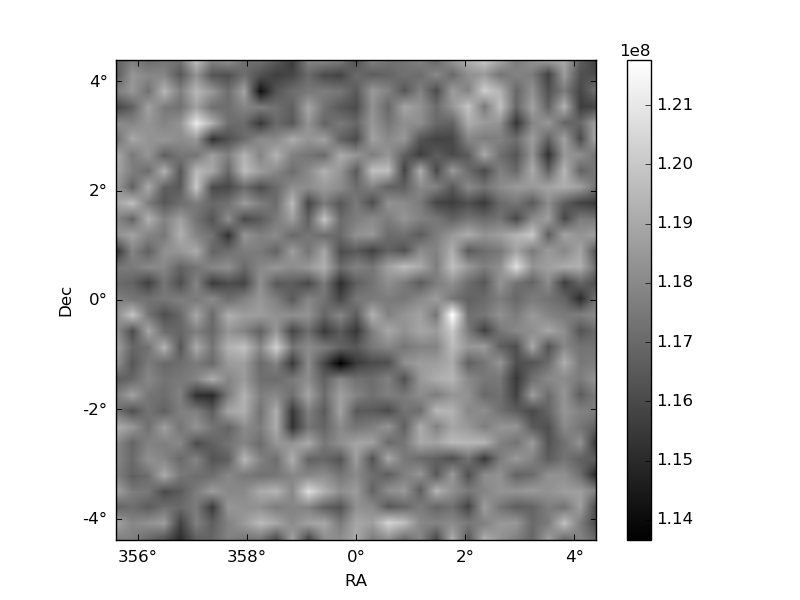
| Module-wise count rates for Quadrant D Data is divided into 100 sec bins |
 |
 |
| Parameter | Plot |
|---|---|
| CZT HV Monitor | 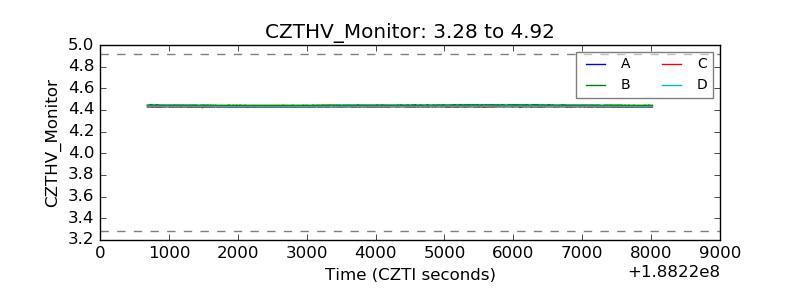 |
| D_VDD | 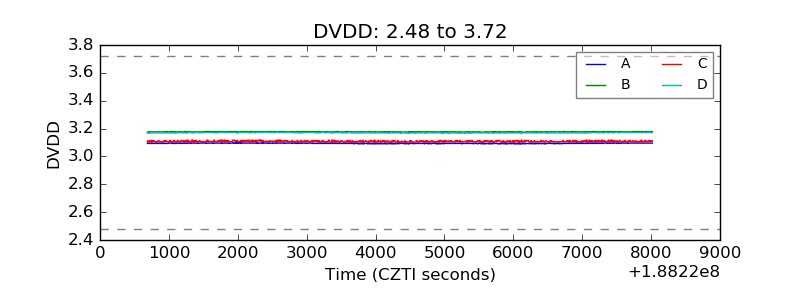 |
| Temperature 1 | 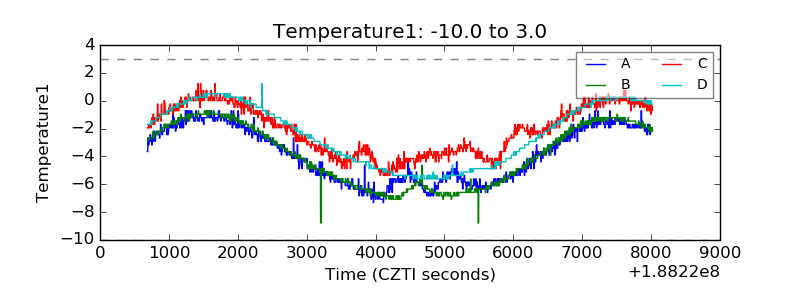 |
| Veto HV Monitor | 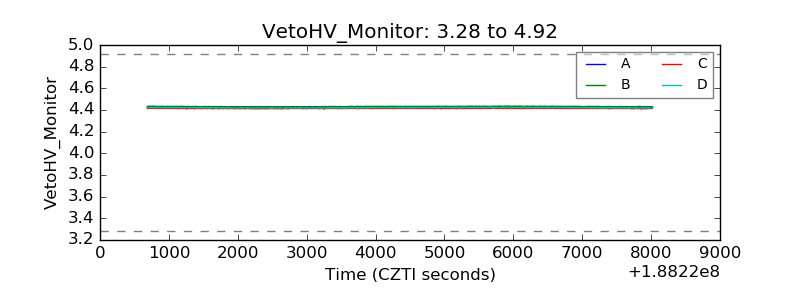 |
| Veto LLD | 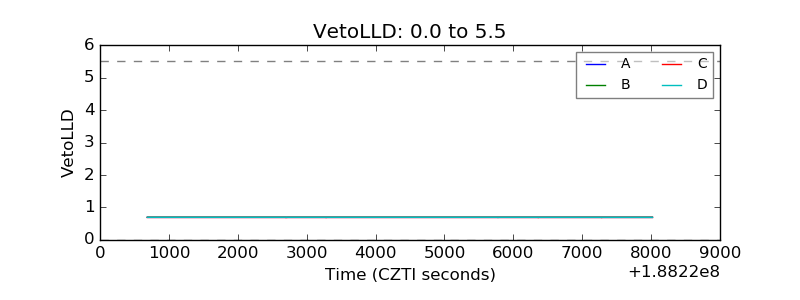 |
| Alpha Counter | 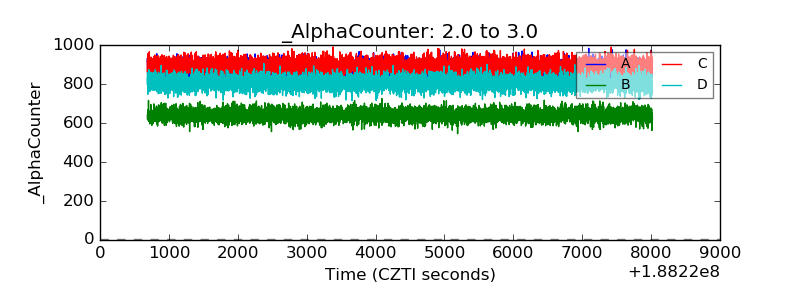 |
| _CPM_Rate | 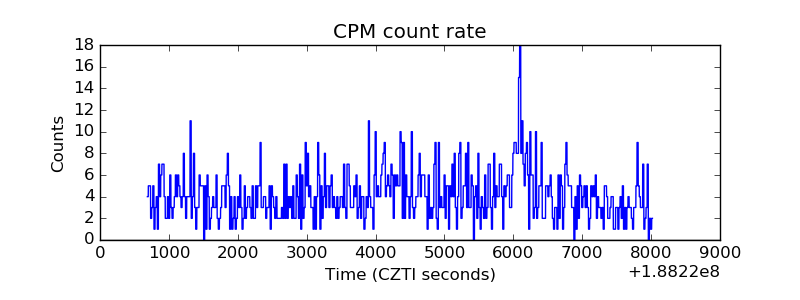 |
| CZT Counter | 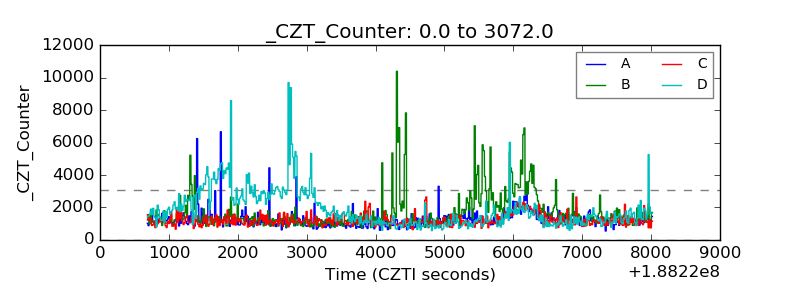 |
| +2.5 Volts monitor |  |
| +5 Volts monitor |  |
| _ROLL_ROT | 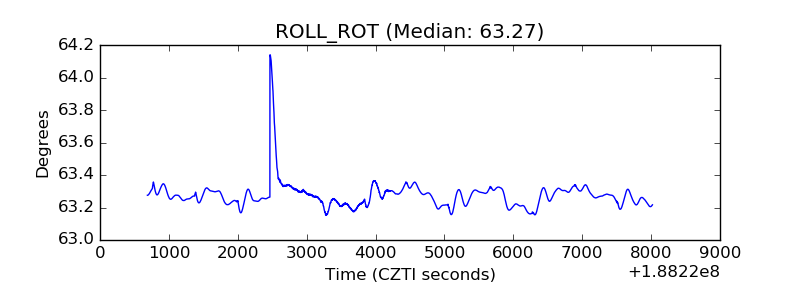 |
| _Roll_DEC | 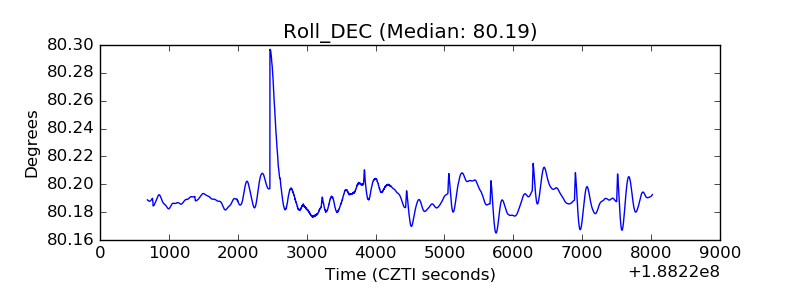 |
| _Roll_RA | 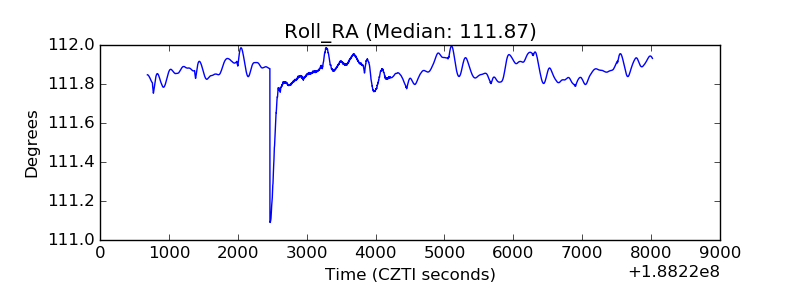 |
| Veto Counter | 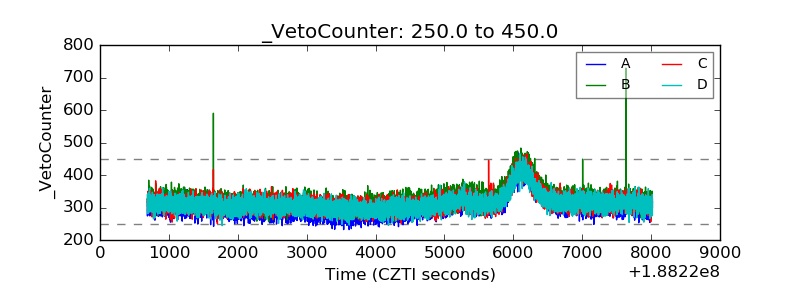 |