| Param | Original file | Final file |
|---|---|---|
| Filename | modeM0/AS1G04_007T02_9000000220_01221cztM0_level2.evt | modeM0/AS1G04_007T02_9000000220_01221cztM0_level2_quad_clean.evt |
| Size (bytes) | 1,202,757,120 | 101,926,080 |
| Size | 1.1 GB | 97.2 MB |
| Events in quadrant A | 8,402,986 | 676,876 |
| Events in quadrant B | 9,588,334 | 660,899 |
| Events in quadrant C | 8,499,038 | 643,725 |
| Events in quadrant D | 9,483,885 | 629,034 |
| Mode M9 | |||
|---|---|---|---|
| Quadrant | BADHDUFLAG | Total packets | Discarded packets |
| A | 0 | 1 | 0 |
| B | 0 | 1 | 0 |
| C | 0 | 1 | 0 |
| D | 0 | 1 | 0 |
| Mode M0 | |||
|---|---|---|---|
| Quadrant | BADHDUFLAG | Total packets | Discarded packets |
| A | 0 | 29827 | 2 |
| B | 0 | 33371 | 1 |
| C | 0 | 30083 | 1 |
| D | 0 | 33059 | 1 |
| Mode SS | |||
|---|---|---|---|
| Quadrant | BADHDUFLAG | Total packets | Discarded packets |
| A | 0 | 138 | 0 |
| B | 0 | 138 | 0 |
| C | 0 | 138 | 0 |
| D | 0 | 138 | 0 |
| Quadrant | Total seconds | Saturated seconds | Saturation percentage |
|---|---|---|---|
| A | 6836 | 13 | 0.190170% |
| B | 6836 | 147 | 2.150380% |
| C | 6836 | 16 | 0.234055% |
| D | 6836 | 170 | 2.486834% |
Noise dominated data is calculated using 1-second bins in cleaned event files. If a bin has >2000 counts, and if more than 50% of those come from <1% of pixels, then it is considered to be noise-dominated and hence unusable.
| Quadrant | # 1 sec bins | Bins with >0 counts | Bins with >2000 counts | High rate bins dominated by noise | Noise dominated (total time) | Noise dominated (detector-on time) | Marked lightcurve |
|---|---|---|---|---|---|---|---|
| A | 6891 | 6837 | 343 | 343 | 4.98% | 5.02% | 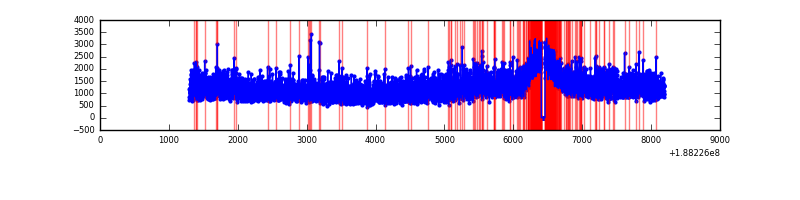 |
| B | 6891 | 6836 | 758 | 758 | 11.00% | 11.09% | 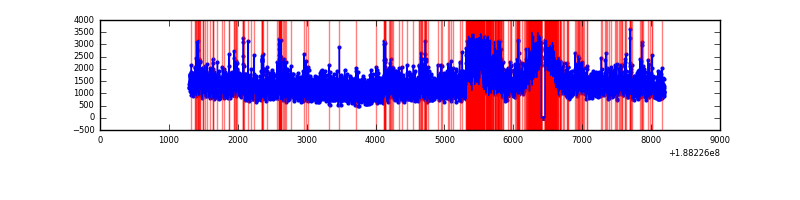 |
| C | 6891 | 6837 | 330 | 330 | 4.79% | 4.83% | 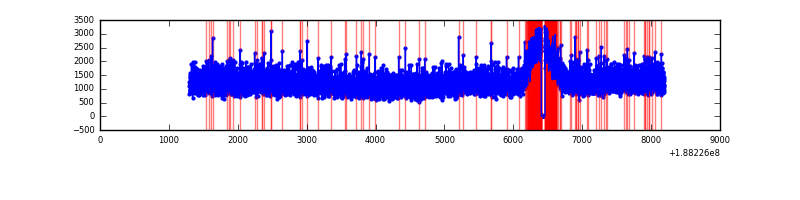 |
| D | 6891 | 6837 | 995 | 995 | 14.44% | 14.55% | 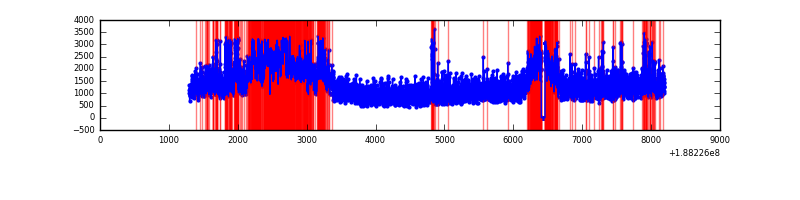 |
Top three noisy pixels from each quadrant. If the there are fewer than three noisy pixels in the level2.evt file, extra rows are filled as -1
| Pixel properties | Quadrant properties | ||||||
|---|---|---|---|---|---|---|---|
| Quadrant | DetID | PixID | Counts | Sigma | Mean | Median | Sigma |
| A | 15 | 127 | 52580 | 96.96 | 2161 | 2168 | 519.9 |
| A | 0 | 51 | 25032 | 43.98 | 2161 | 2168 | 519.9 |
| A | 11 | 79 | 10969 | 16.93 | 2161 | 2168 | 519.9 |
| B | 2 | 32 | 814578 | 1545.95 | 2220 | 2222 | 525.5 |
| B | 6 | 53 | 153214 | 287.34 | 2220 | 2222 | 525.5 |
| B | 12 | 52 | 50175 | 91.26 | 2220 | 2222 | 525.5 |
| C | 15 | 241 | 358824 | 618.98 | 2059 | 2132 | 576.3 |
| C | 3 | 79 | 52809 | 87.94 | 2059 | 2132 | 576.3 |
| C | 3 | 111 | 37617 | 61.58 | 2059 | 2132 | 576.3 |
| D | 1 | 239 | 1412914 | 2281.72 | 1989 | 2059 | 618.3 |
| D | 13 | 70 | 396739 | 638.3 | 1989 | 2059 | 618.3 |
| D | 13 | 169 | 93606 | 148.06 | 1989 | 2059 | 618.3 |
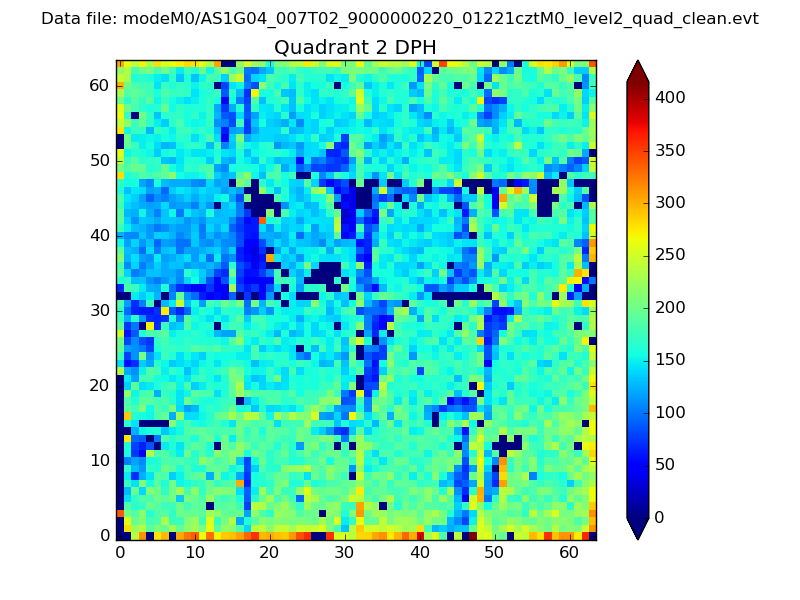
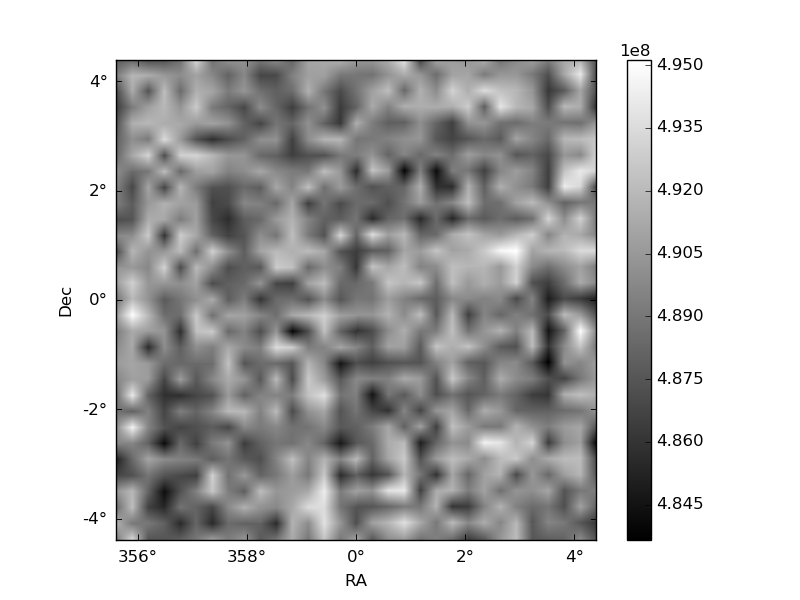
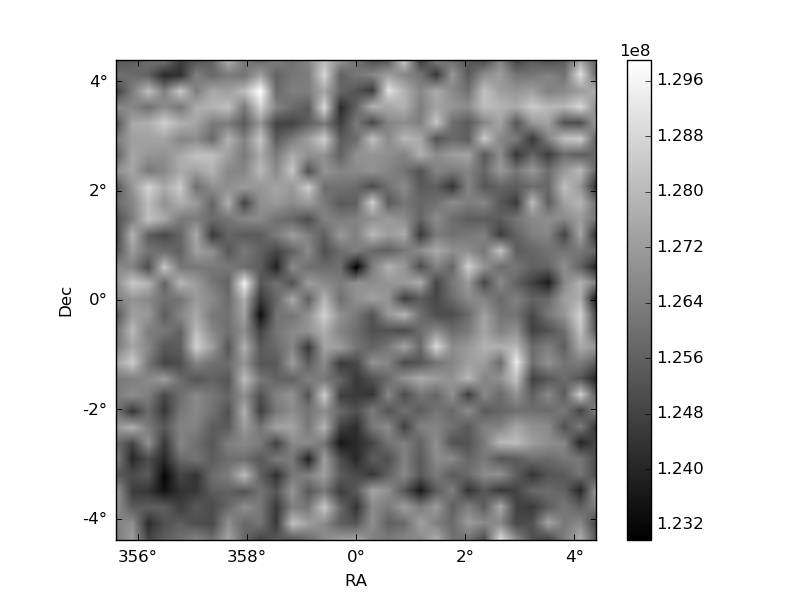
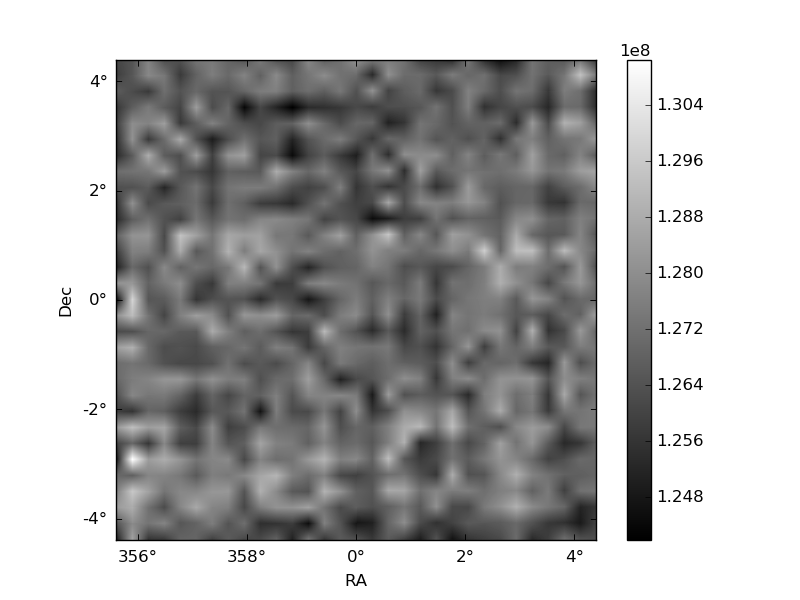
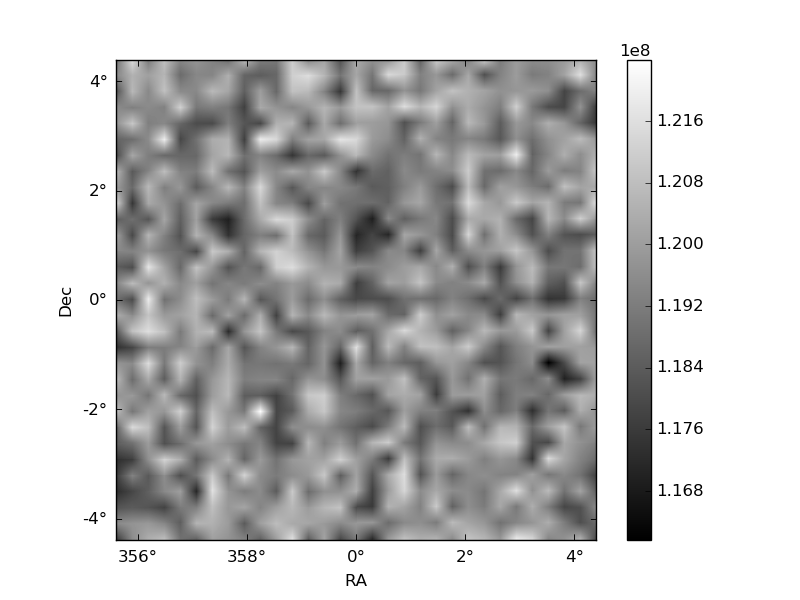
Histogram calculated using DETX and DETY for each event in the final _common_clean file
| Quadrant A | 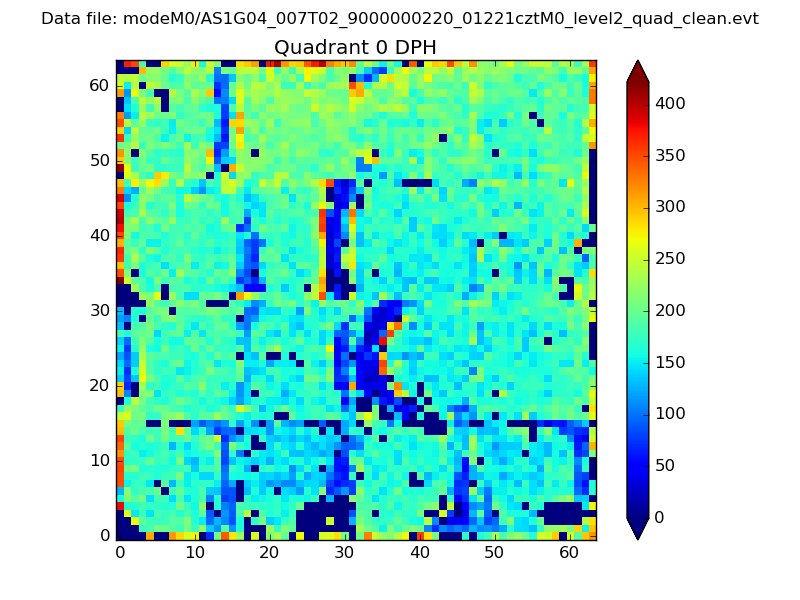 |
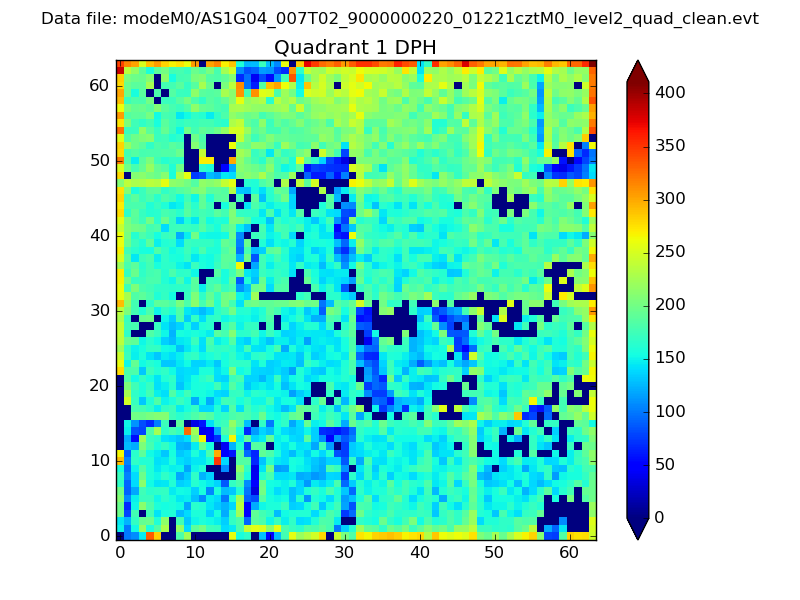 |
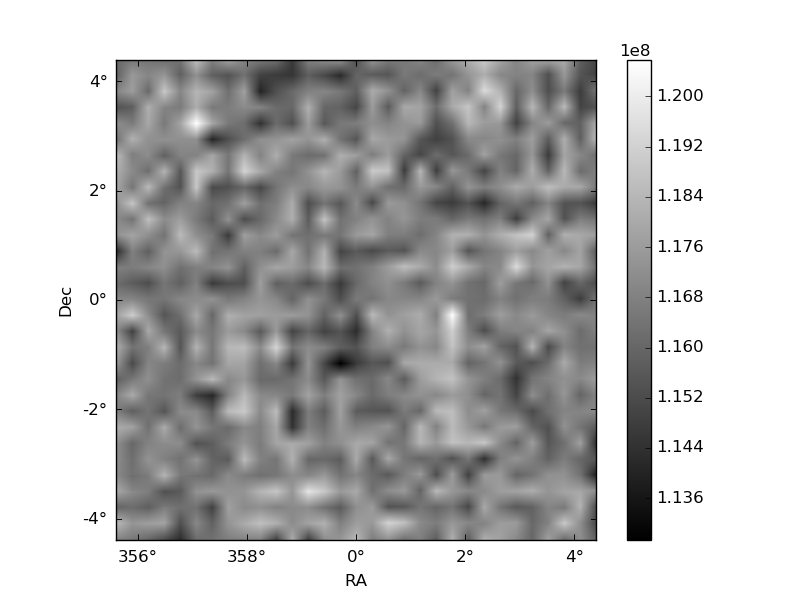
Quadrant B |
|---|---|---|---|
| Quadrant D | 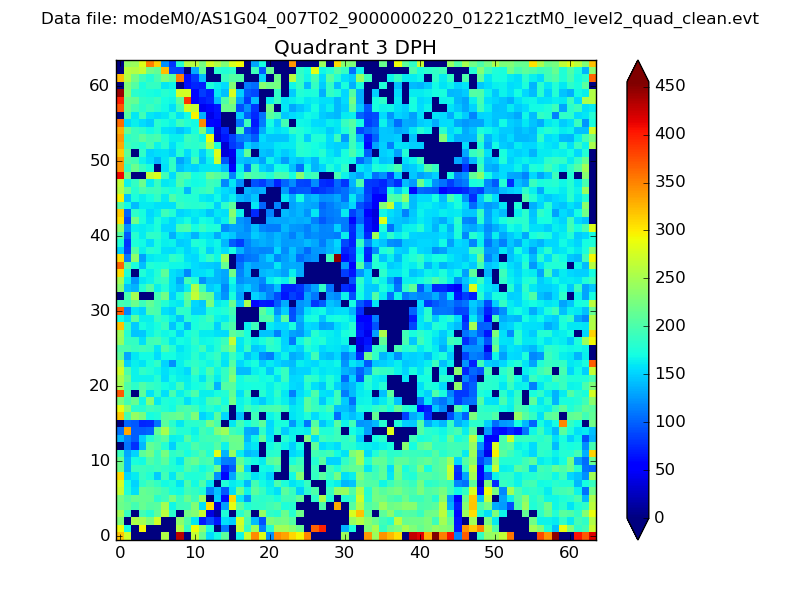 |
 |
Quadrant C |
| Plot type | Count rate plots | Images |
|---|---|---|
| Comparison with Poisson distribution Blue bars denote a histogram of data divided into 1 sec bins. Red curve is a Poisson curve with rate = median count rate of data. |
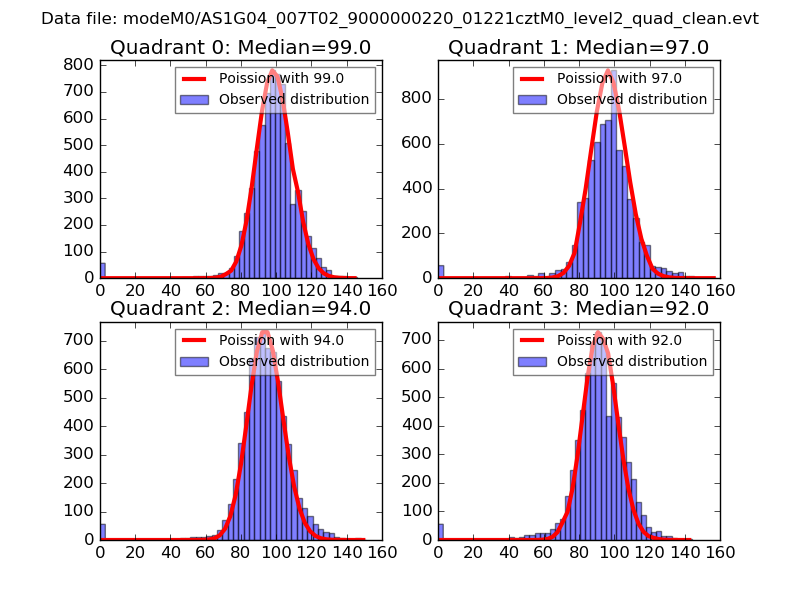 |
 |
| Quadrant-wise count rates Data is divided into 100 sec bins |
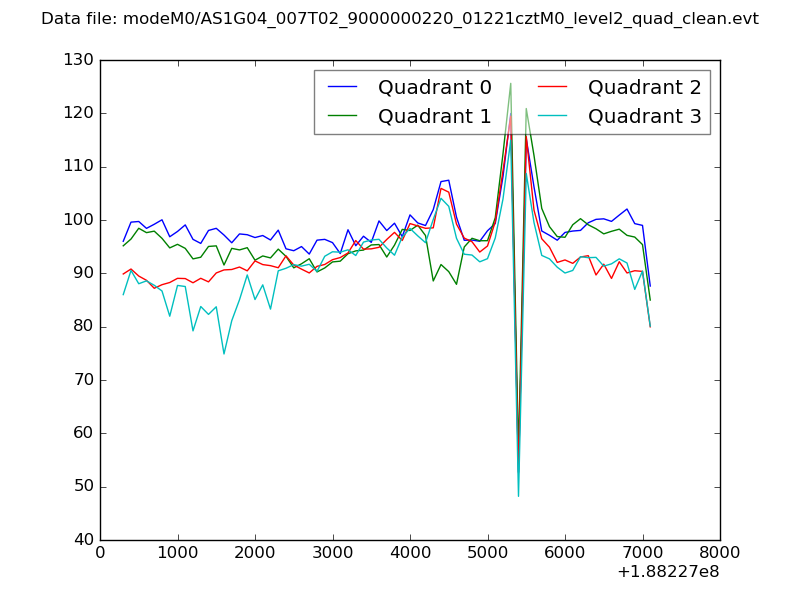 |
|
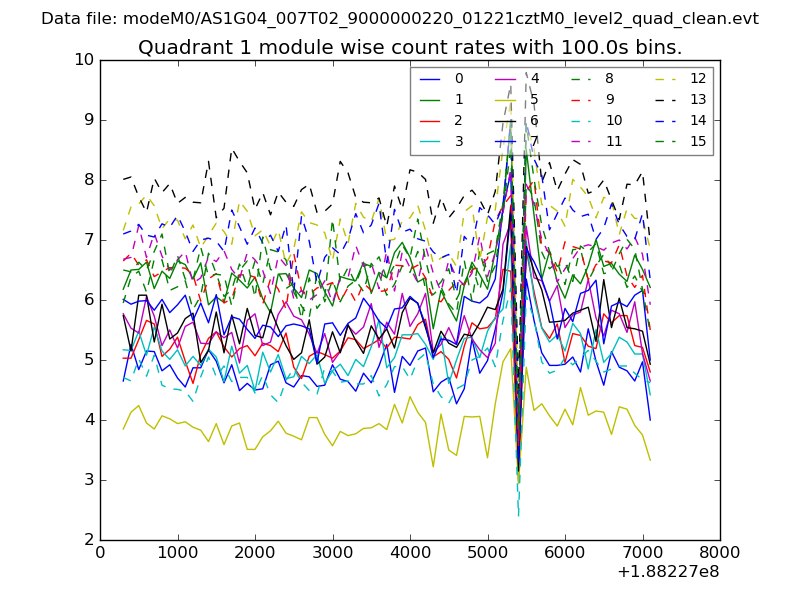
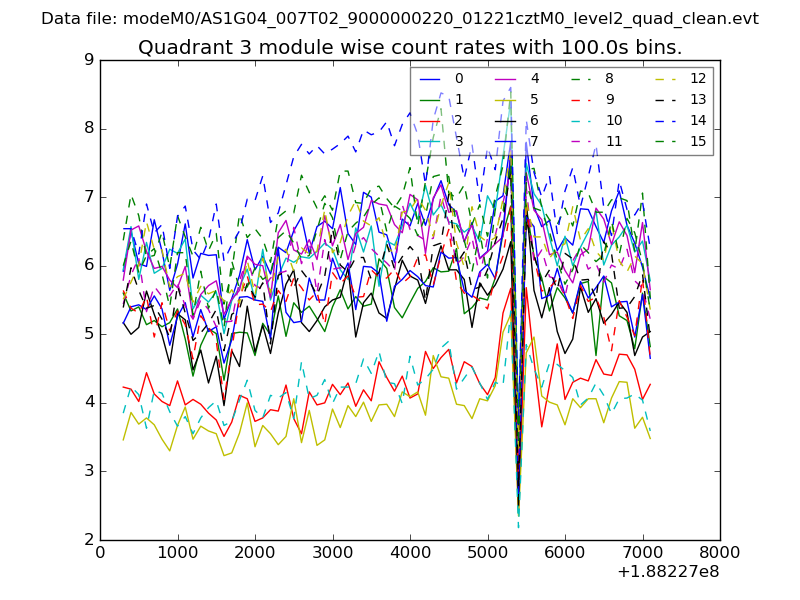
| Module-wise count rates for Quadrant A Data is divided into 100 sec bins |
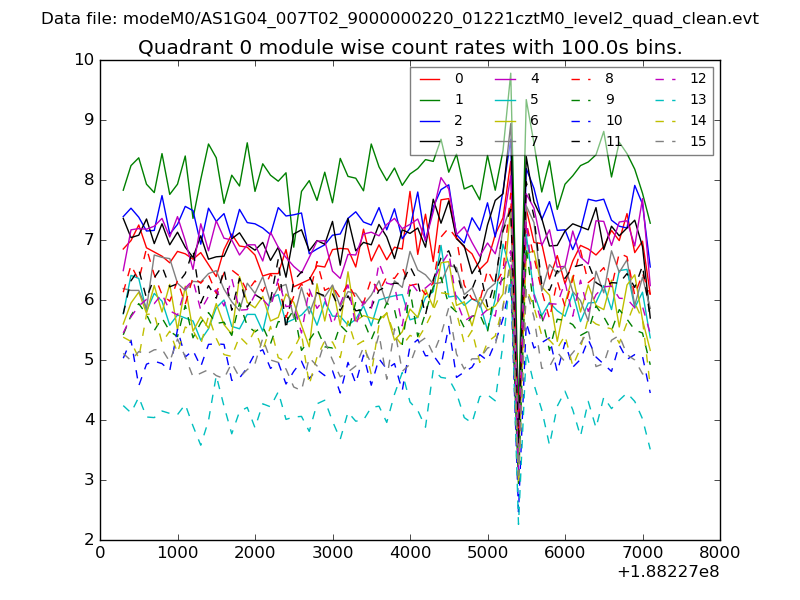 |
 |
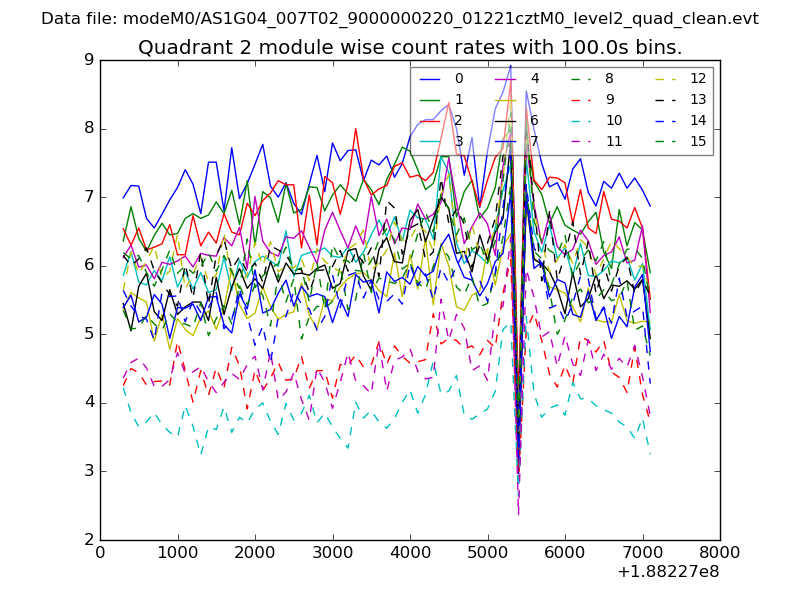
| Module-wise count rates for Quadrant B Data is divided into 100 sec bins |
 |
 |
| Module-wise count rates for Quadrant C Data is divided into 100 sec bins |
 |
 |
| Module-wise count rates for Quadrant D Data is divided into 100 sec bins |
 |
 |
| Parameter | Plot |
|---|---|
| CZT HV Monitor | 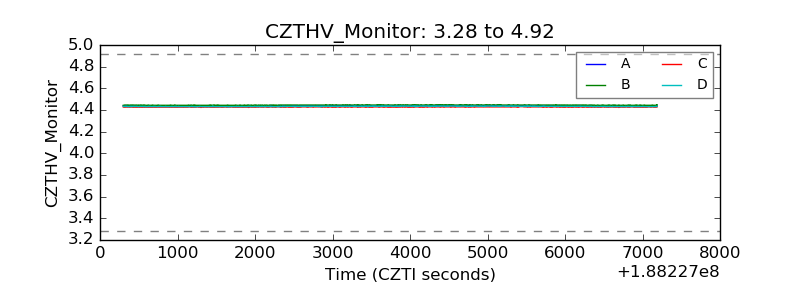 |
| D_VDD | 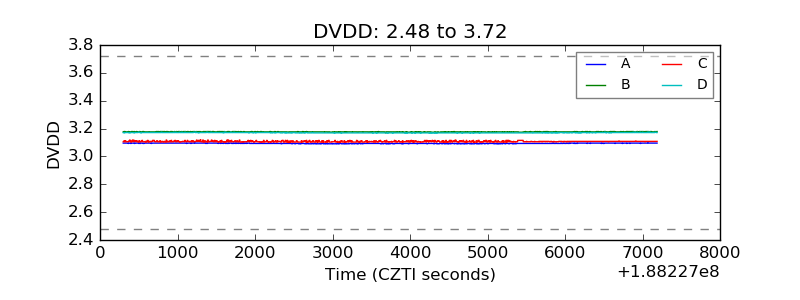 |
| Temperature 1 | 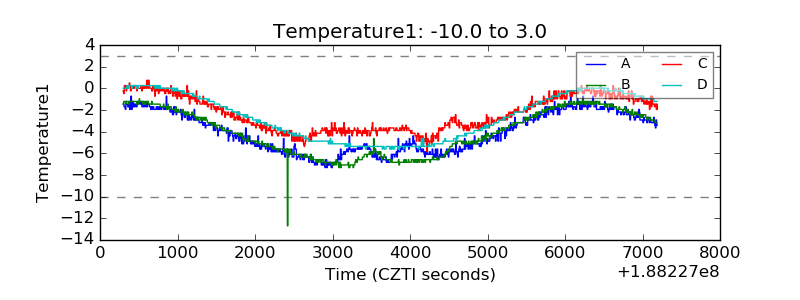 |
| Veto HV Monitor | 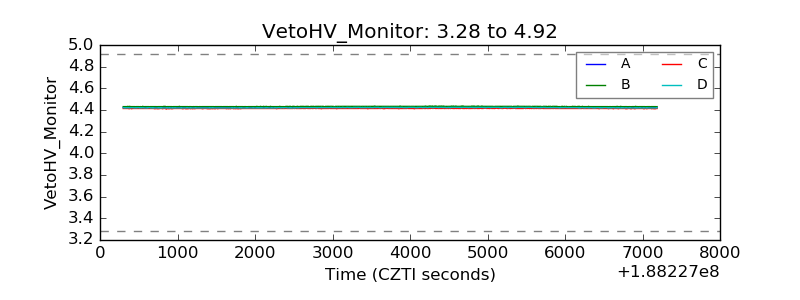 |
| Veto LLD | 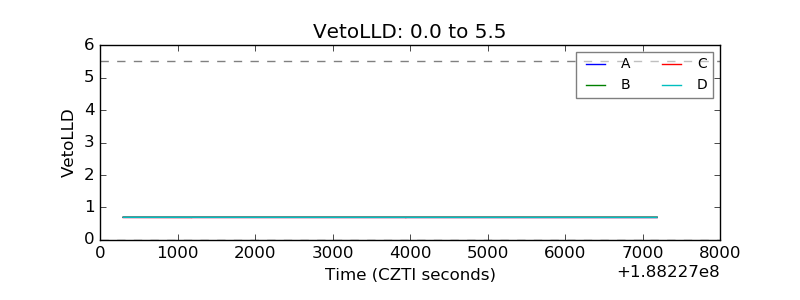 |
| Alpha Counter | 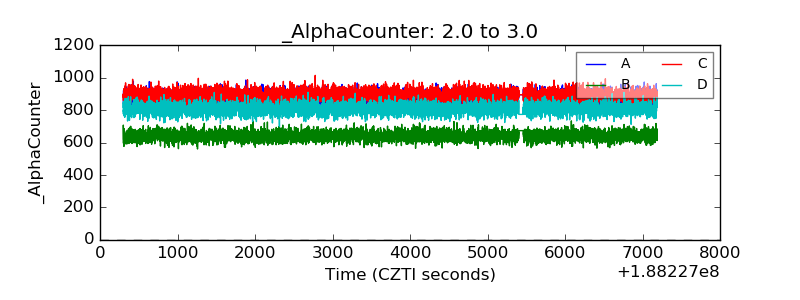 |
| _CPM_Rate | 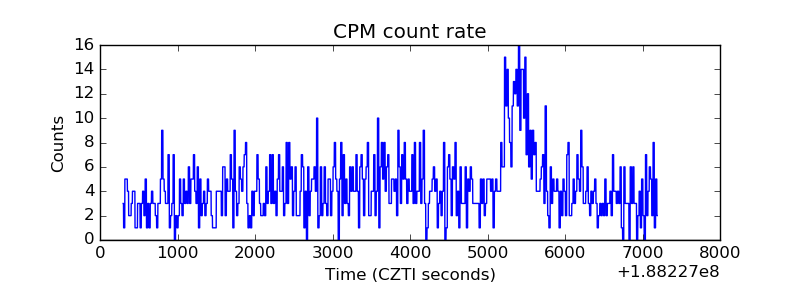 |
| CZT Counter | 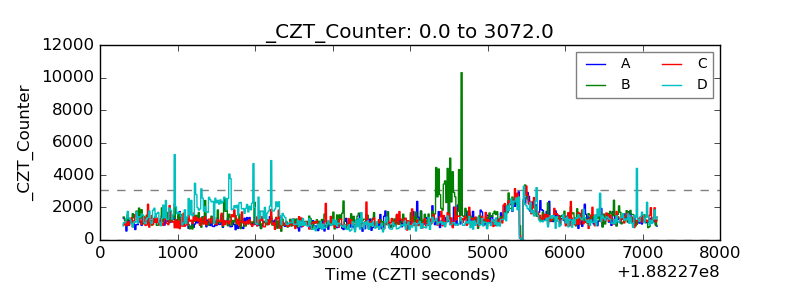 |
| +2.5 Volts monitor |  |
| +5 Volts monitor | 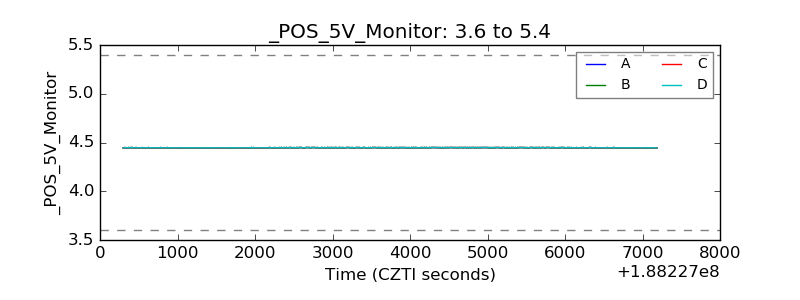 |
| _ROLL_ROT | 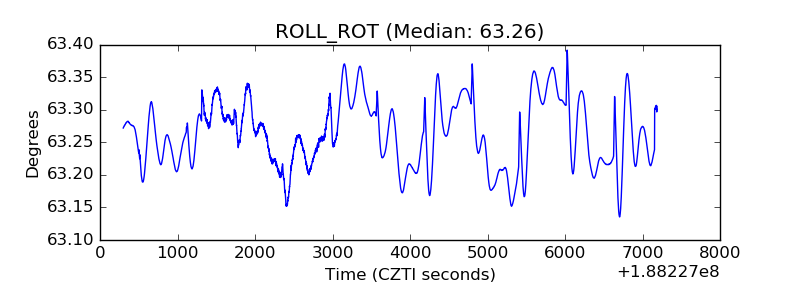 |
| _Roll_DEC | 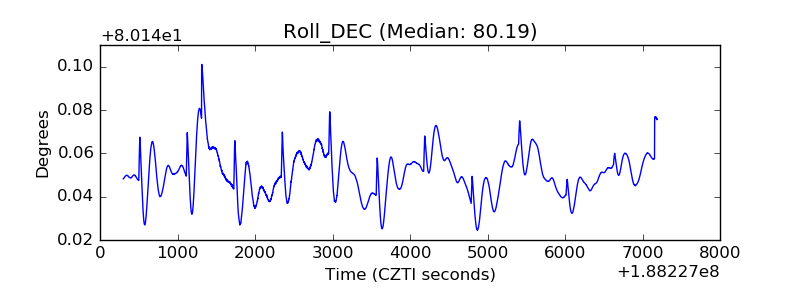 |
| _Roll_RA | 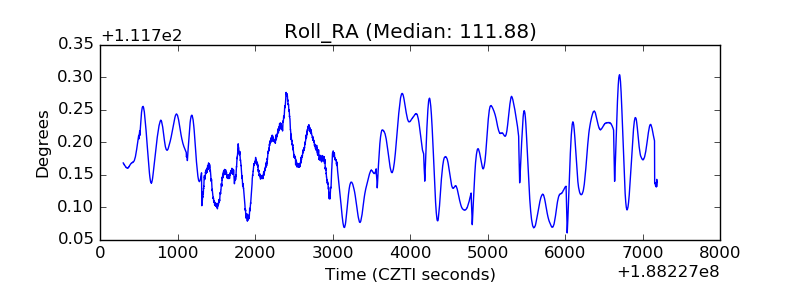 |
| Veto Counter | 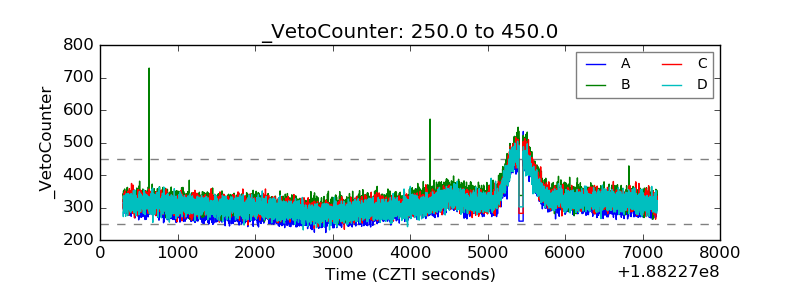 |