| Param | Original file | Final file |
|---|---|---|
| Filename | modeM0/AS1G04_007T02_9000000220_01223cztM0_level2.evt | modeM0/AS1G04_007T02_9000000220_01223cztM0_level2_quad_clean.evt |
| Size (bytes) | 1,149,603,840 | 104,002,560 |
| Size | 1.1 GB | 99.2 MB |
| Events in quadrant A | 8,689,096 | 683,826 |
| Events in quadrant B | 9,186,631 | 674,071 |
| Events in quadrant C | 8,461,364 | 653,963 |
| Events in quadrant D | 8,015,879 | 650,849 |
| Mode M9 | |||
|---|---|---|---|
| Quadrant | BADHDUFLAG | Total packets | Discarded packets |
| A | 0 | 5 | 0 |
| B | 0 | 5 | 0 |
| C | 0 | 5 | 0 |
| D | 0 | 5 | 0 |
| Mode M0 | |||
|---|---|---|---|
| Quadrant | BADHDUFLAG | Total packets | Discarded packets |
| A | 0 | 30791 | 1 |
| B | 0 | 32218 | 1 |
| C | 0 | 30121 | 1 |
| D | 0 | 28777 | 1 |
| Mode SS | |||
|---|---|---|---|
| Quadrant | BADHDUFLAG | Total packets | Discarded packets |
| A | 0 | 142 | 0 |
| B | 0 | 142 | 0 |
| C | 0 | 142 | 0 |
| D | 0 | 142 | 0 |
| Quadrant | Total seconds | Saturated seconds | Saturation percentage |
|---|---|---|---|
| A | 6993 | 27 | 0.386100% |
| B | 6993 | 26 | 0.371800% |
| C | 6993 | 5 | 0.071500% |
| D | 6993 | 16 | 0.228800% |
Noise dominated data is calculated using 1-second bins in cleaned event files. If a bin has >2000 counts, and if more than 50% of those come from <1% of pixels, then it is considered to be noise-dominated and hence unusable.
| Quadrant | # 1 sec bins | Bins with >0 counts | Bins with >2000 counts | High rate bins dominated by noise | Noise dominated (total time) | Noise dominated (detector-on time) | Marked lightcurve |
|---|---|---|---|---|---|---|---|
| A | 7448 | 6994 | 280 | 280 | 3.76% | 4.00% | 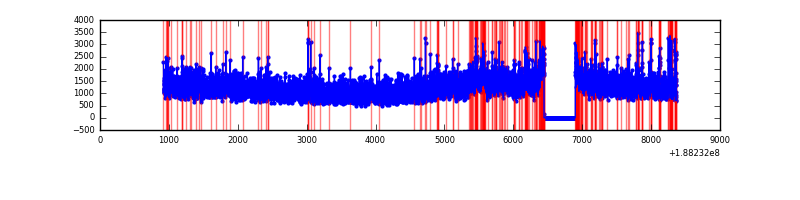 |
| B | 7448 | 6994 | 332 | 332 | 4.46% | 4.75% |  |
| C | 7448 | 6994 | 161 | 161 | 2.16% | 2.30% | 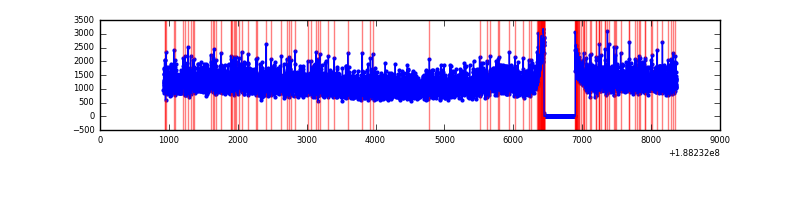 |
| D | 7448 | 6994 | 171 | 171 | 2.30% | 2.44% |  |
Top three noisy pixels from each quadrant. If the there are fewer than three noisy pixels in the level2.evt file, extra rows are filled as -1
| Pixel properties | Quadrant properties | ||||||
|---|---|---|---|---|---|---|---|
| Quadrant | DetID | PixID | Counts | Sigma | Mean | Median | Sigma |
| A | 15 | 127 | 163476 | 308.45 | 2166 | 2170 | 523.0 |
| A | 12 | 243 | 136933 | 257.69 | 2166 | 2170 | 523.0 |
| A | 0 | 51 | 29643 | 52.53 | 2166 | 2170 | 523.0 |
| B | 2 | 32 | 428100 | 812.98 | 2230 | 2239 | 523.8 |
| B | 5 | 191 | 61155 | 112.47 | 2230 | 2239 | 523.8 |
| B | 6 | 53 | 53766 | 98.37 | 2230 | 2239 | 523.8 |
| C | 15 | 241 | 366647 | 637.47 | 2052 | 2123 | 571.8 |
| C | 3 | 79 | 42855 | 71.23 | 2052 | 2123 | 571.8 |
| C | 3 | 111 | 32824 | 53.69 | 2052 | 2123 | 571.8 |
| D | 1 | 239 | 275168 | 436.81 | 2007 | 2078 | 625.2 |
| D | 13 | 169 | 74480 | 115.81 | 2007 | 2078 | 625.2 |
| D | 13 | 70 | 64408 | 99.7 | 2007 | 2078 | 625.2 |
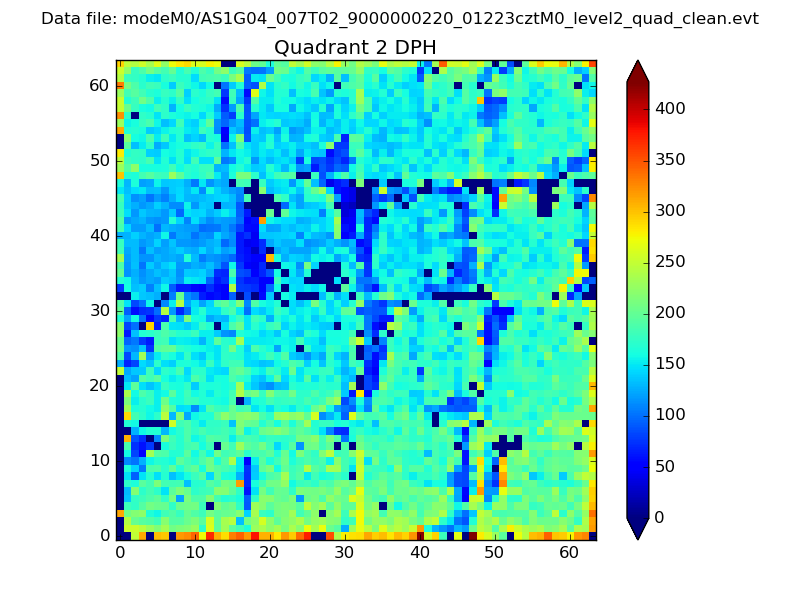
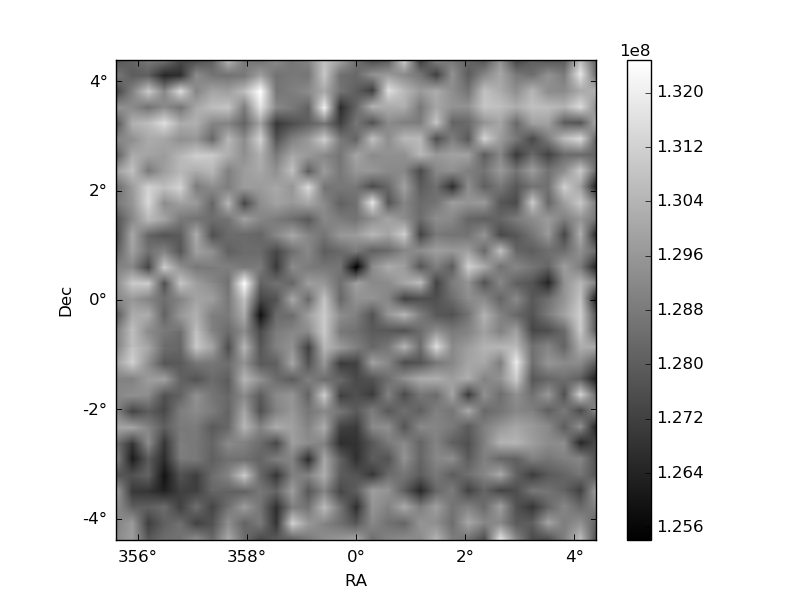
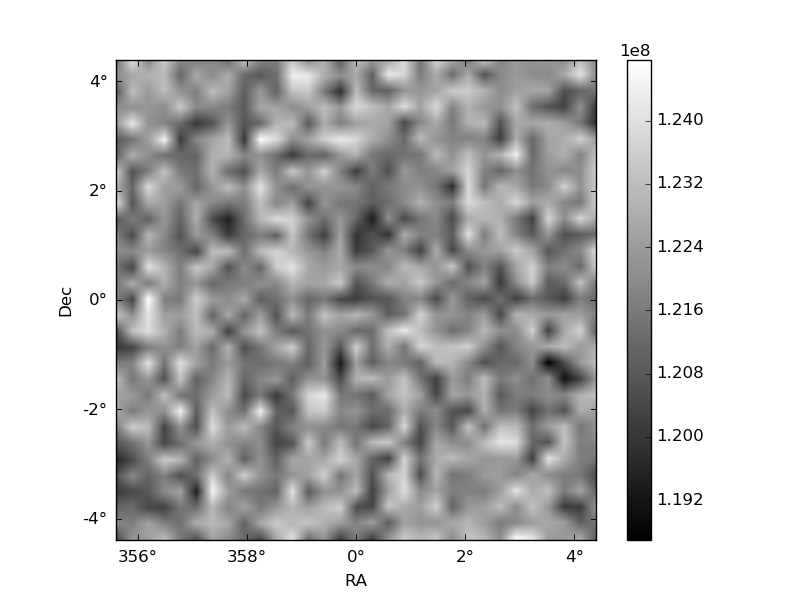
Histogram calculated using DETX and DETY for each event in the final _common_clean file
| Quadrant A | 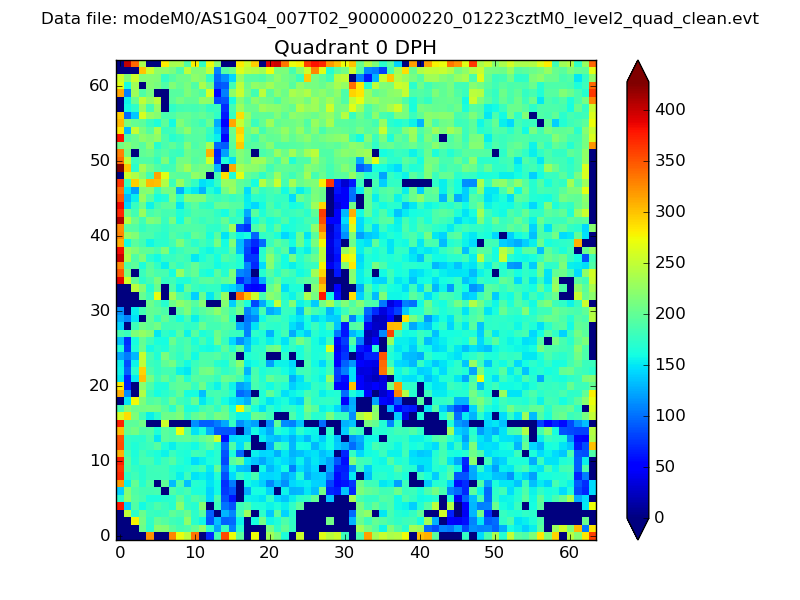 |
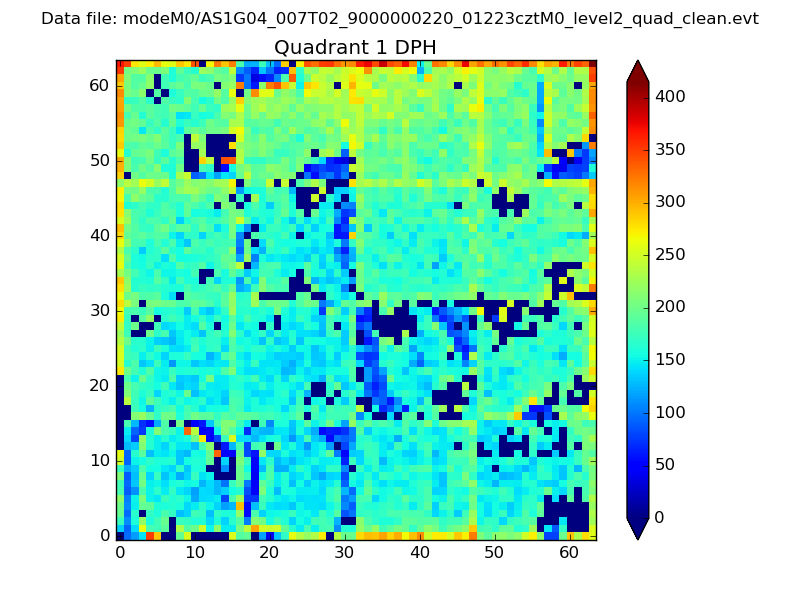 |
Quadrant B |
|---|---|---|---|
| Quadrant D | 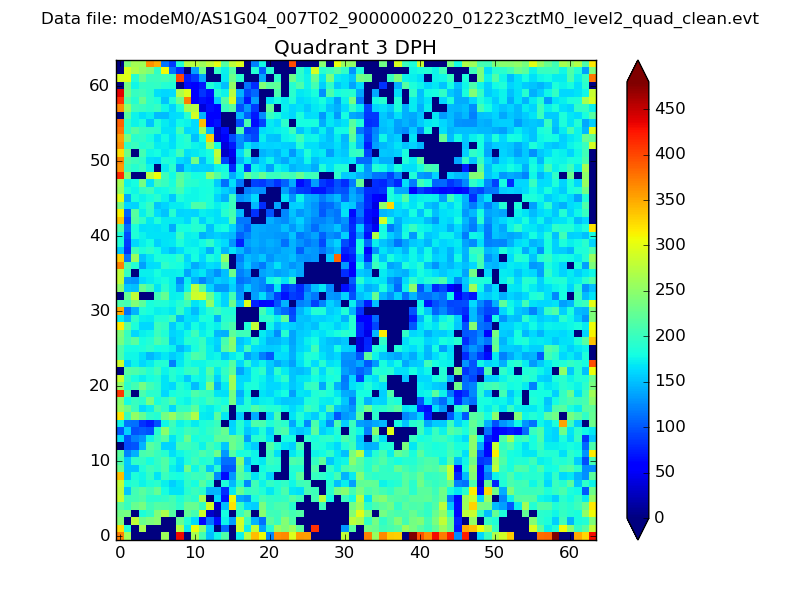 |
 |
Quadrant C |
| Plot type | Count rate plots | Images |
|---|---|---|
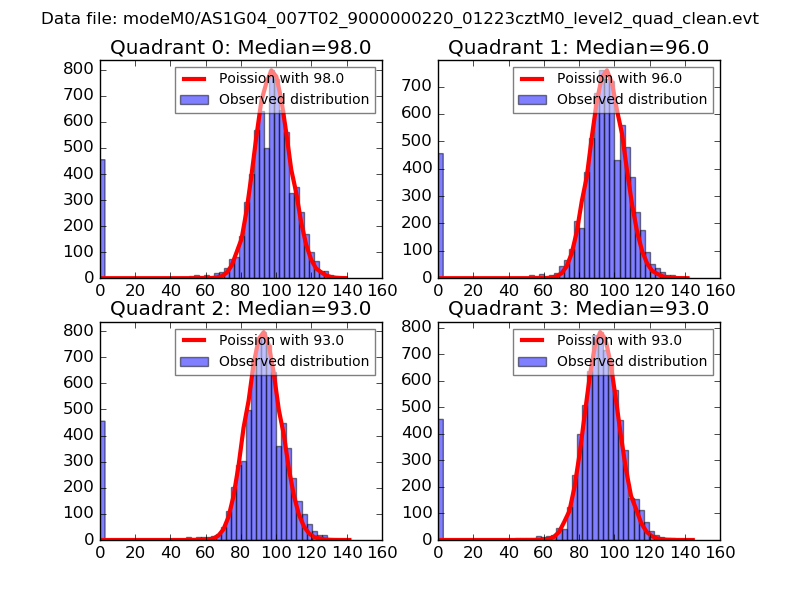
| Comparison with Poisson distribution Blue bars denote a histogram of data divided into 1 sec bins. Red curve is a Poisson curve with rate = median count rate of data. |
 |
 |
| Quadrant-wise count rates Data is divided into 100 sec bins |
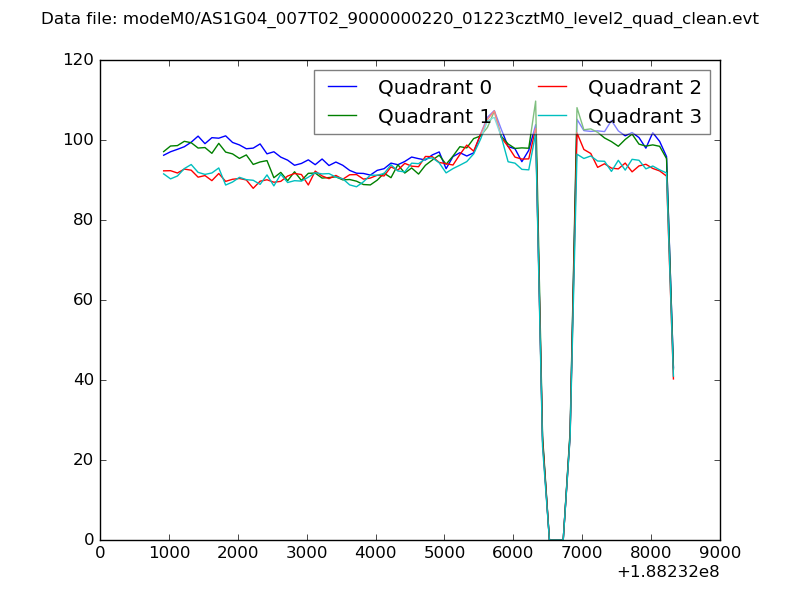 |
|
| Module-wise count rates for Quadrant A Data is divided into 100 sec bins |
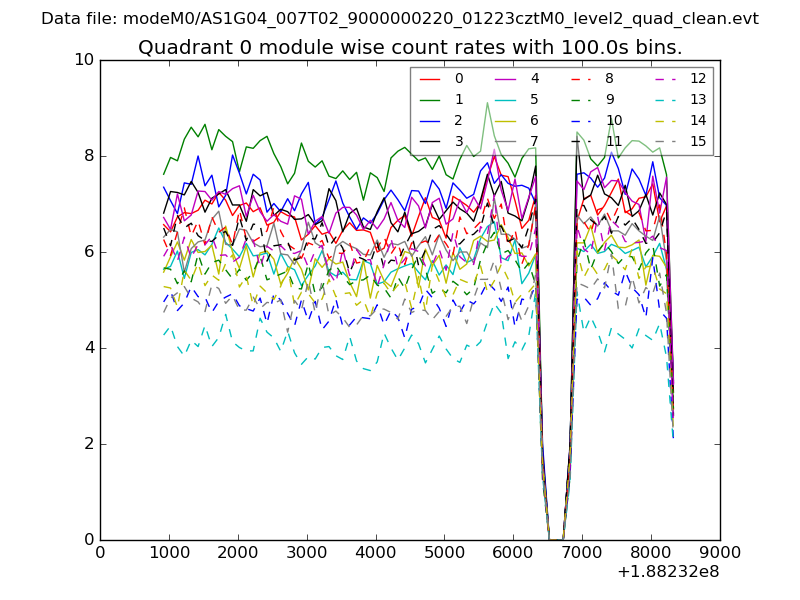 |
 |
| Module-wise count rates for Quadrant B Data is divided into 100 sec bins |
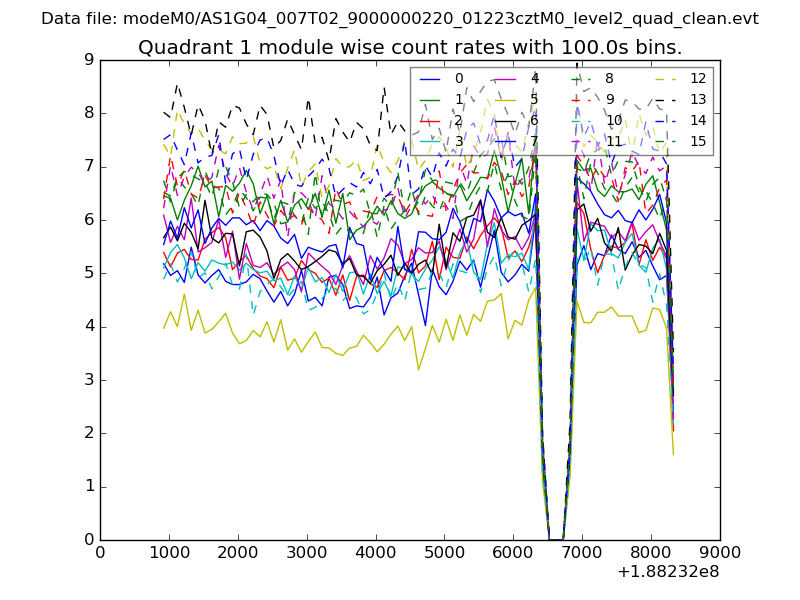 |
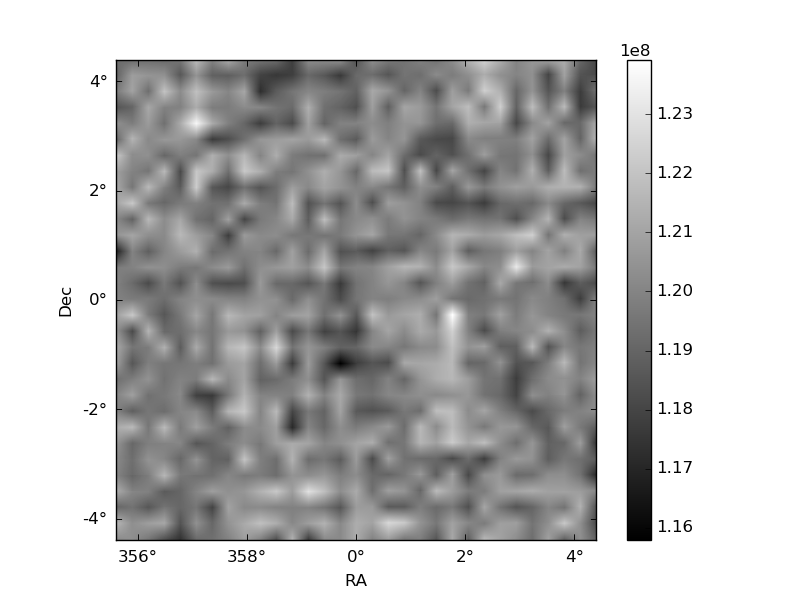 |
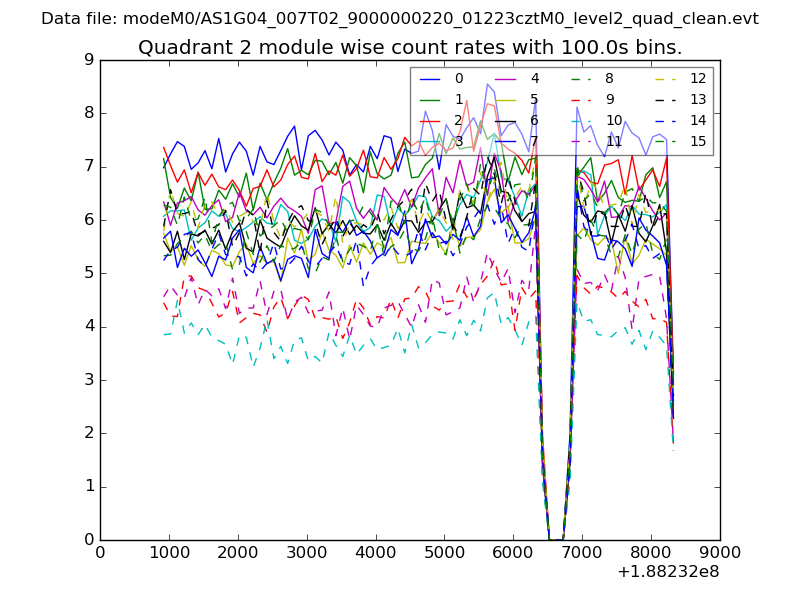
| Module-wise count rates for Quadrant C Data is divided into 100 sec bins |
 |
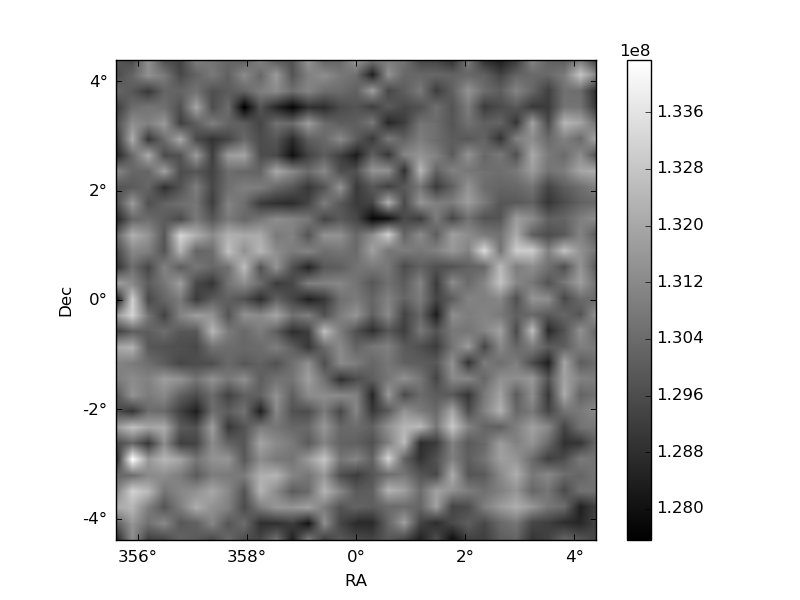 |
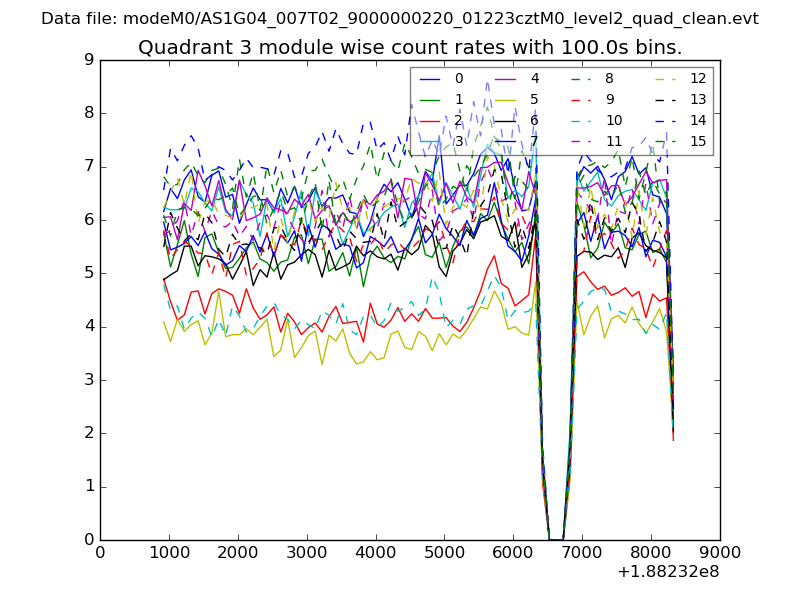
| Module-wise count rates for Quadrant D Data is divided into 100 sec bins |
 |
 |
| Parameter | Plot |
|---|---|
| CZT HV Monitor | 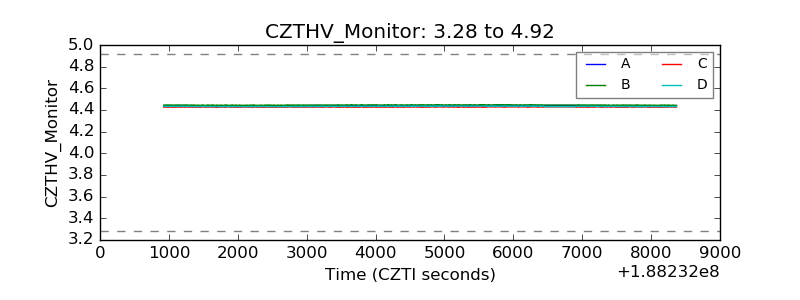 |
| D_VDD | 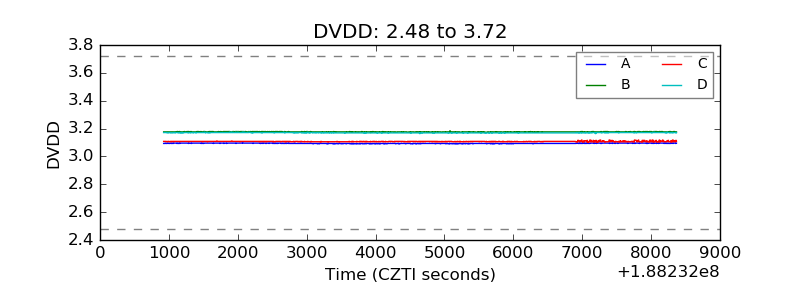 |
| Temperature 1 | 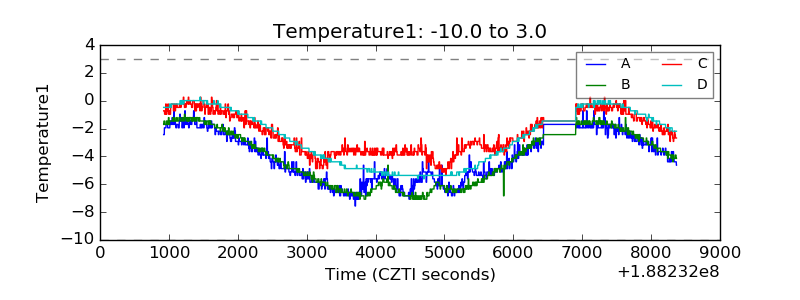 |
| Veto HV Monitor | 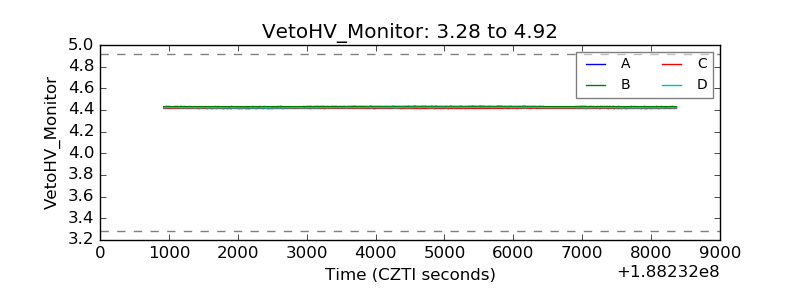 |
| Veto LLD | 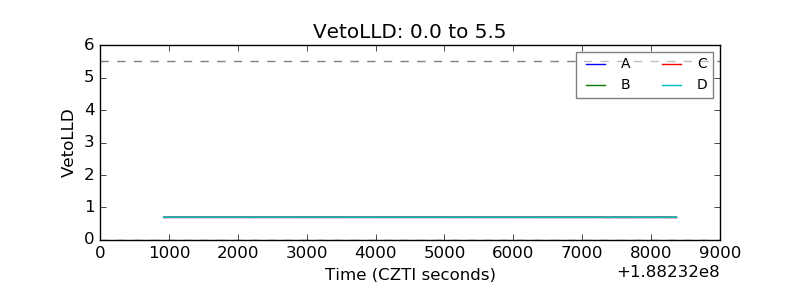 |
| Alpha Counter | 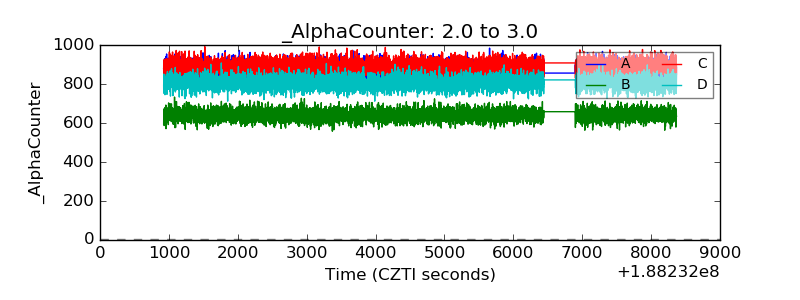 |
| _CPM_Rate | 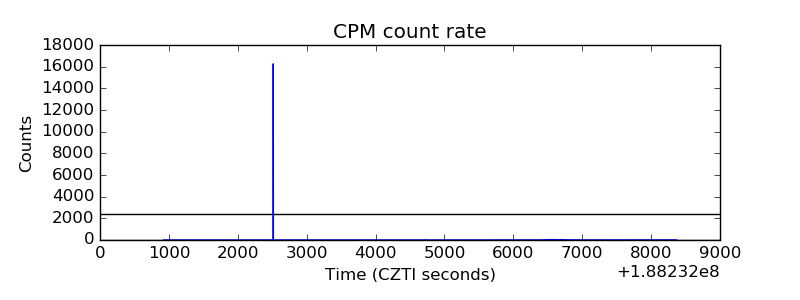 |
| CZT Counter | 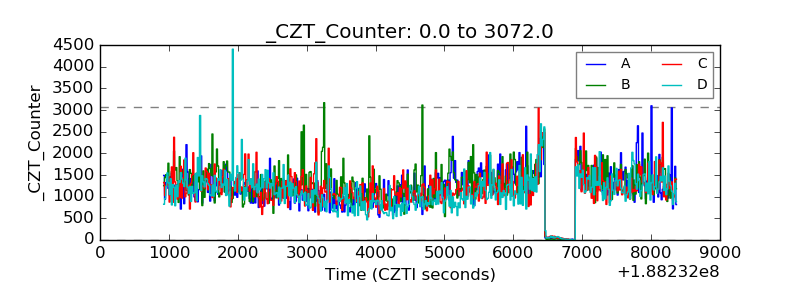 |
| +2.5 Volts monitor |  |
| +5 Volts monitor |  |
| _ROLL_ROT | 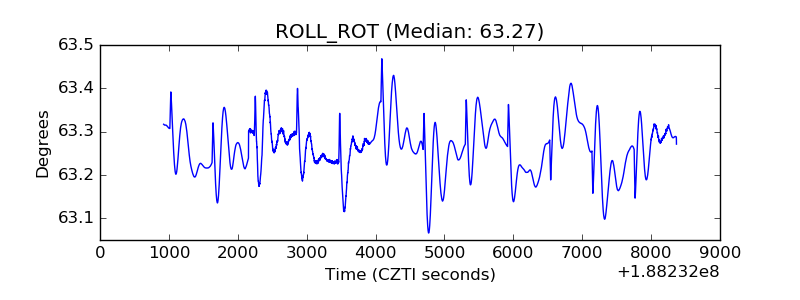 |
| _Roll_DEC | 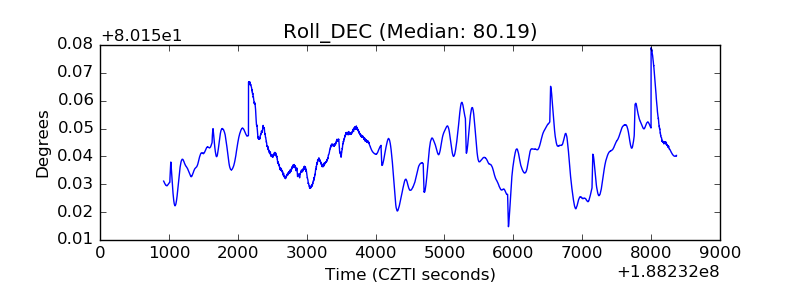 |
| _Roll_RA | 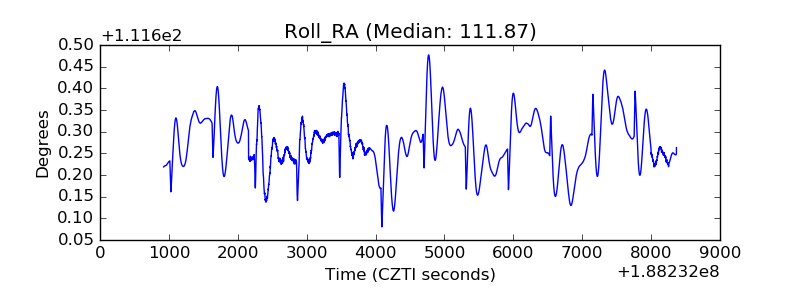 |
| Veto Counter | 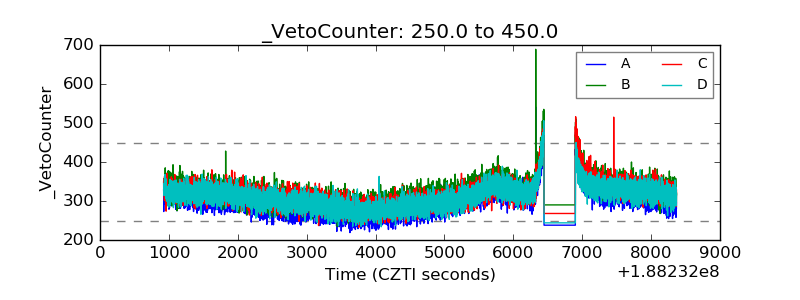 |