| Param | Original file | Final file |
|---|---|---|
| Filename | modeM0/AS1G04_003T01_9000000222_01223cztM0_level2.evt | modeM0/AS1G04_003T01_9000000222_01223cztM0_level2_quad_clean.evt |
| Size (bytes) | 876,107,520 | 77,728,320 |
| Size | 835.5 MB | 74.1 MB |
| Events in quadrant A | 6,466,872 | 506,880 |
| Events in quadrant B | 6,701,811 | 504,082 |
| Events in quadrant C | 6,332,991 | 493,186 |
| Events in quadrant D | 6,678,407 | 477,326 |
| Mode SS | |||
|---|---|---|---|
| Quadrant | BADHDUFLAG | Total packets | Discarded packets |
| A | 0 | 108 | 0 |
| B | 0 | 108 | 0 |
| C | 0 | 108 | 0 |
| D | 0 | 108 | 0 |
| Mode M0 | |||
|---|---|---|---|
| Quadrant | BADHDUFLAG | Total packets | Discarded packets |
| A | 0 | 22959 | 2 |
| B | 0 | 23635 | 1 |
| C | 0 | 22582 | 1 |
| D | 0 | 23654 | 1 |
| Mode M9 | |||
|---|---|---|---|
| Quadrant | BADHDUFLAG | Total packets | Discarded packets |
| A | 0 | 6 | 0 |
| B | 0 | 6 | 0 |
| C | 0 | 6 | 0 |
| D | 0 | 6 | 0 |
| Quadrant | Total seconds | Saturated seconds | Saturation percentage |
|---|---|---|---|
| A | 5317 | 25 | 0.470190% |
| B | 5317 | 4 | 0.075230% |
| C | 5317 | 6 | 0.112846% |
| D | 5317 | 128 | 2.407373% |
Noise dominated data is calculated using 1-second bins in cleaned event files. If a bin has >2000 counts, and if more than 50% of those come from <1% of pixels, then it is considered to be noise-dominated and hence unusable.
| Quadrant | # 1 sec bins | Bins with >0 counts | Bins with >2000 counts | High rate bins dominated by noise | Noise dominated (total time) | Noise dominated (detector-on time) | Marked lightcurve |
|---|---|---|---|---|---|---|---|
| A | 5947 | 5318 | 270 | 270 | 4.54% | 5.08% | 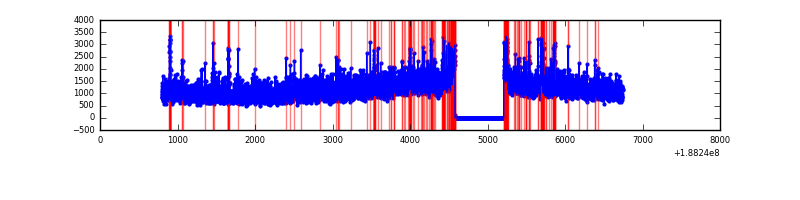 |
| B | 5947 | 5318 | 194 | 194 | 3.26% | 3.65% | 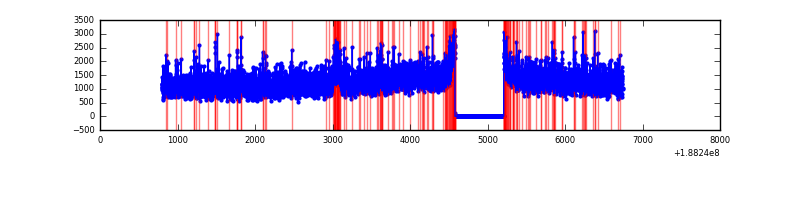 |
| C | 5947 | 5318 | 136 | 136 | 2.29% | 2.56% |  |
| D | 5947 | 5318 | 516 | 516 | 8.68% | 9.70% | 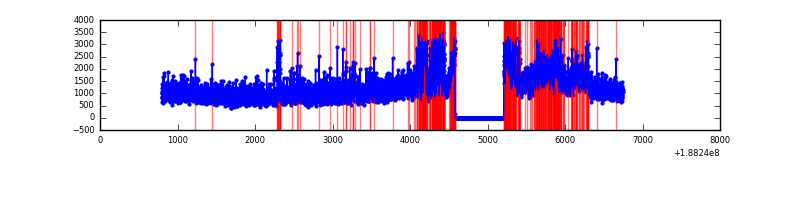 |
Top three noisy pixels from each quadrant. If the there are fewer than three noisy pixels in the level2.evt file, extra rows are filled as -1
| Pixel properties | Quadrant properties | ||||||
|---|---|---|---|---|---|---|---|
| Quadrant | DetID | PixID | Counts | Sigma | Mean | Median | Sigma |
| A | 15 | 127 | 272445 | 697.56 | 1612 | 1625 | 388.2 |
| A | 13 | 235 | 5909 | 11.03 | 1612 | 1625 | 388.2 |
| A | 11 | 79 | 5686 | 10.46 | 1612 | 1625 | 388.2 |
| B | 5 | 191 | 76588 | 188.15 | 1684 | 1696 | 398.1 |
| B | 15 | 22 | 58093 | 141.68 | 1684 | 1696 | 398.1 |
| B | 2 | 32 | 42736 | 103.1 | 1684 | 1696 | 398.1 |
| C | 15 | 241 | 280318 | 646.42 | 1539 | 1594 | 431.2 |
| C | 3 | 111 | 23480 | 50.76 | 1539 | 1594 | 431.2 |
| C | 3 | 79 | 20941 | 44.87 | 1539 | 1594 | 431.2 |
| D | 10 | 102 | 501633 | 1087.79 | 1470 | 1517 | 459.8 |
| D | 13 | 169 | 336596 | 728.82 | 1470 | 1517 | 459.8 |
| D | 10 | 84 | 159884 | 344.46 | 1470 | 1517 | 459.8 |
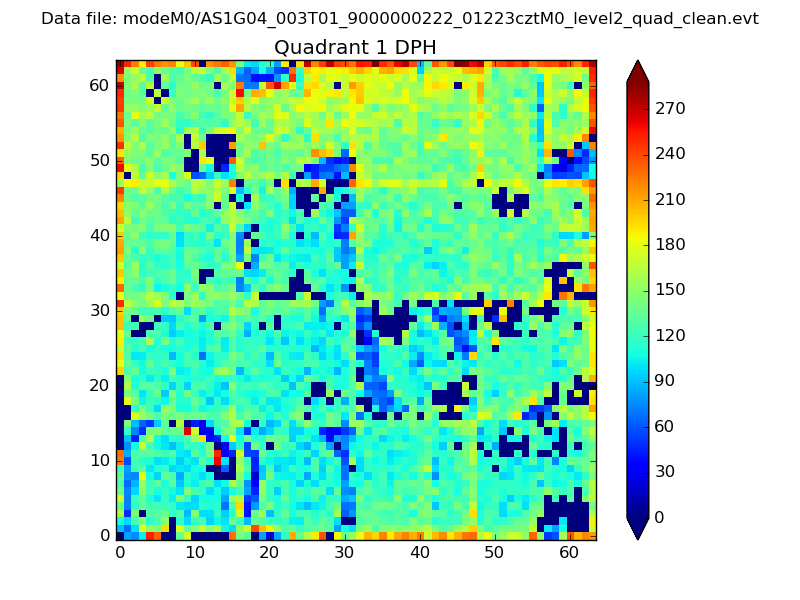
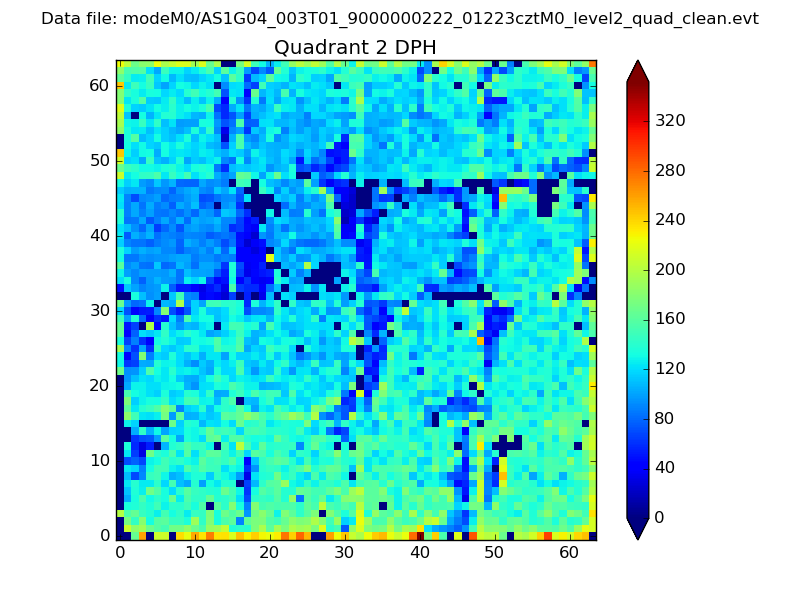
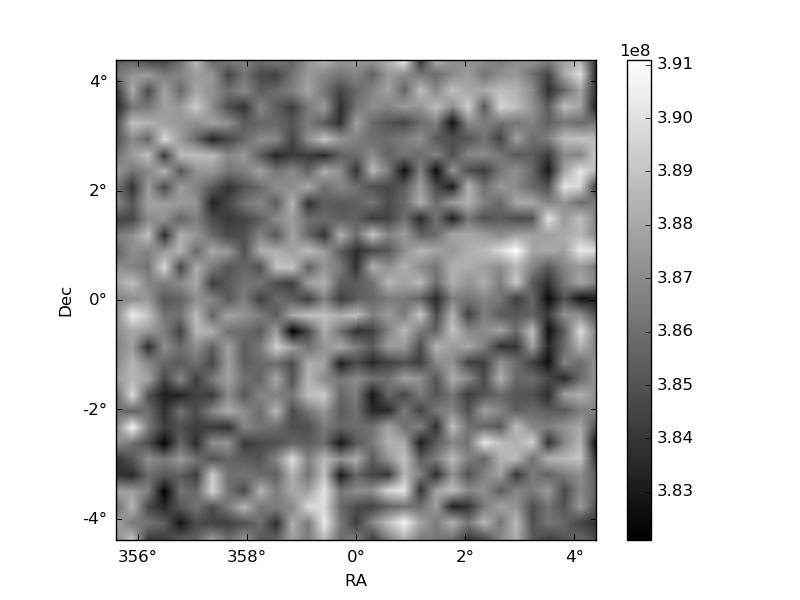
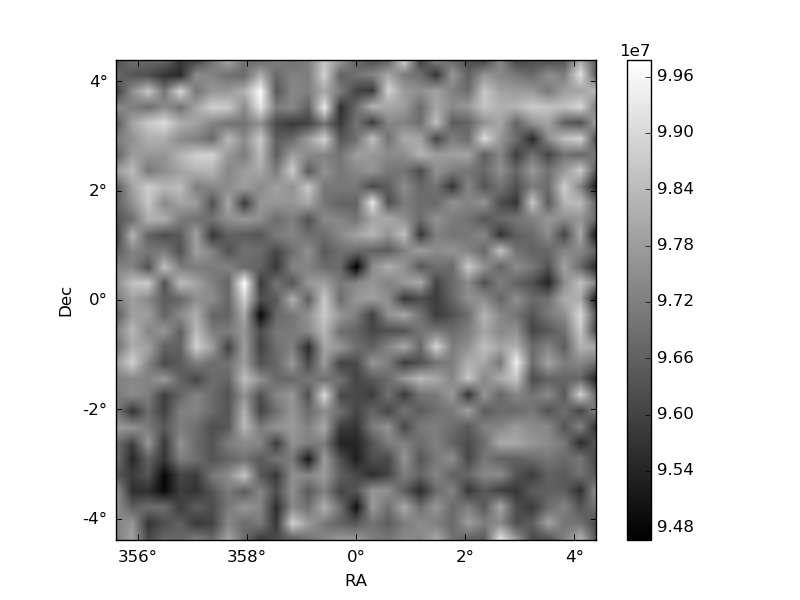
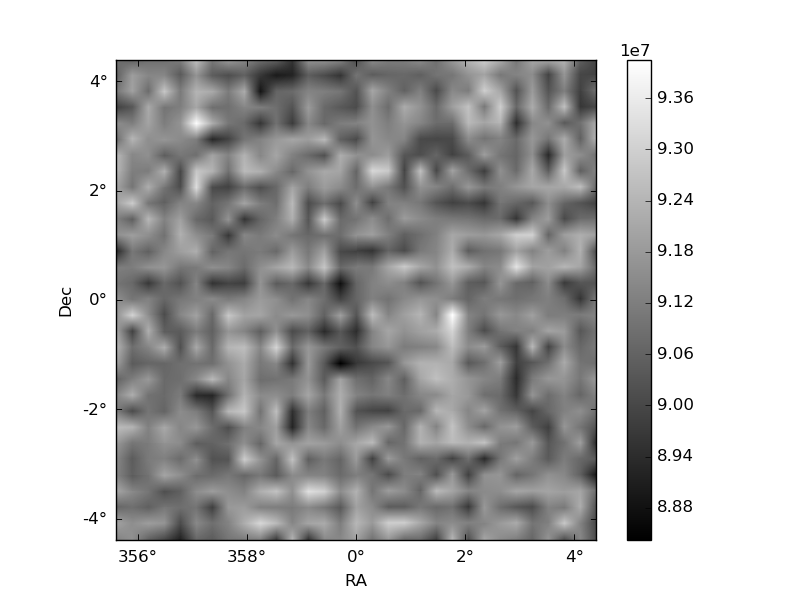
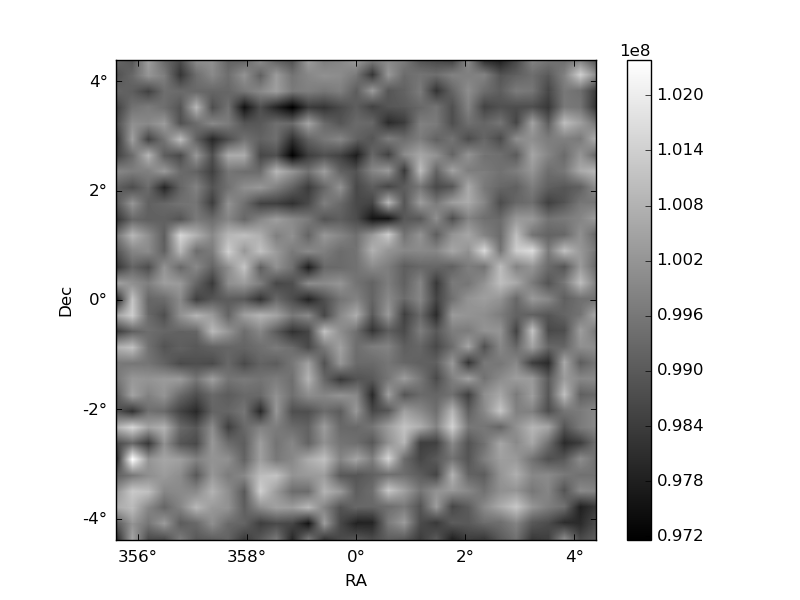
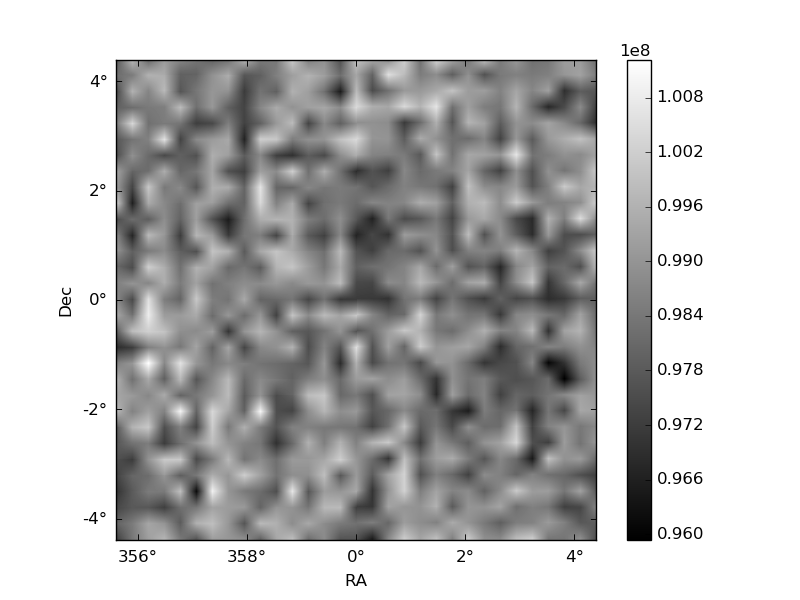
Histogram calculated using DETX and DETY for each event in the final _common_clean file
| Quadrant A | 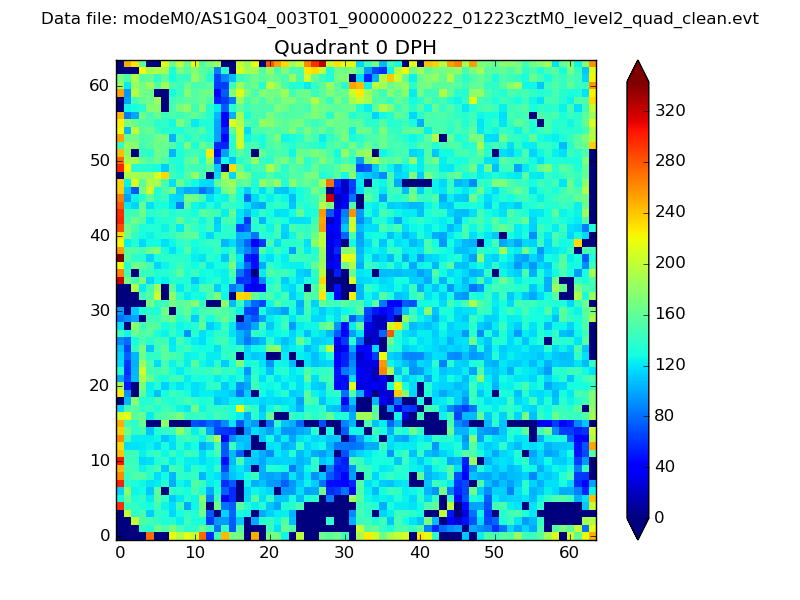 |
 |
Quadrant B |
|---|---|---|---|
| Quadrant D | 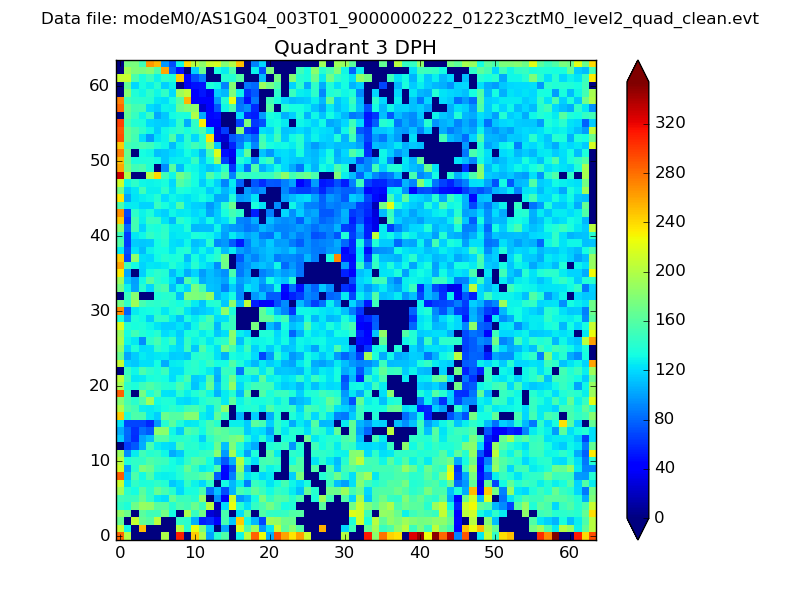 |
 |
Quadrant C |
| Plot type | Count rate plots | Images |
|---|---|---|
| Comparison with Poisson distribution Blue bars denote a histogram of data divided into 1 sec bins. Red curve is a Poisson curve with rate = median count rate of data. |
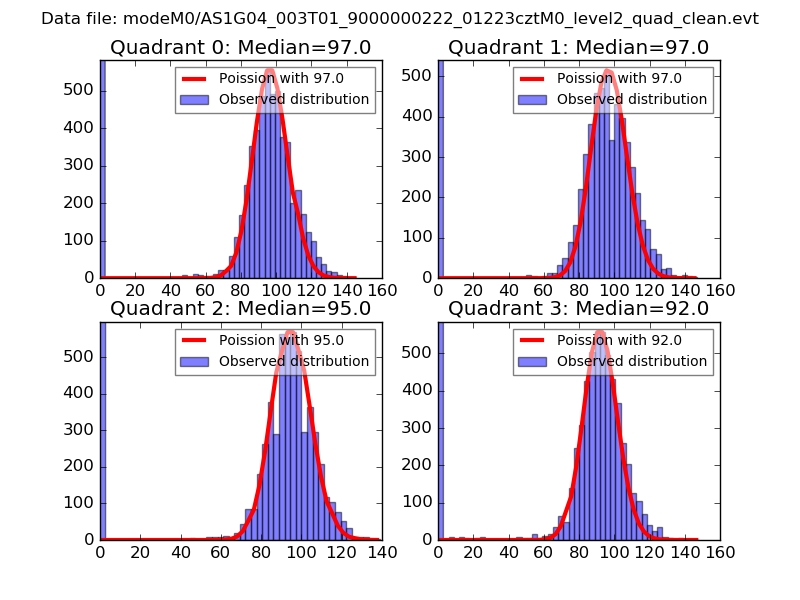 |
 |
| Quadrant-wise count rates Data is divided into 100 sec bins |
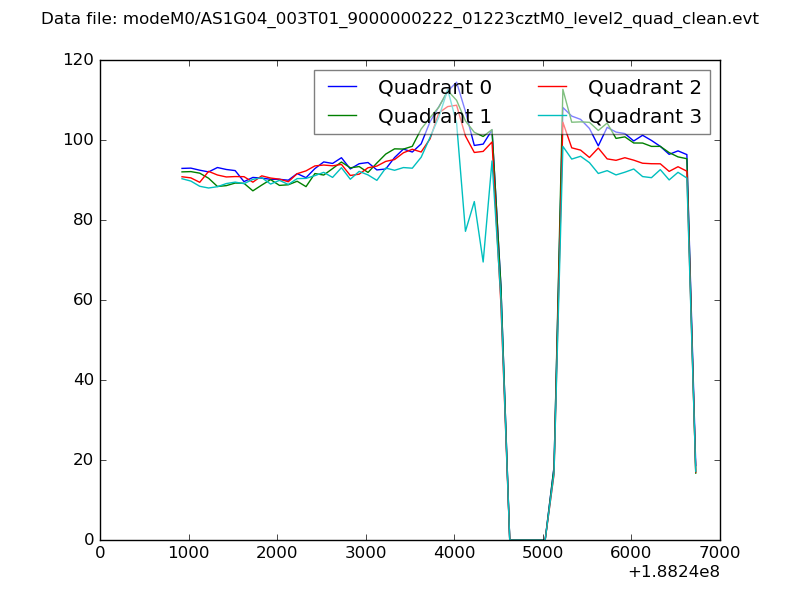 |
|
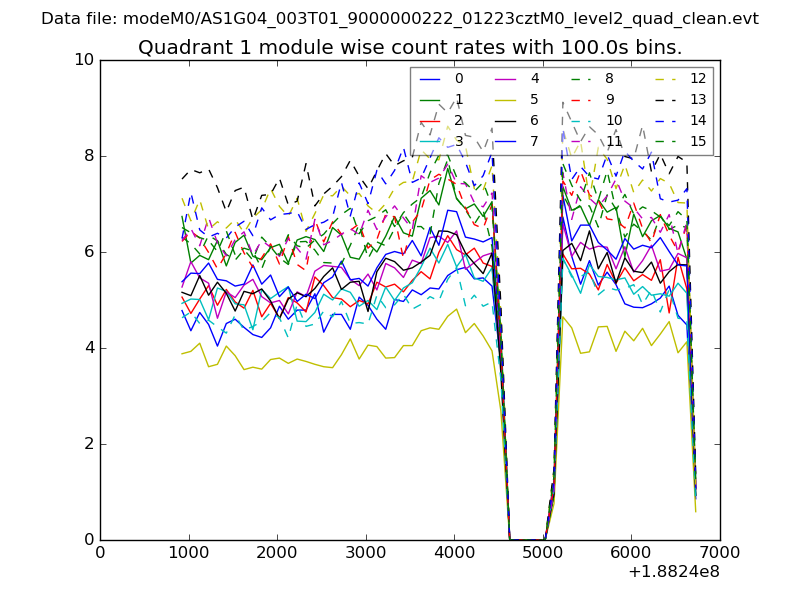
| Module-wise count rates for Quadrant A Data is divided into 100 sec bins |
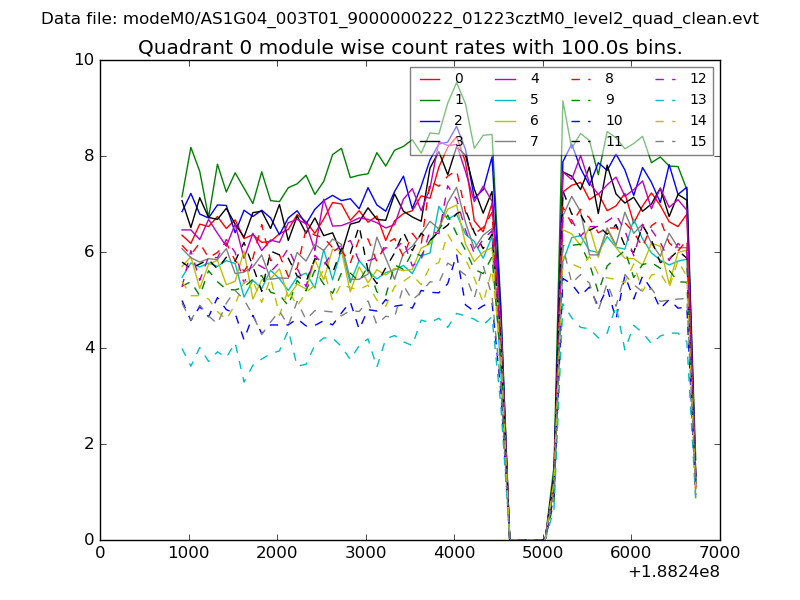 |
 |
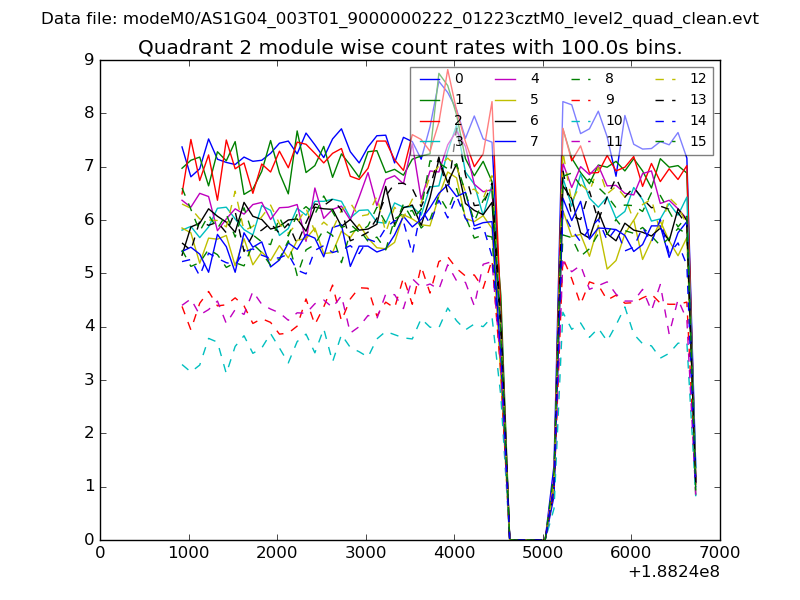
| Module-wise count rates for Quadrant B Data is divided into 100 sec bins |
 |
 |
| Module-wise count rates for Quadrant C Data is divided into 100 sec bins |
 |
 |
| Module-wise count rates for Quadrant D Data is divided into 100 sec bins |
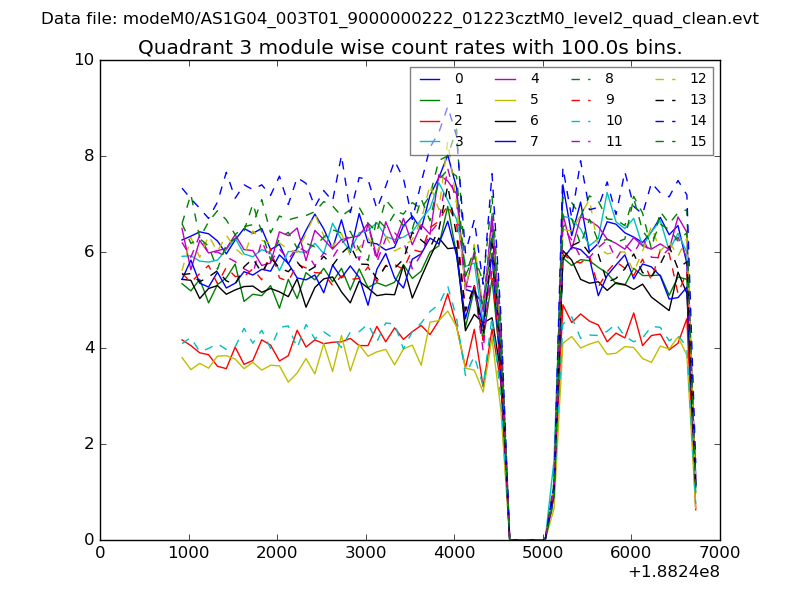 |
 |
| Parameter | Plot |
|---|---|
| CZT HV Monitor | 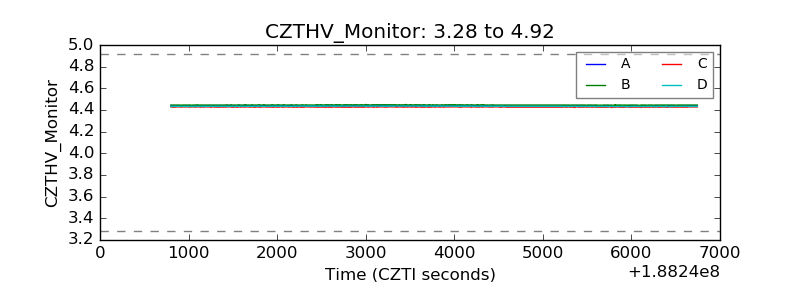 |
| D_VDD | 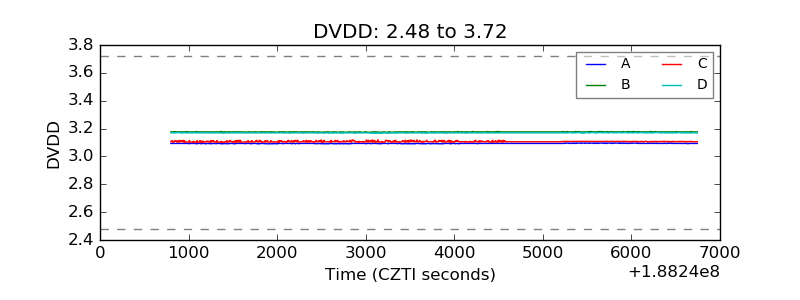 |
| Temperature 1 | 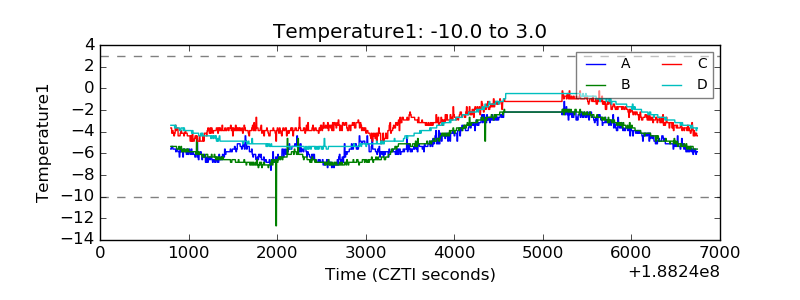 |
| Veto HV Monitor |  |
| Veto LLD | 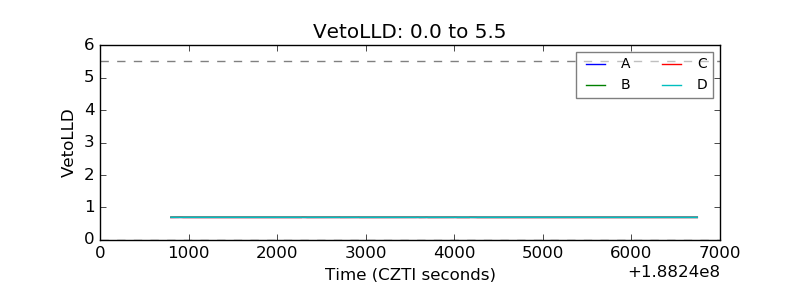 |
| Alpha Counter | 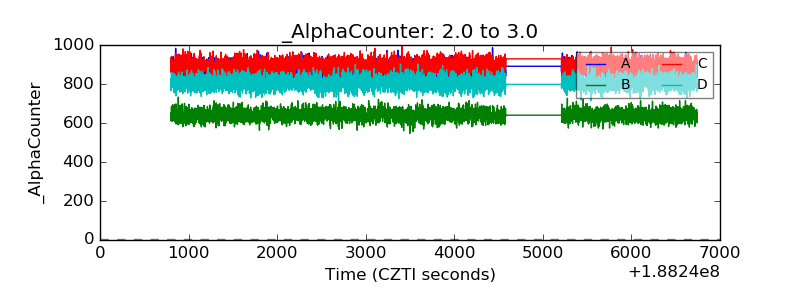 |
| _CPM_Rate | 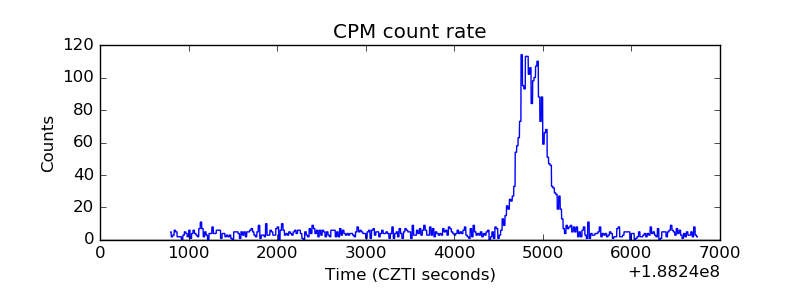 |
| CZT Counter | 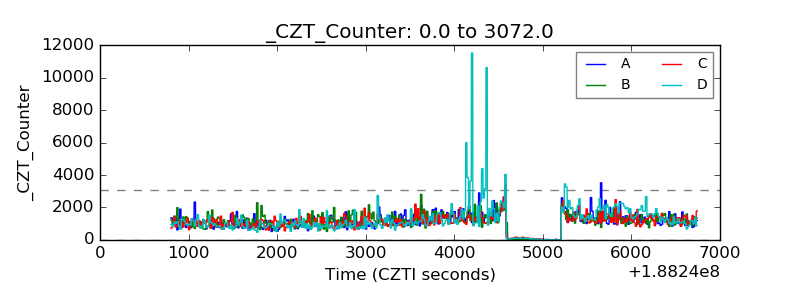 |
| +2.5 Volts monitor |  |
| +5 Volts monitor |  |
| _ROLL_ROT | 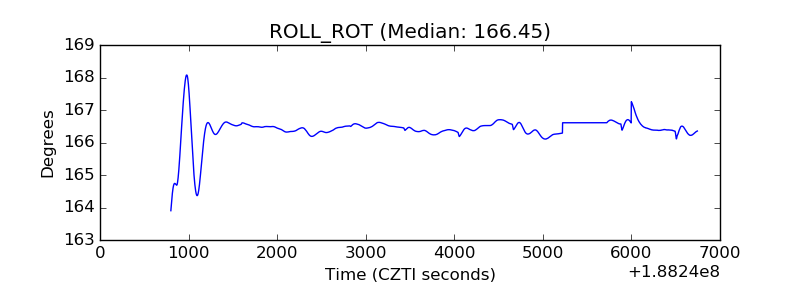 |
| _Roll_DEC |  |
| _Roll_RA | 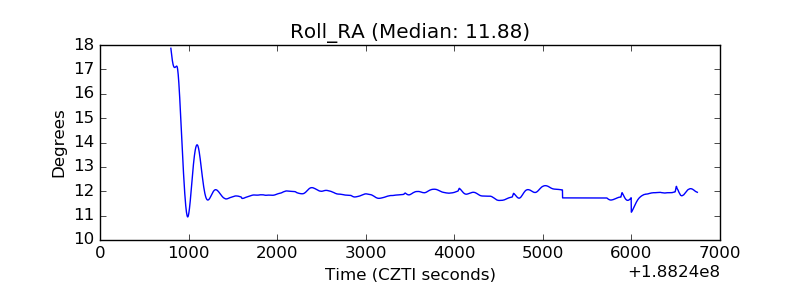 |
| Veto Counter | 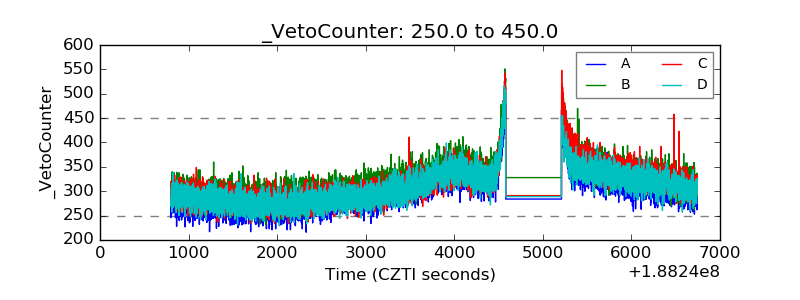 |