| Param | Original file | Final file |
|---|---|---|
| Filename | modeM0/AS1G04_003T01_9000000222_01225cztM0_level2.evt | modeM0/AS1G04_003T01_9000000222_01225cztM0_level2_quad_clean.evt |
| Size (bytes) | 1,110,453,120 | 101,393,280 |
| Size | 1.0 GB | 96.7 MB |
| Events in quadrant A | 7,865,140 | 664,656 |
| Events in quadrant B | 8,152,011 | 661,611 |
| Events in quadrant C | 7,935,475 | 648,647 |
| Events in quadrant D | 9,238,000 | 632,946 |
| Mode SS | |||
|---|---|---|---|
| Quadrant | BADHDUFLAG | Total packets | Discarded packets |
| A | 0 | 132 | 0 |
| B | 0 | 132 | 0 |
| C | 0 | 132 | 0 |
| D | 0 | 132 | 0 |
| Mode M0 | |||
|---|---|---|---|
| Quadrant | BADHDUFLAG | Total packets | Discarded packets |
| A | 0 | 28122 | 2 |
| B | 0 | 28917 | 1 |
| C | 0 | 28257 | 1 |
| D | 0 | 32163 | 1 |
| Mode M9 | |||
|---|---|---|---|
| Quadrant | BADHDUFLAG | Total packets | Discarded packets |
| A | 0 | 11 | 0 |
| B | 0 | 11 | 0 |
| C | 0 | 11 | 0 |
| D | 0 | 11 | 0 |
| Quadrant | Total seconds | Saturated seconds | Saturation percentage |
|---|---|---|---|
| A | 6650 | 13 | 0.195489% |
| B | 6650 | 35 | 0.526316% |
| C | 6650 | 11 | 0.165414% |
| D | 6650 | 91 | 1.368421% |
Noise dominated data is calculated using 1-second bins in cleaned event files. If a bin has >2000 counts, and if more than 50% of those come from <1% of pixels, then it is considered to be noise-dominated and hence unusable.
| Quadrant | # 1 sec bins | Bins with >0 counts | Bins with >2000 counts | High rate bins dominated by noise | Noise dominated (total time) | Noise dominated (detector-on time) | Marked lightcurve |
|---|---|---|---|---|---|---|---|
| A | 7660 | 6651 | 159 | 159 | 2.08% | 2.39% | 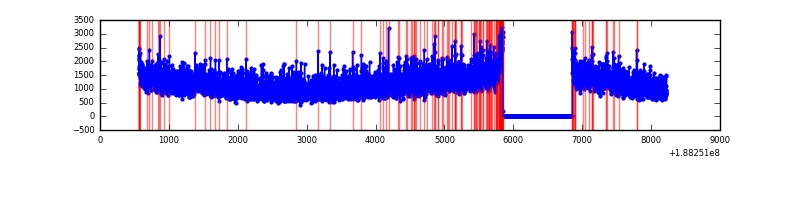 |
| B | 7660 | 6651 | 198 | 198 | 2.58% | 2.98% | 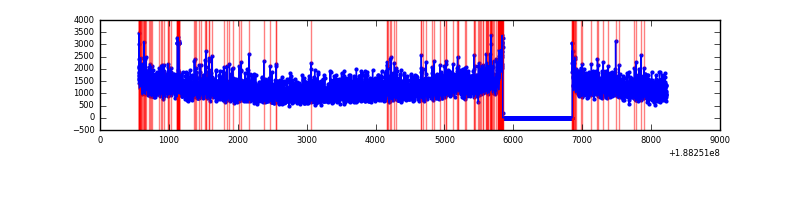 |
| C | 7660 | 6650 | 139 | 139 | 1.81% | 2.09% | 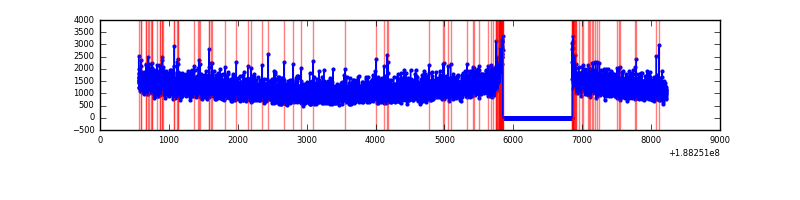 |
| D | 7660 | 6651 | 811 | 811 | 10.59% | 12.19% | 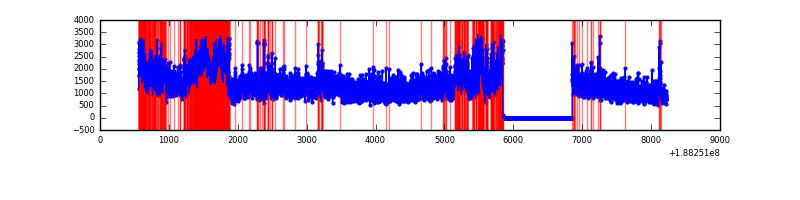 |
Top three noisy pixels from each quadrant. If the there are fewer than three noisy pixels in the level2.evt file, extra rows are filled as -1
| Pixel properties | Quadrant properties | ||||||
|---|---|---|---|---|---|---|---|
| Quadrant | DetID | PixID | Counts | Sigma | Mean | Median | Sigma |
| A | 3 | 80 | 162482 | 336.79 | 1990 | 2005 | 476.5 |
| A | 15 | 127 | 53285 | 107.62 | 1990 | 2005 | 476.5 |
| A | 12 | 243 | 9428 | 15.58 | 1990 | 2005 | 476.5 |
| B | 5 | 191 | 99114 | 198.19 | 2080 | 2091 | 489.6 |
| B | 15 | 22 | 46539 | 90.79 | 2080 | 2091 | 489.6 |
| B | 6 | 53 | 31730 | 60.54 | 2080 | 2091 | 489.6 |
| C | 15 | 241 | 340185 | 630.28 | 1930 | 1998 | 536.6 |
| C | 3 | 111 | 26289 | 45.27 | 1930 | 1998 | 536.6 |
| C | 3 | 79 | 19790 | 33.16 | 1930 | 1998 | 536.6 |
| D | 13 | 169 | 1768337 | 3111.13 | 1836 | 1901 | 567.8 |
| D | 12 | 22 | 288167 | 504.19 | 1836 | 1901 | 567.8 |
| D | 10 | 84 | 174683 | 304.31 | 1836 | 1901 | 567.8 |
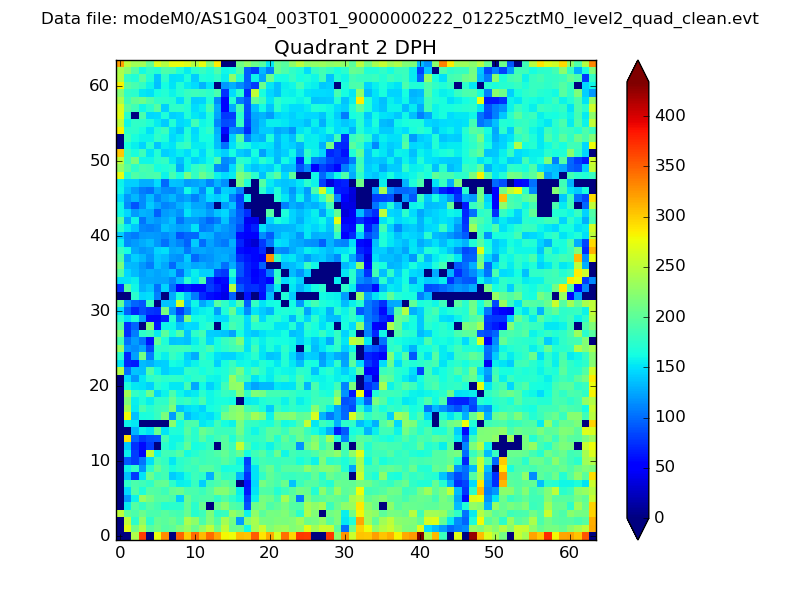
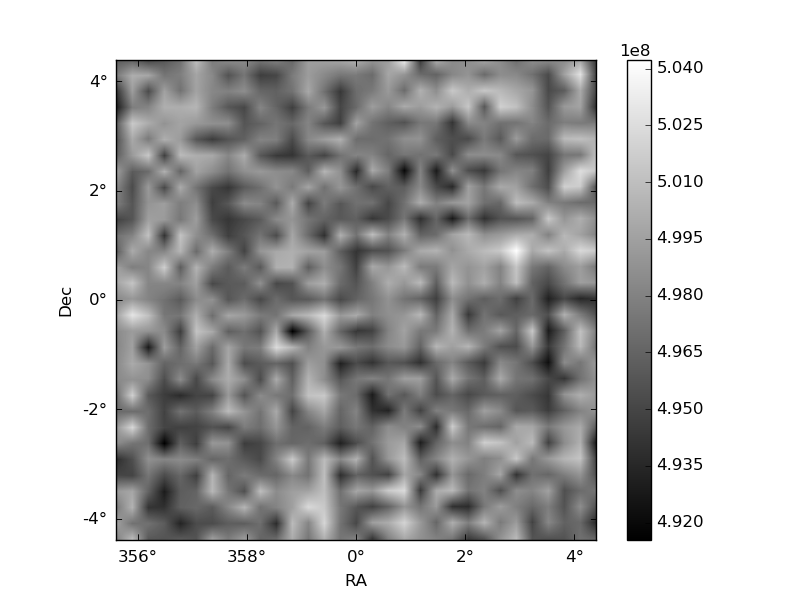
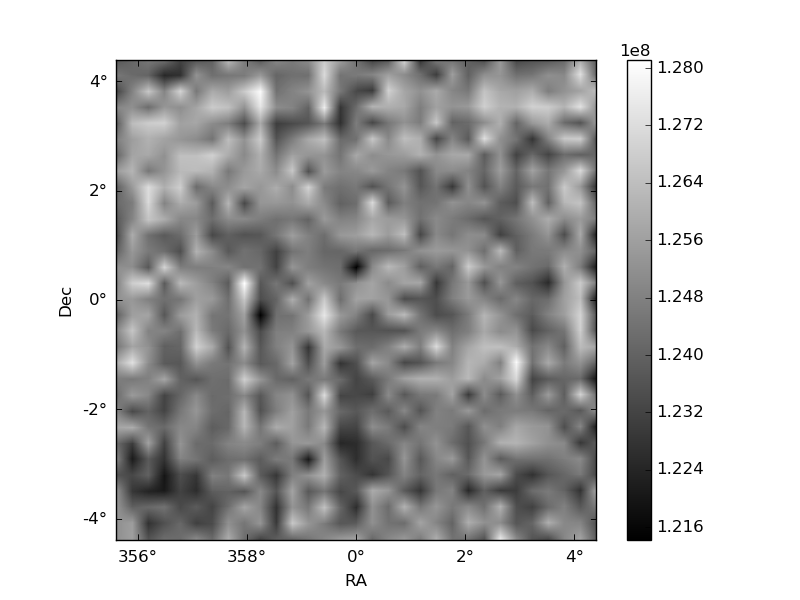
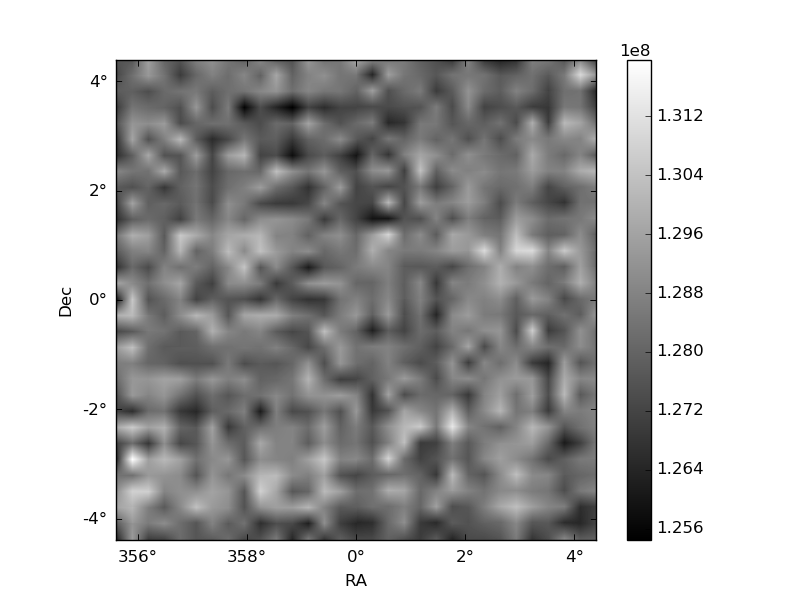
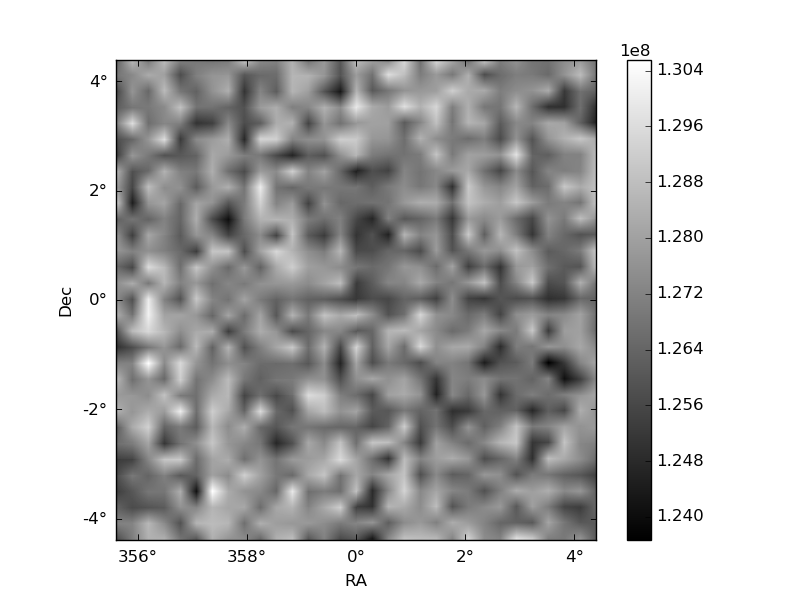
Histogram calculated using DETX and DETY for each event in the final _common_clean file
| Quadrant A | 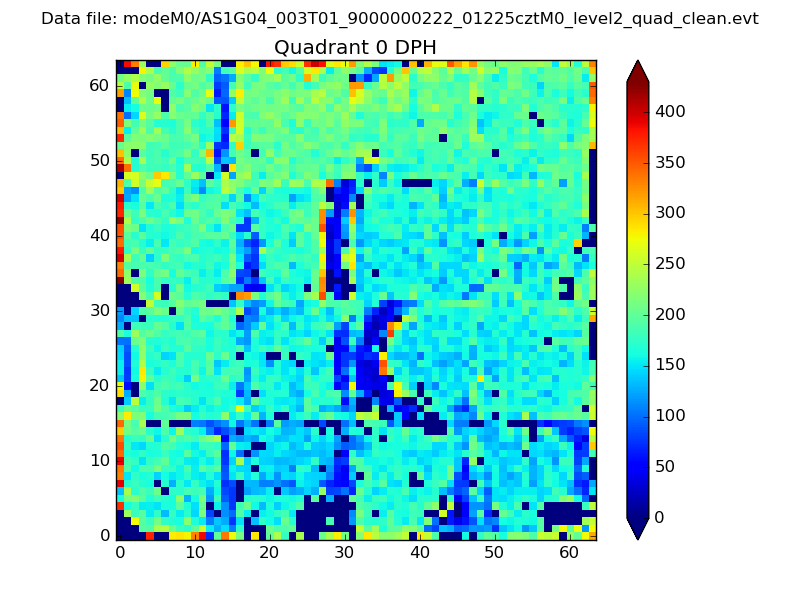 |
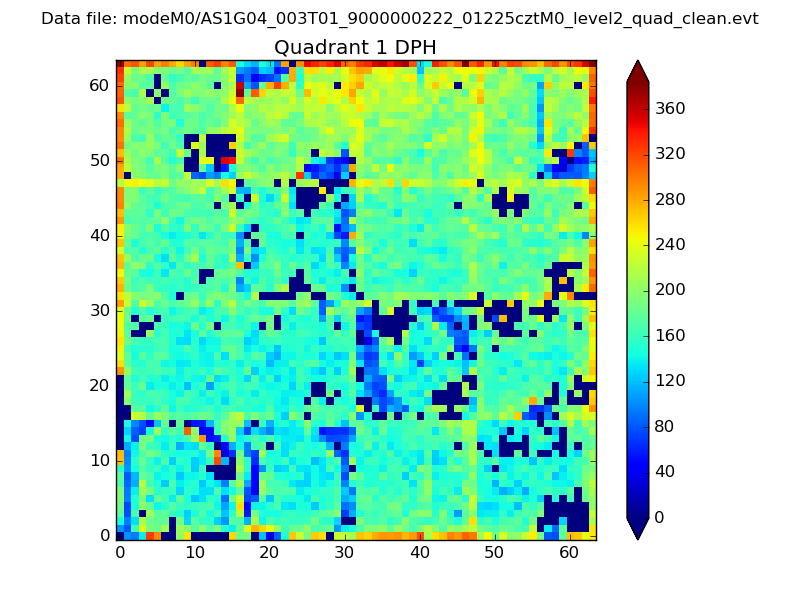 |
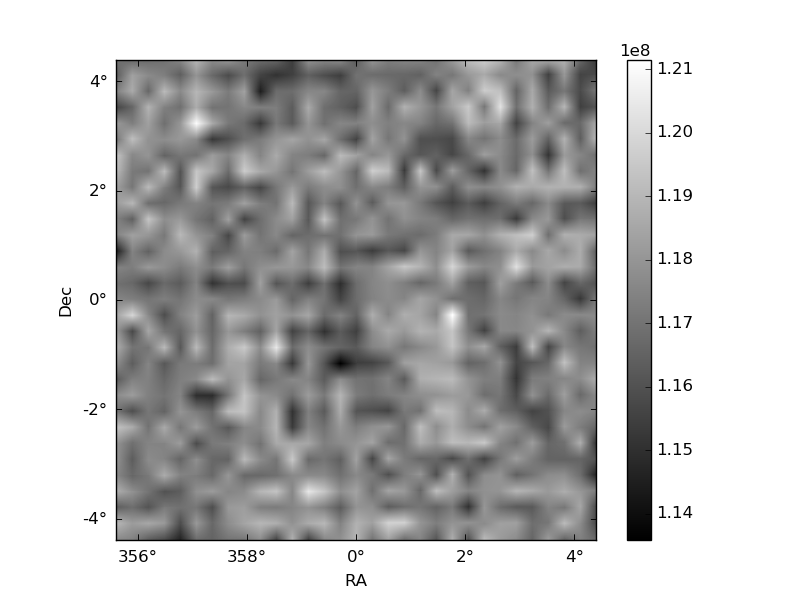
Quadrant B |
|---|---|---|---|
| Quadrant D | 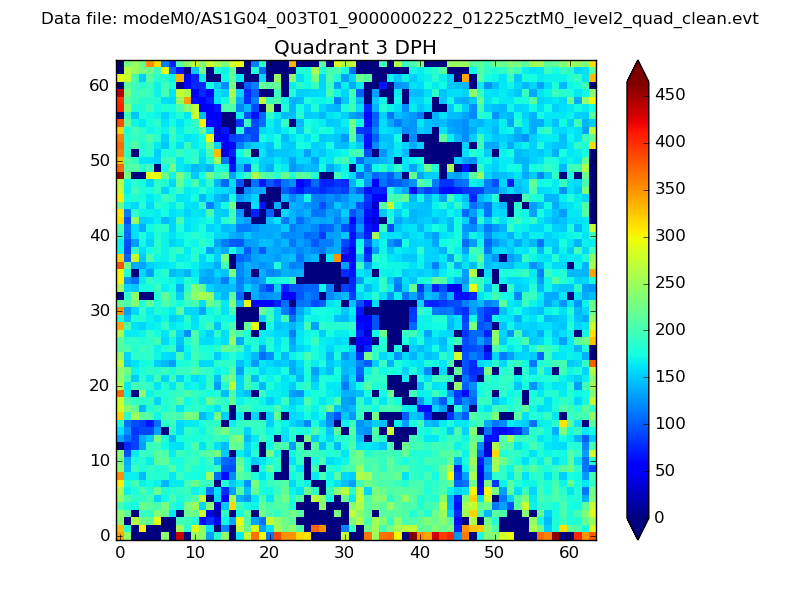 |
 |
Quadrant C |
| Plot type | Count rate plots | Images |
|---|---|---|
| Comparison with Poisson distribution Blue bars denote a histogram of data divided into 1 sec bins. Red curve is a Poisson curve with rate = median count rate of data. |
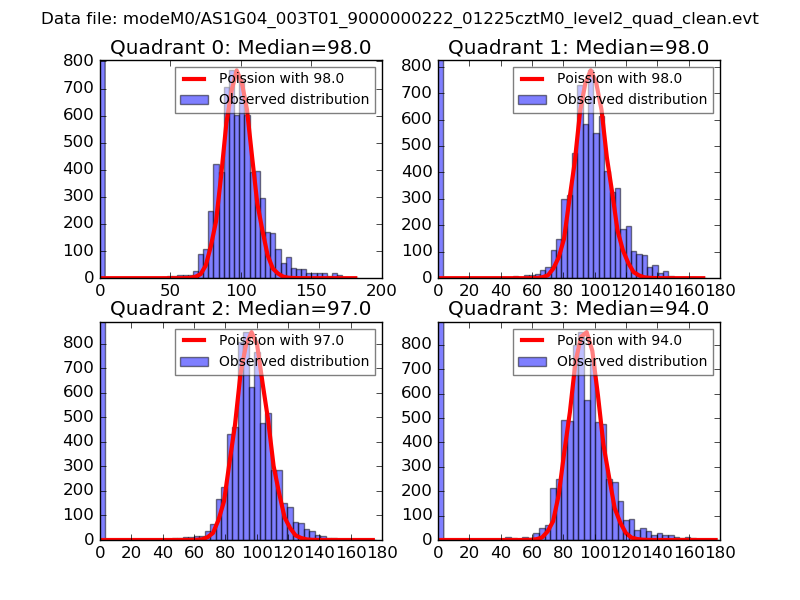 |
 |
| Quadrant-wise count rates Data is divided into 100 sec bins |
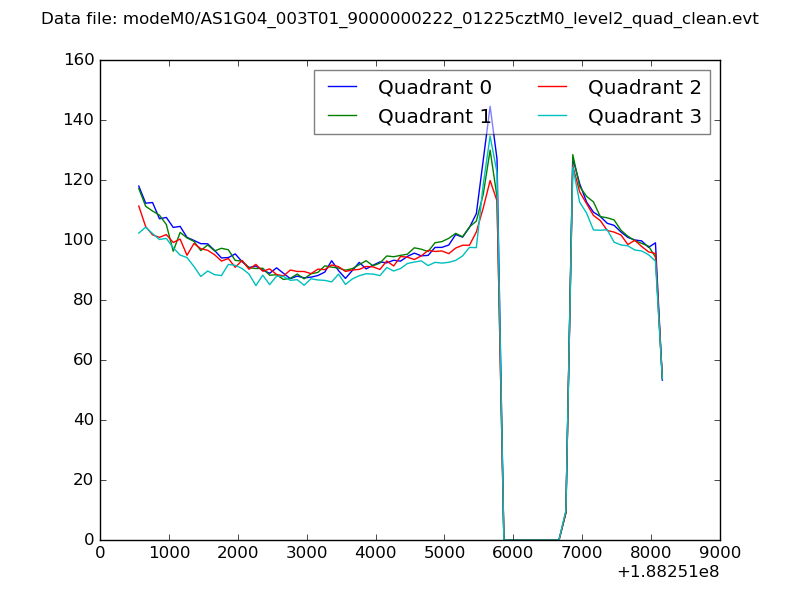 |
|
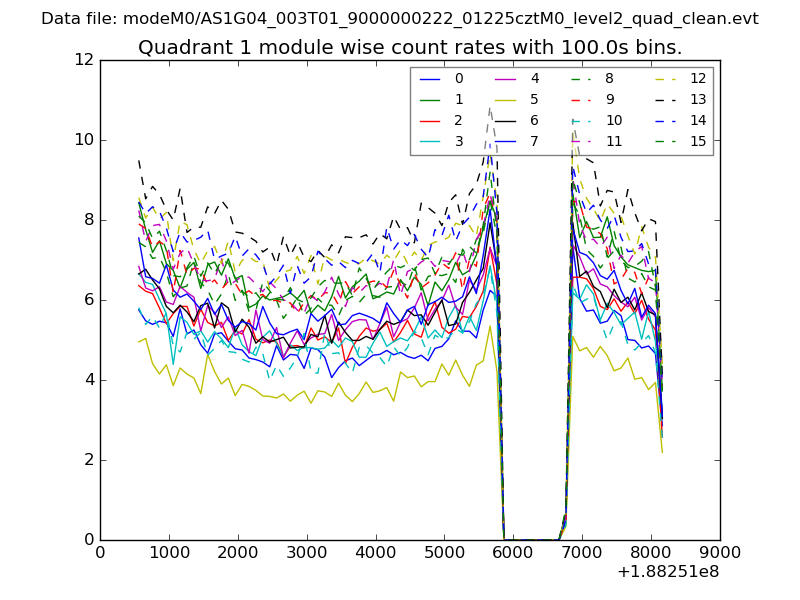
| Module-wise count rates for Quadrant A Data is divided into 100 sec bins |
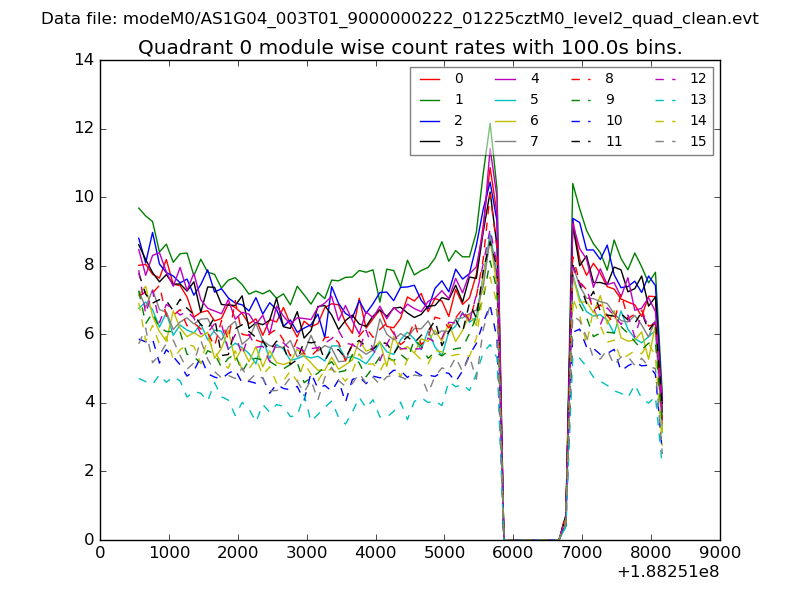 |
 |
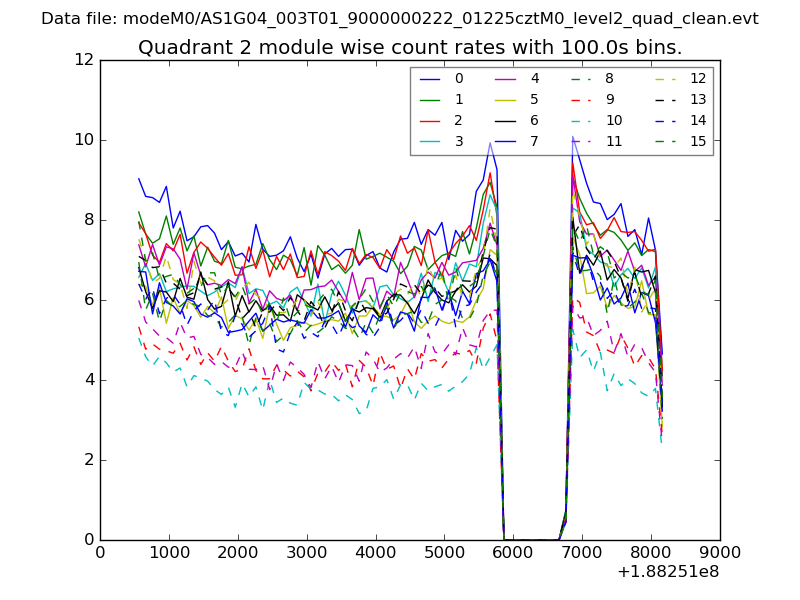
| Module-wise count rates for Quadrant B Data is divided into 100 sec bins |
 |
 |
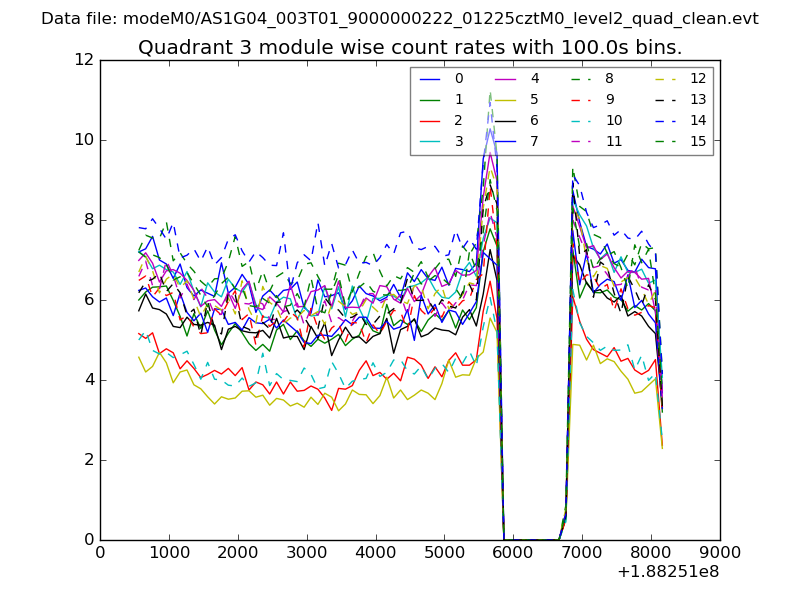
| Module-wise count rates for Quadrant C Data is divided into 100 sec bins |
 |
 |
| Module-wise count rates for Quadrant D Data is divided into 100 sec bins |
 |
 |
| Parameter | Plot |
|---|---|
| CZT HV Monitor | 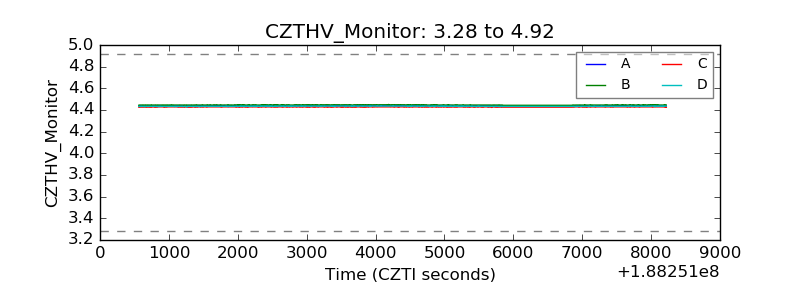 |
| D_VDD | 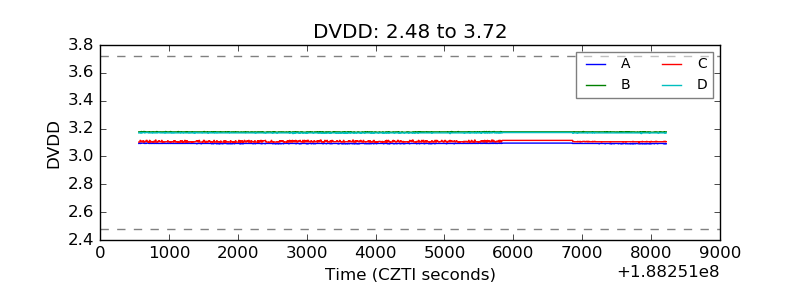 |
| Temperature 1 | 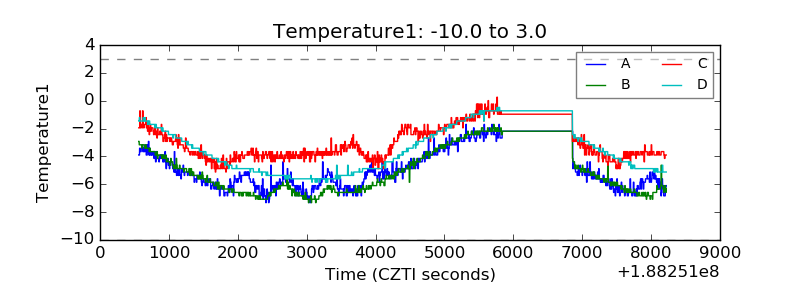 |
| Veto HV Monitor | 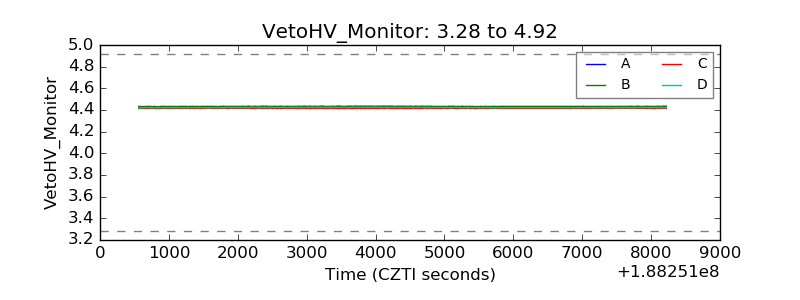 |
| Veto LLD | 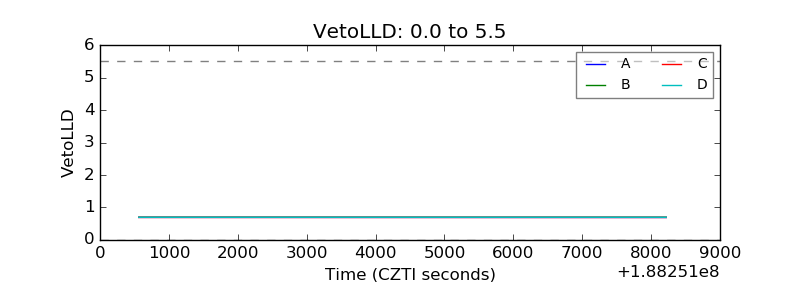 |
| Alpha Counter | 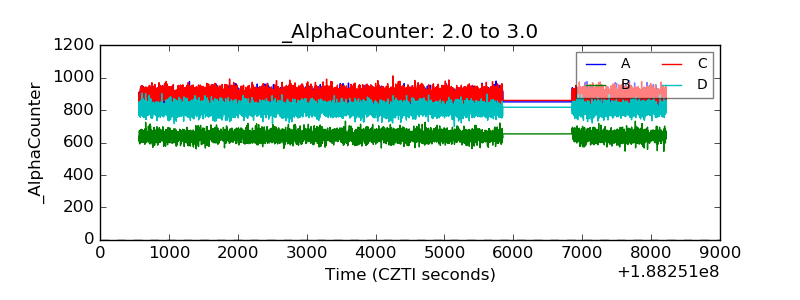 |
| _CPM_Rate | 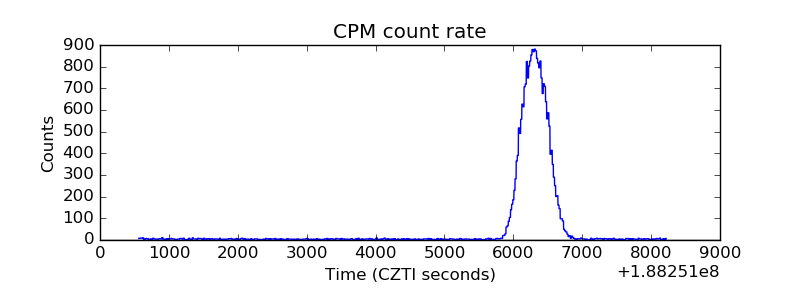 |
| CZT Counter | 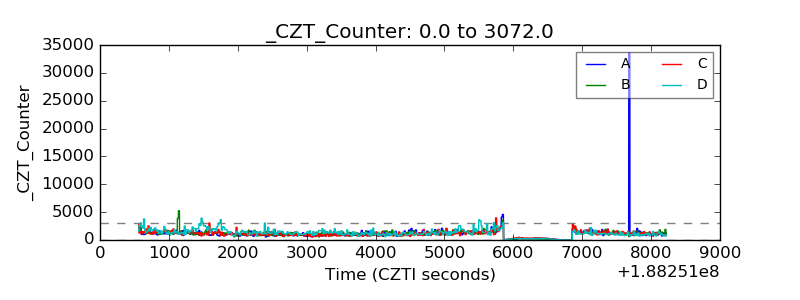 |
| +2.5 Volts monitor |  |
| +5 Volts monitor |  |
| _ROLL_ROT | 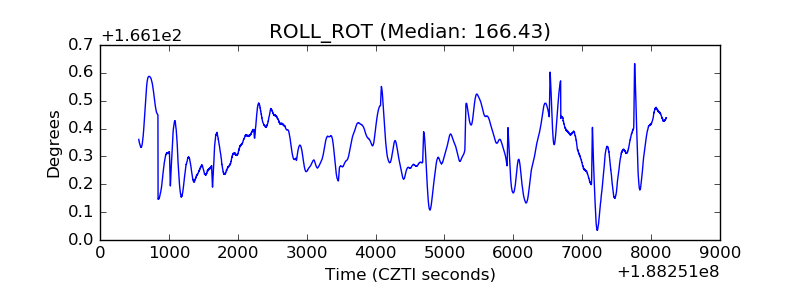 |
| _Roll_DEC | 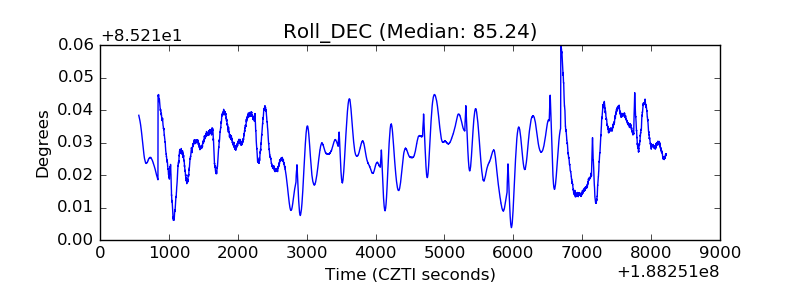 |
| _Roll_RA | 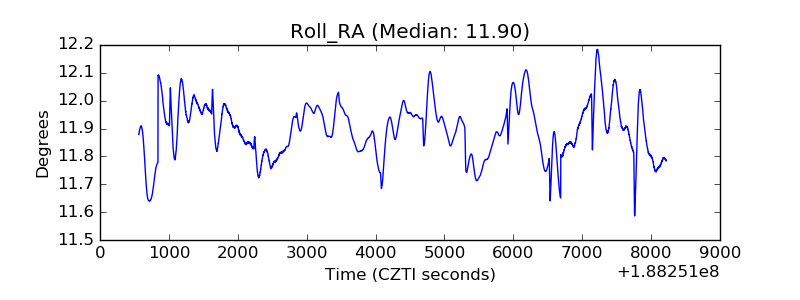 |
| Veto Counter | 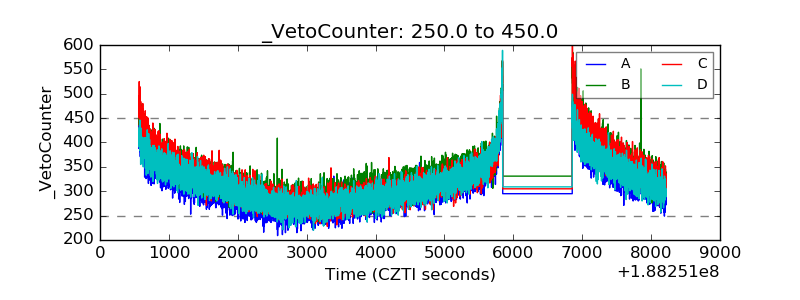 |