| Param | Original file | Final file |
|---|---|---|
| Filename | modeM0/AS1G04_003T01_9000000222_01228cztM0_level2.evt | modeM0/AS1G04_003T01_9000000222_01228cztM0_level2_quad_clean.evt |
| Size (bytes) | 781,796,160 | 78,580,800 |
| Size | 745.6 MB | 74.9 MB |
| Events in quadrant A | 5,821,734 | 513,382 |
| Events in quadrant B | 6,270,588 | 518,945 |
| Events in quadrant C | 5,818,217 | 505,233 |
| Events in quadrant D | 5,434,148 | 492,166 |
| Mode SS | |||
|---|---|---|---|
| Quadrant | BADHDUFLAG | Total packets | Discarded packets |
| A | 0 | 105 | 3 |
| B | 0 | 104 | 0 |
| C | 0 | 104 | 0 |
| D | 0 | 105 | 1 |
| Mode M0 | |||
|---|---|---|---|
| Quadrant | BADHDUFLAG | Total packets | Discarded packets |
| A | 0 | 21000 | 140 |
| B | 0 | 22284 | 138 |
| C | 0 | 20969 | 123 |
| D | 0 | 19846 | 128 |
| Mode M9 | |||
|---|---|---|---|
| Quadrant | BADHDUFLAG | Total packets | Discarded packets |
| A | 0 | 17 | 0 |
| B | 0 | 17 | 0 |
| C | 0 | 17 | 0 |
| D | 0 | 18 | 0 |
| Quadrant | Total seconds | Saturated seconds | Saturation percentage |
|---|---|---|---|
| A | 4982 | 22 | 0.441590% |
| B | 4982 | 45 | 0.903252% |
| C | 4983 | 15 | 0.301023% |
| D | 4985 | 27 | 0.541625% |
Noise dominated data is calculated using 1-second bins in cleaned event files. If a bin has >2000 counts, and if more than 50% of those come from <1% of pixels, then it is considered to be noise-dominated and hence unusable.
| Quadrant | # 1 sec bins | Bins with >0 counts | Bins with >2000 counts | High rate bins dominated by noise | Noise dominated (total time) | Noise dominated (detector-on time) | Marked lightcurve |
|---|---|---|---|---|---|---|---|
| A | 5059 | 4984 | 156 | 156 | 3.08% | 3.13% | 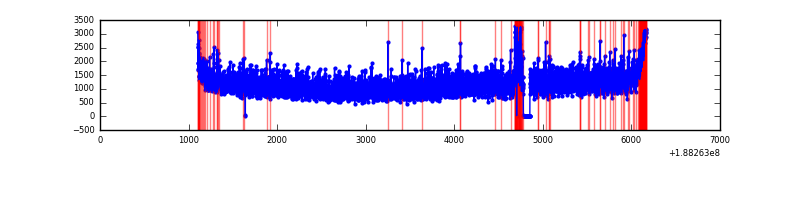 |
| B | 5059 | 4983 | 254 | 254 | 5.02% | 5.10% | 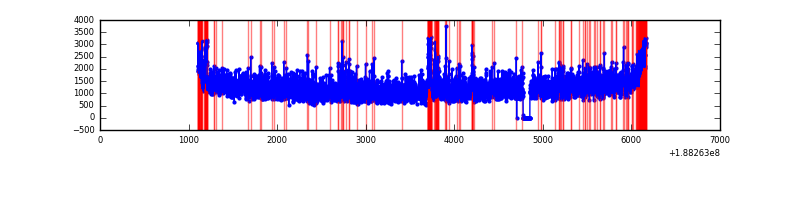 |
| C | 5059 | 4985 | 140 | 140 | 2.77% | 2.81% | 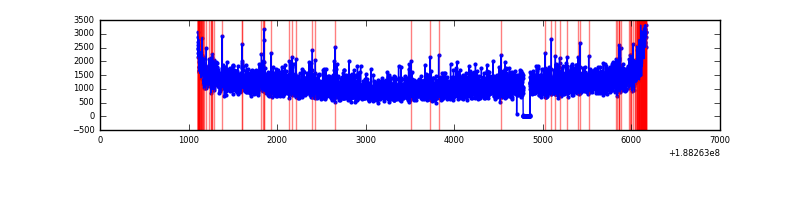 |
| D | 5060 | 4987 | 201 | 201 | 3.97% | 4.03% | 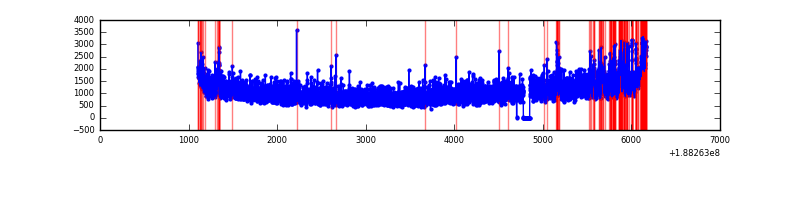 |
Top three noisy pixels from each quadrant. If the there are fewer than three noisy pixels in the level2.evt file, extra rows are filled as -1
| Pixel properties | Quadrant properties | ||||||
|---|---|---|---|---|---|---|---|
| Quadrant | DetID | PixID | Counts | Sigma | Mean | Median | Sigma |
| A | 15 | 127 | 81601 | 223.87 | 1493 | 1499 | 357.8 |
| A | 11 | 79 | 5219 | 10.4 | 1493 | 1499 | 357.8 |
| A | 3 | 111 | 4778 | 9.16 | 1493 | 1499 | 357.8 |
| B | 12 | 52 | 114428 | 308.99 | 1572 | 1577 | 365.2 |
| B | 15 | 22 | 59287 | 158.01 | 1572 | 1577 | 365.2 |
| B | 5 | 191 | 53806 | 143.01 | 1572 | 1577 | 365.2 |
| C | 15 | 241 | 251843 | 642.92 | 1411 | 1459 | 389.5 |
| C | 3 | 111 | 17210 | 40.44 | 1411 | 1459 | 389.5 |
| C | 3 | 79 | 15436 | 35.89 | 1411 | 1459 | 389.5 |
| D | 12 | 22 | 249110 | 591.42 | 1353 | 1401 | 418.8 |
| D | 10 | 84 | 92853 | 218.35 | 1353 | 1401 | 418.8 |
| D | 1 | 20 | 9318 | 18.9 | 1353 | 1401 | 418.8 |
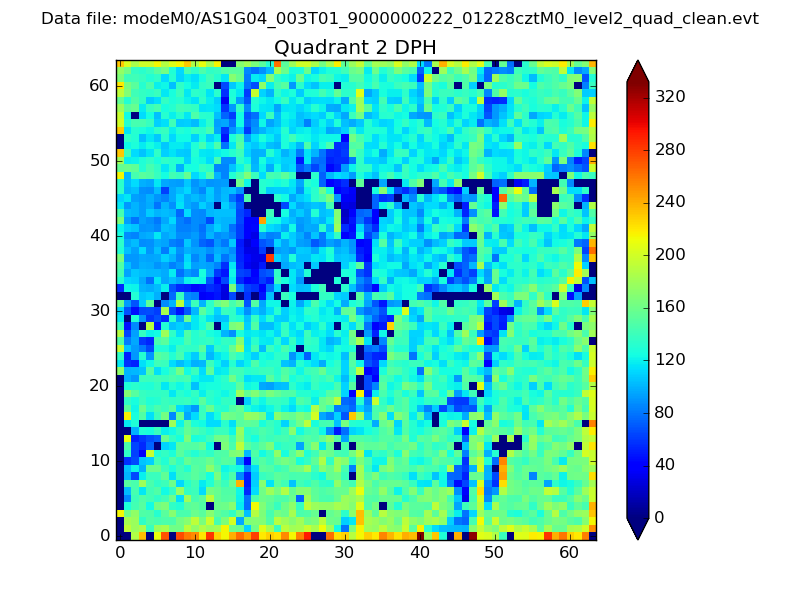
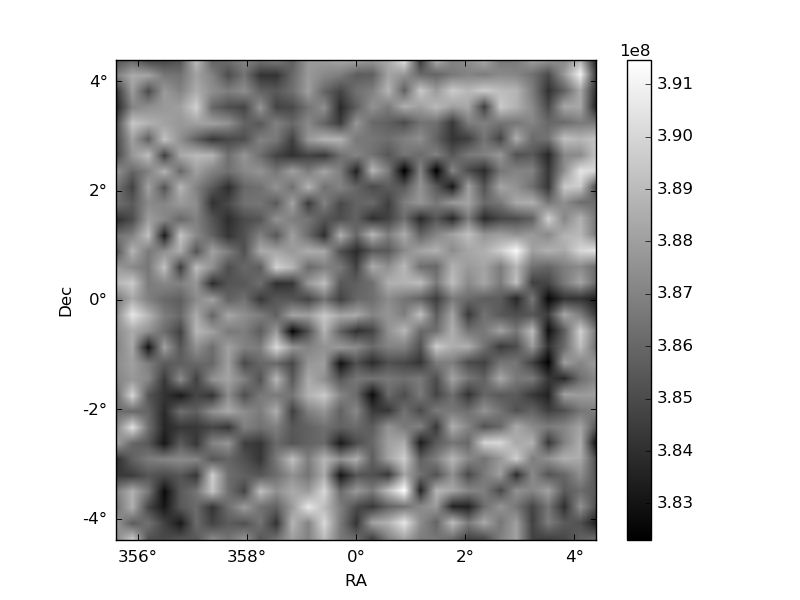
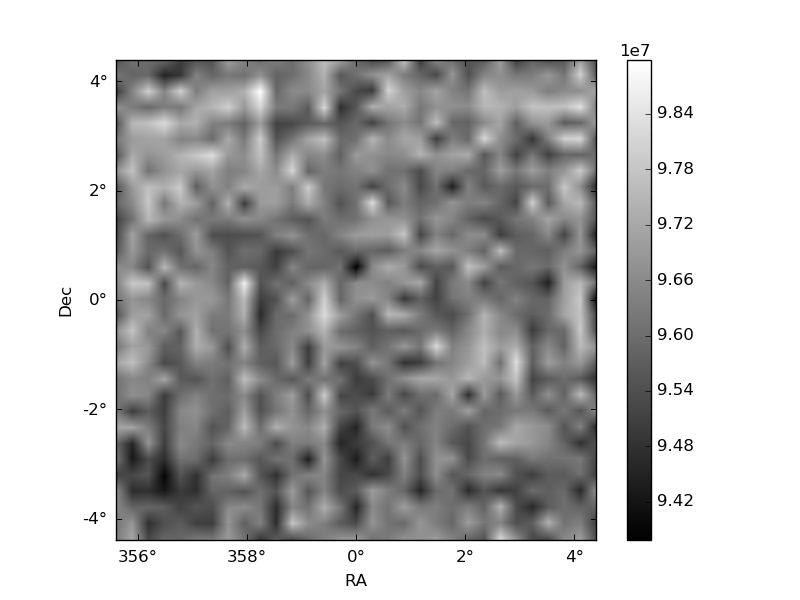
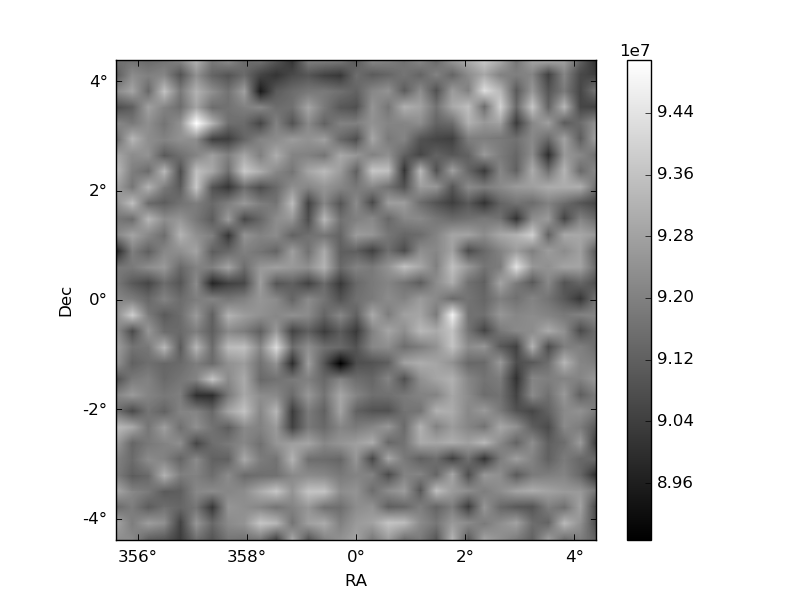
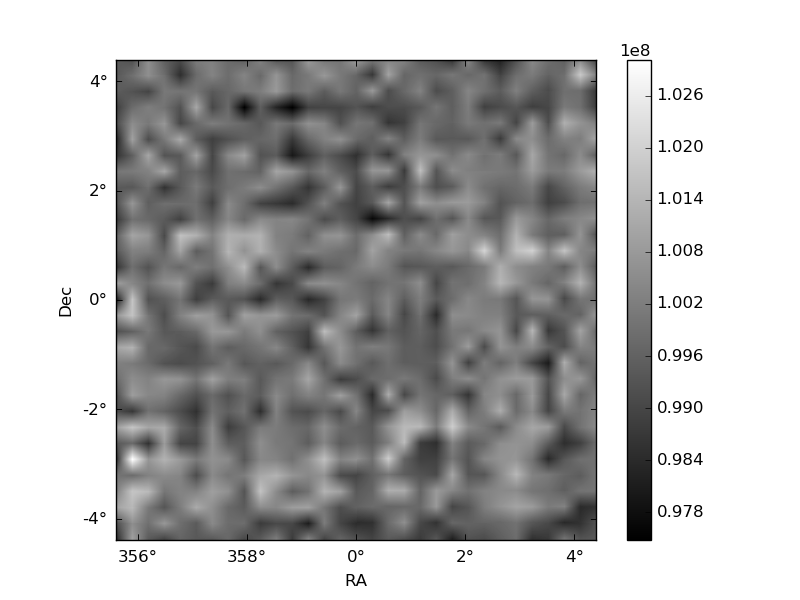
Histogram calculated using DETX and DETY for each event in the final _common_clean file
| Quadrant A | 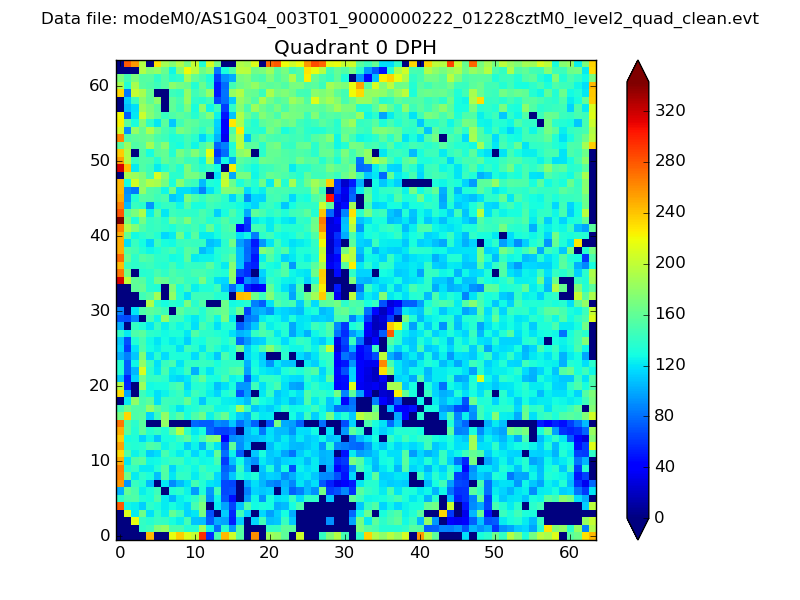 |
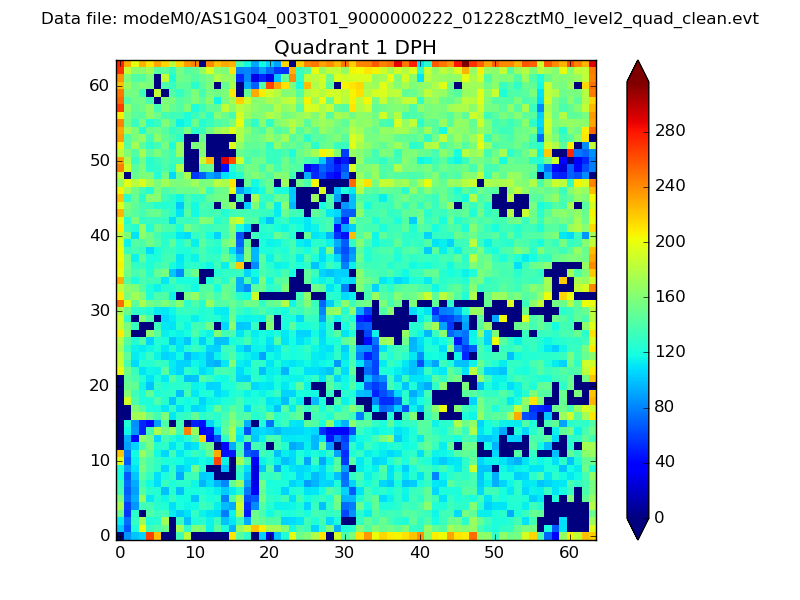 |
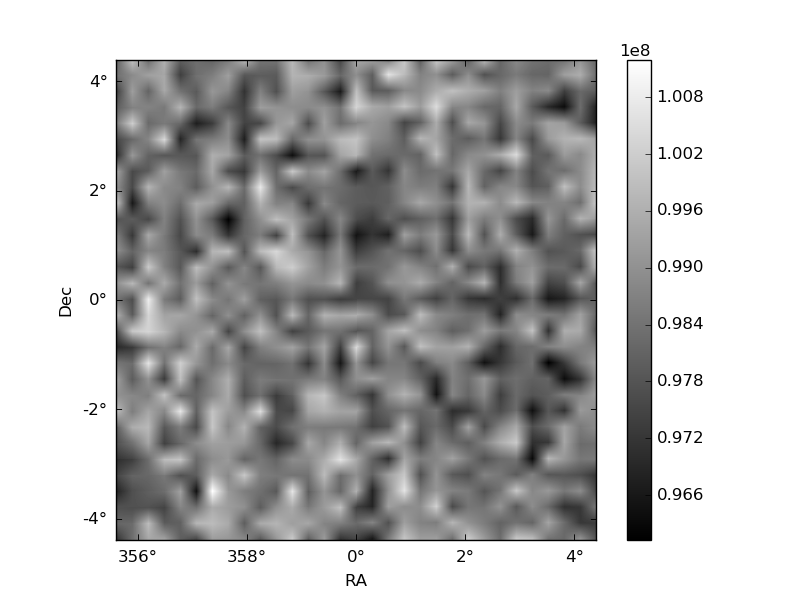
Quadrant B |
|---|---|---|---|
| Quadrant D | 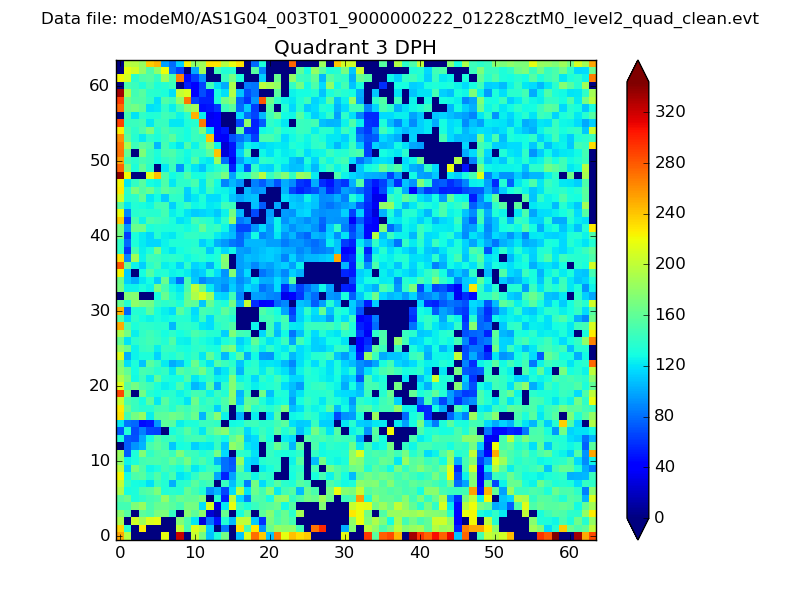 |
 |
Quadrant C |
| Plot type | Count rate plots | Images |
|---|---|---|
| Comparison with Poisson distribution Blue bars denote a histogram of data divided into 1 sec bins. Red curve is a Poisson curve with rate = median count rate of data. |
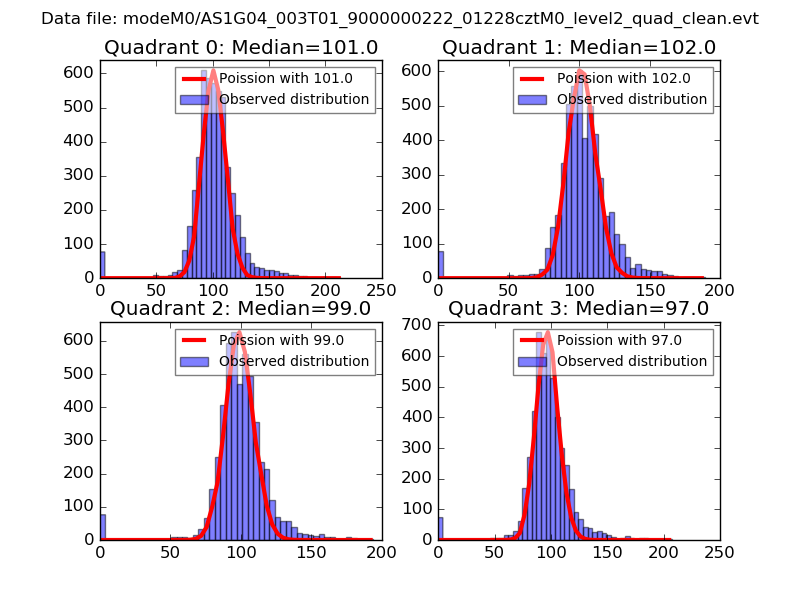 |
 |
| Quadrant-wise count rates Data is divided into 100 sec bins |
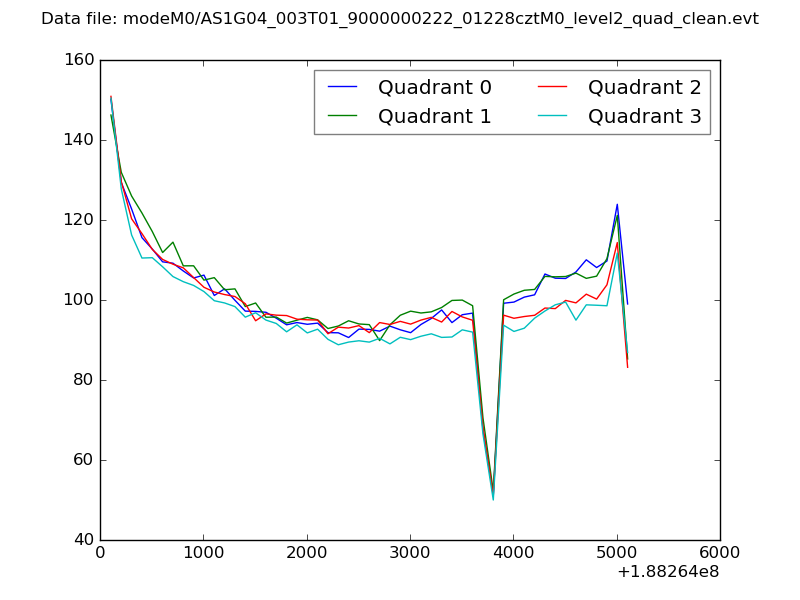 |
|
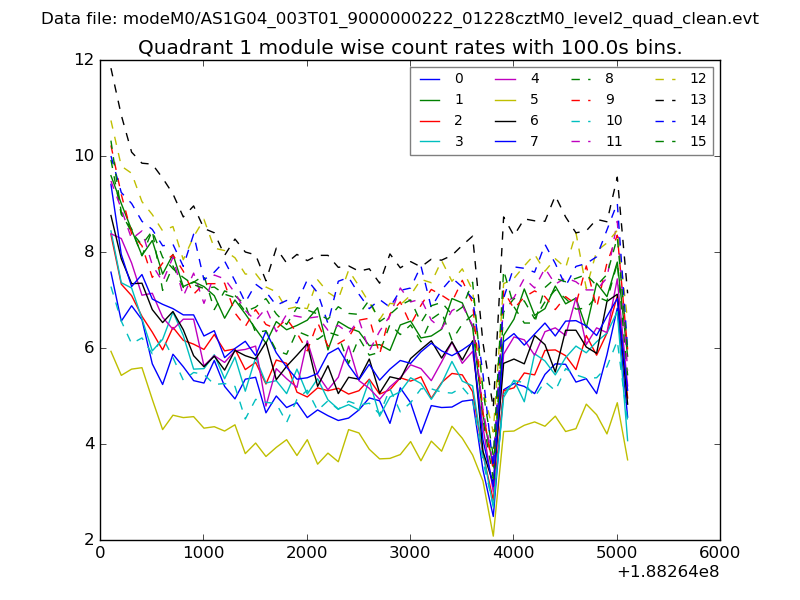
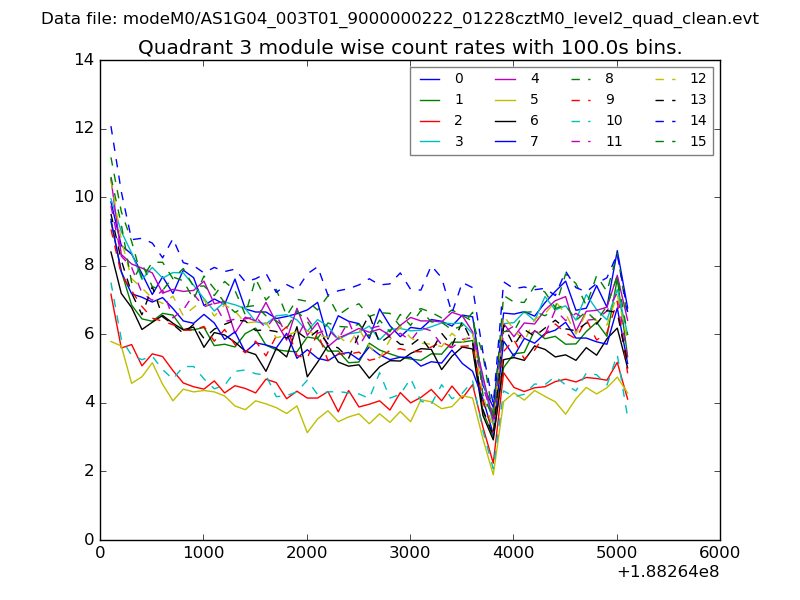
| Module-wise count rates for Quadrant A Data is divided into 100 sec bins |
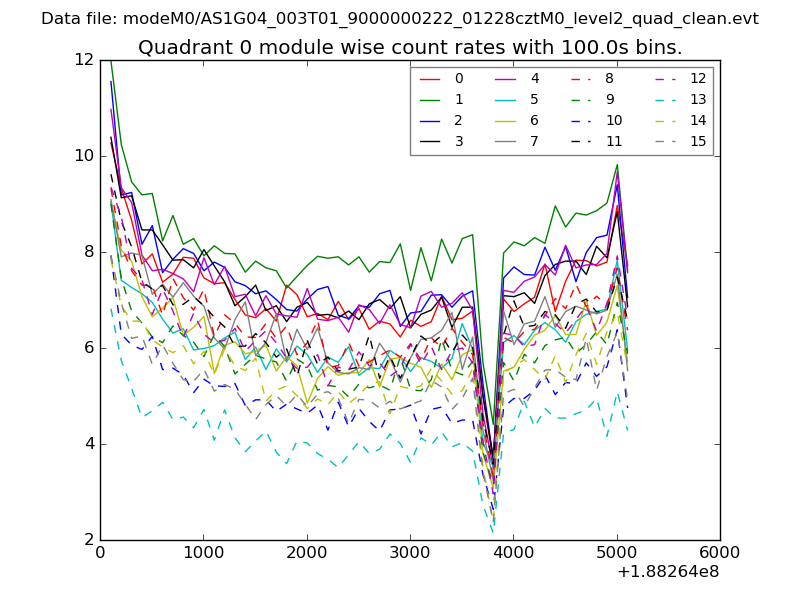 |
 |
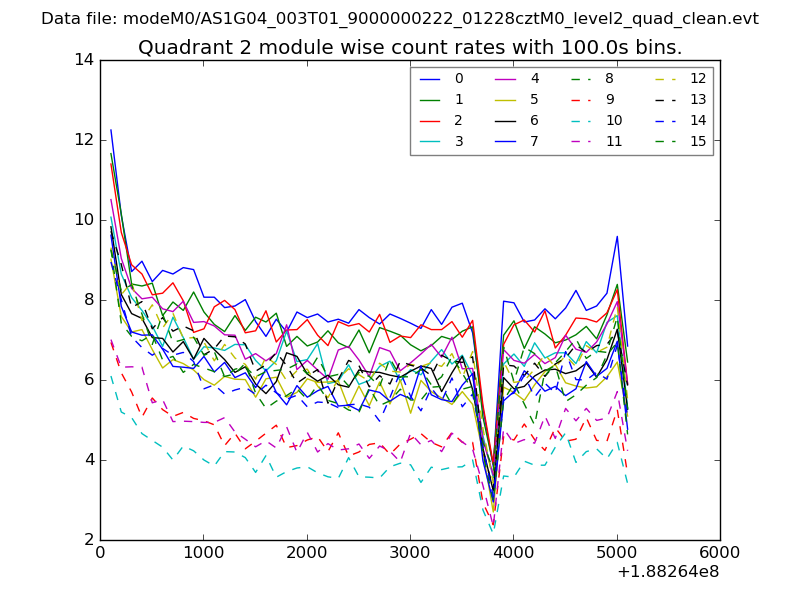
| Module-wise count rates for Quadrant B Data is divided into 100 sec bins |
 |
 |
| Module-wise count rates for Quadrant C Data is divided into 100 sec bins |
 |
 |
| Module-wise count rates for Quadrant D Data is divided into 100 sec bins |
 |
 |
| Parameter | Plot |
|---|---|
| CZT HV Monitor | 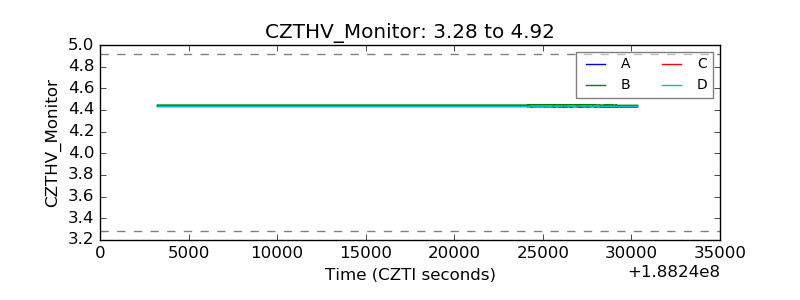 |
| D_VDD | 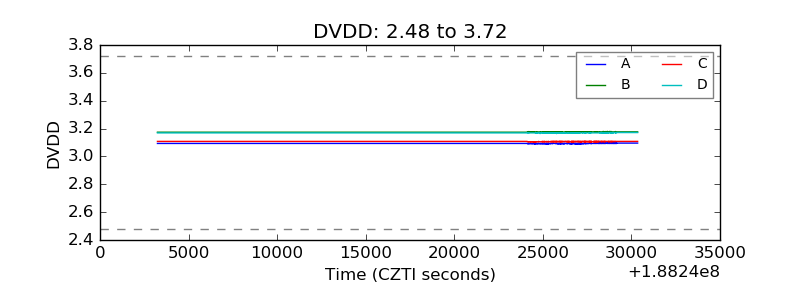 |
| Temperature 1 | 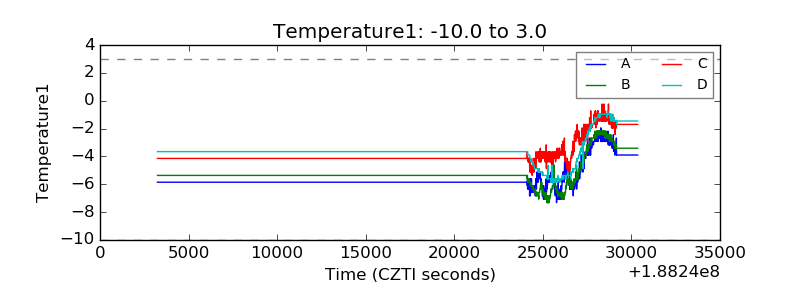 |
| Veto HV Monitor | 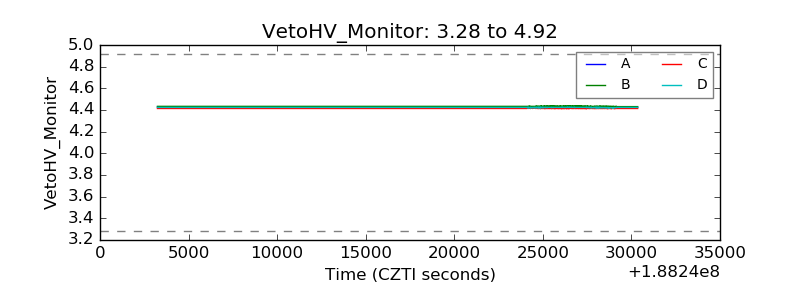 |
| Veto LLD | 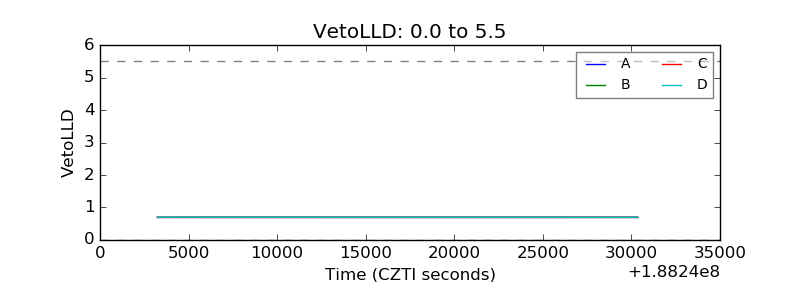 |
| Alpha Counter | 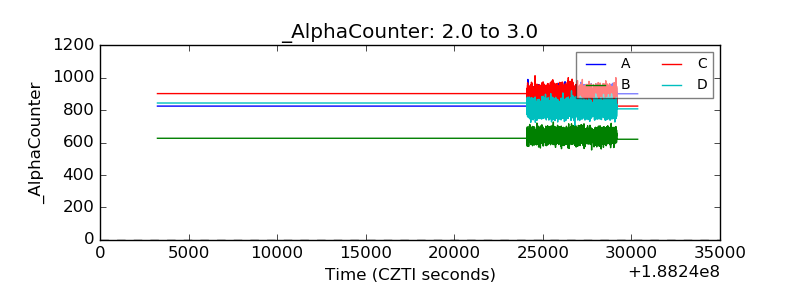 |
| _CPM_Rate | 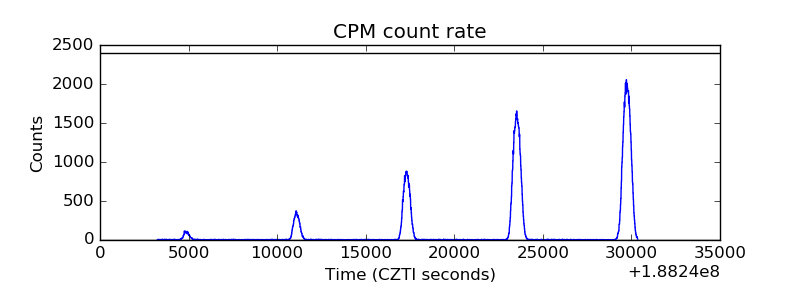 |
| CZT Counter | 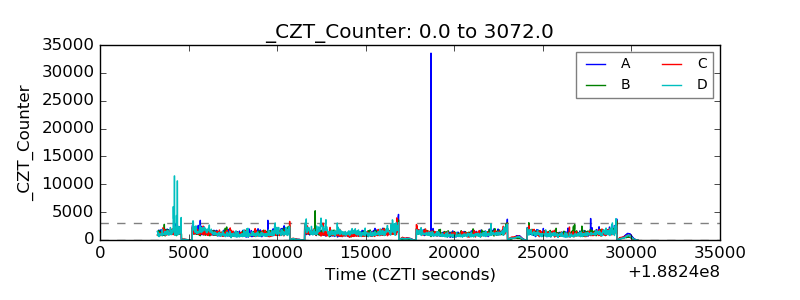 |
| +2.5 Volts monitor |  |
| +5 Volts monitor | 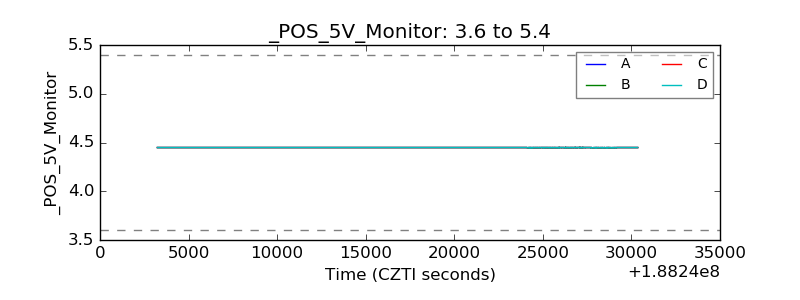 |
| _ROLL_ROT | 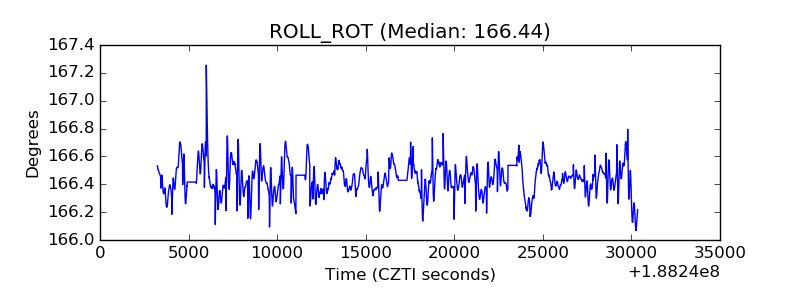 |
| _Roll_DEC | 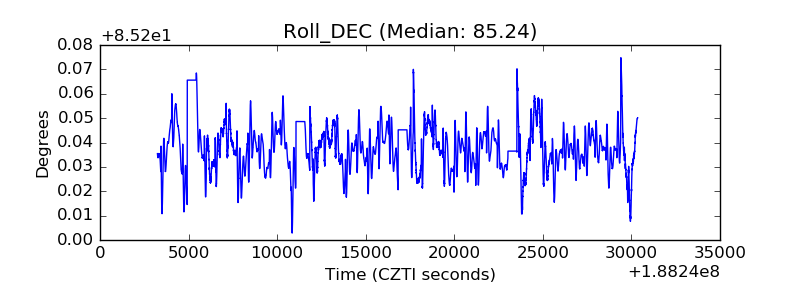 |
| _Roll_RA | 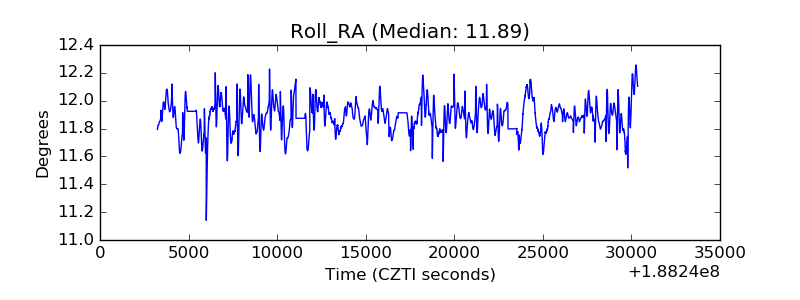 |
| Veto Counter | 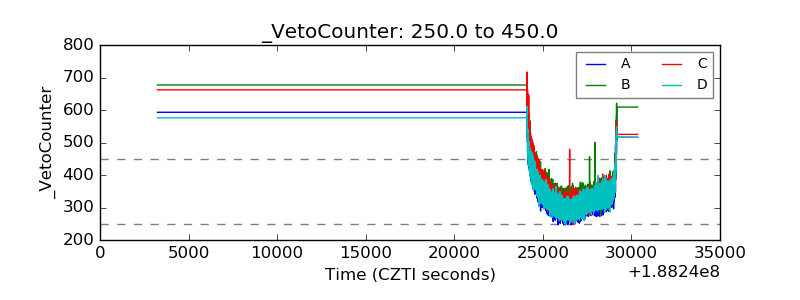 |