| Param | Original file | Final file |
|---|---|---|
| Filename | modeM0/AS1G04_003T02_9000000224cztM0_level2.fits | modeM0/AS1G04_003T02_9000000224cztM0_level2_quad_clean.evt |
| Size (bytes) | 242,038,080 | 343,630,080 |
| Size | 230.8 MB | 327.7 MB |
| Events in quadrant A | 1,419,182 | 2,248,677 |
| Events in quadrant B | 1,395,332 | 2,254,660 |
| Events in quadrant C | 1,356,378 | 2,084,282 |
| Events in quadrant D | 1,156,554 | 1,818,223 |
| Mode M9 | |||
|---|---|---|---|
| Quadrant | BADHDUFLAG | Total packets | Discarded packets |
| A | 0 | 52 | 0 |
| B | 0 | 52 | 0 |
| C | 0 | 52 | 0 |
| D | 0 | 52 | 0 |
| Mode M0 | |||
|---|---|---|---|
| Quadrant | BADHDUFLAG | Total packets | Discarded packets |
| A | 0 | 123916 | 0 |
| B | 0 | 128231 | 0 |
| C | 0 | 122601 | 0 |
| D | 0 | 128420 | 0 |
| Mode SS | |||
|---|---|---|---|
| Quadrant | BADHDUFLAG | Total packets | Discarded packets |
| A | 0 | 590 | 0 |
| B | 0 | 590 | 0 |
| C | 0 | 590 | 0 |
| D | 0 | 590 | 0 |
| Quadrant | Total seconds | Saturated seconds | Saturation percentage |
|---|---|---|---|
| A | 29130 | 174 | 0.597322% |
| B | 29130 | 186 | 0.638517% |
| C | 29130 | 109 | 0.374185% |
| D | 29128 | 1527 | 5.242378% |
Noise dominated data is calculated using 1-second bins in cleaned event files. If a bin has >2000 counts, and if more than 50% of those come from <1% of pixels, then it is considered to be noise-dominated and hence unusable.
| Quadrant | # 1 sec bins | Bins with >0 counts | Bins with >2000 counts | High rate bins dominated by noise | Noise dominated (total time) | Noise dominated (detector-on time) | Marked lightcurve |
|---|---|---|---|---|---|---|---|
| A | 34206 | 29126 | 0 | 0 | 0.00% | 0.00% | 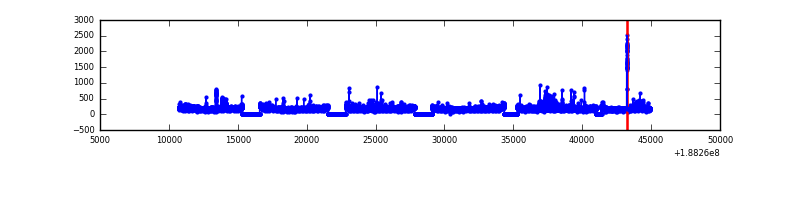 |
| B | 34206 | 29128 | 0 | 0 | 0.00% | 0.00% | 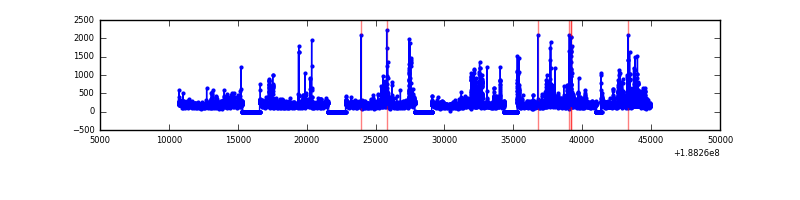 |
| C | 34205 | 29127 | 0 | 0 | 0.00% | 0.00% | 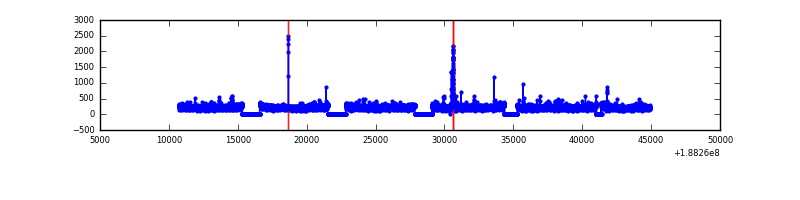 |
| D | 34205 | 29125 | 0 | 0 | 0.00% | 0.00% | 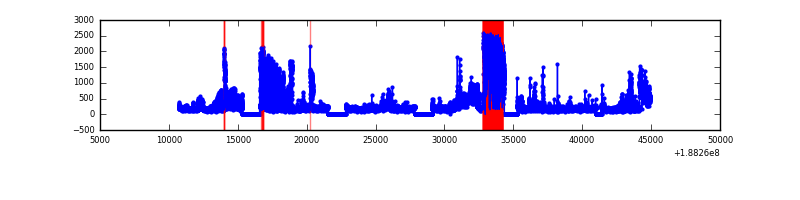 |
Top three noisy pixels from each quadrant. If the there are fewer than three noisy pixels in the level2.evt file, extra rows are filled as -1
| Pixel properties | Quadrant properties | ||||||
|---|---|---|---|---|---|---|---|
| Quadrant | DetID | PixID | Counts | Sigma | Mean | Median | Sigma |
| A | 7 | 110 | 1320 | 11.3 | 367 | 345 | 86.3 |
| A | 0 | 29 | 1301 | 11.08 | 367 | 345 | 86.3 |
| A | 14 | 188 | 1069 | 8.39 | 367 | 345 | 86.3 |
| B | 2 | 9 | 1126 | 11.44 | 369 | 354 | 67.5 |
| B | 14 | 254 | 937 | 8.64 | 369 | 354 | 67.5 |
| B | 14 | 253 | 848 | 7.32 | 369 | 354 | 67.5 |
| C | 9 | 242 | 929 | 6.7 | 359 | 333 | 89.0 |
| C | 1 | 81 | 891 | 6.27 | 359 | 333 | 89.0 |
| C | 2 | 191 | 882 | 6.17 | 359 | 333 | 89.0 |
| D | 11 | 82 | 855 | 6.99 | 330 | 302 | 79.1 |
| D | 6 | 44 | 845 | 6.87 | 330 | 302 | 79.1 |
| D | 6 | 231 | 832 | 6.7 | 330 | 302 | 79.1 |
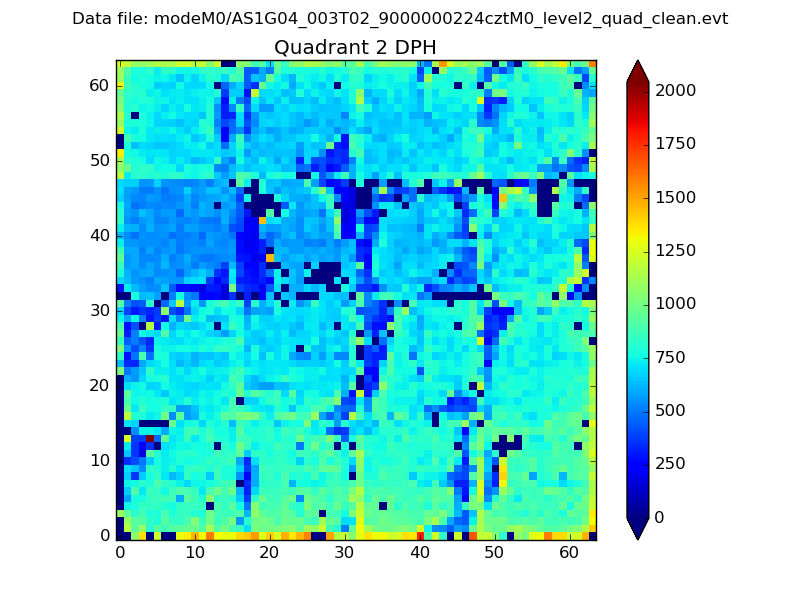
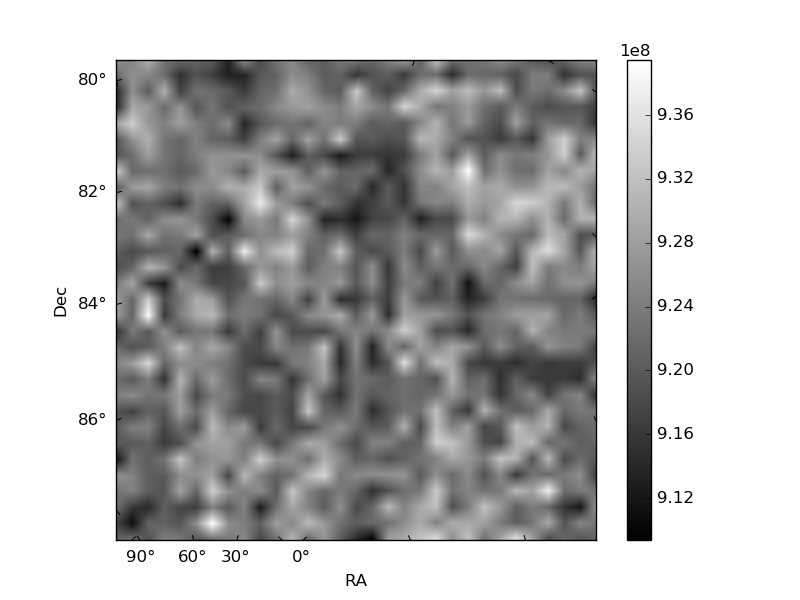
Histogram calculated using DETX and DETY for each event in the final _common_clean file
| Quadrant A | 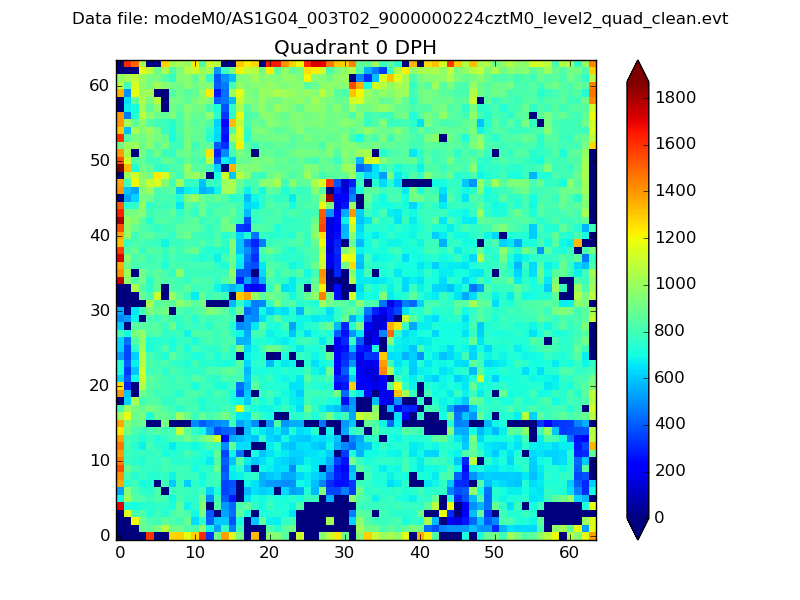 |
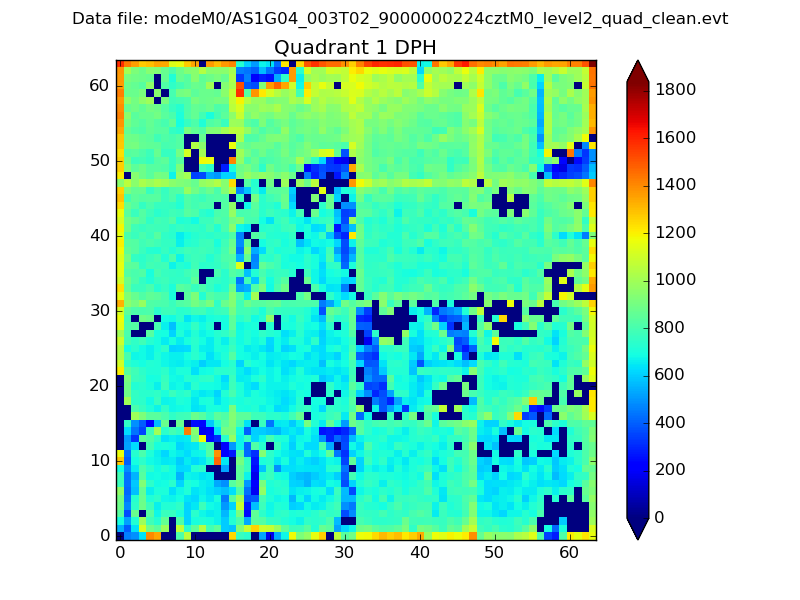 |
Quadrant B |
|---|---|---|---|
| Quadrant D | 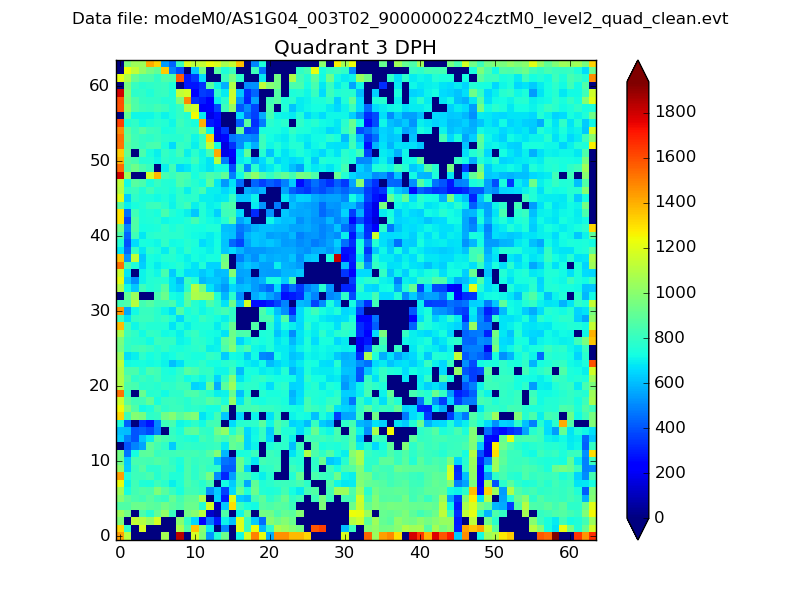 |
 |
Quadrant C |
| Plot type | Count rate plots | Images |
|---|---|---|
| Comparison with Poisson distribution Blue bars denote a histogram of data divided into 1 sec bins. Red curve is a Poisson curve with rate = median count rate of data. |
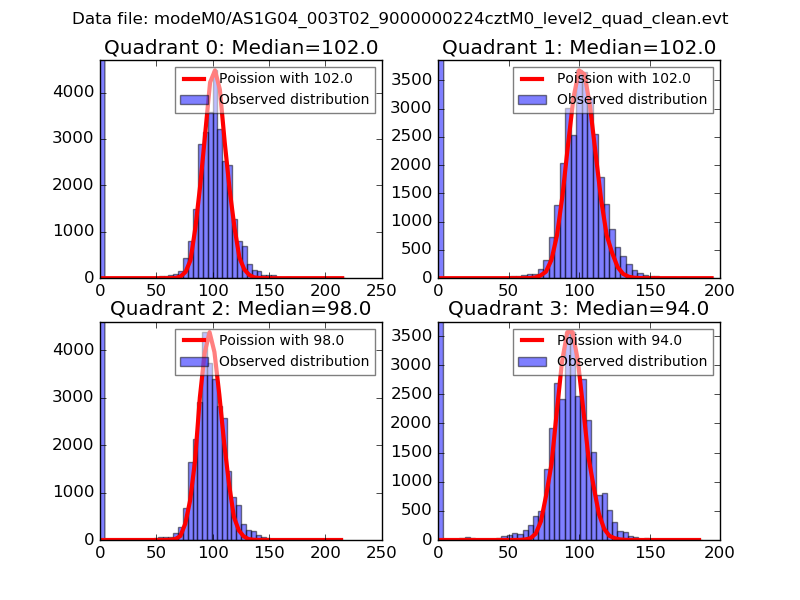 |
 |
| Quadrant-wise count rates Data is divided into 100 sec bins |
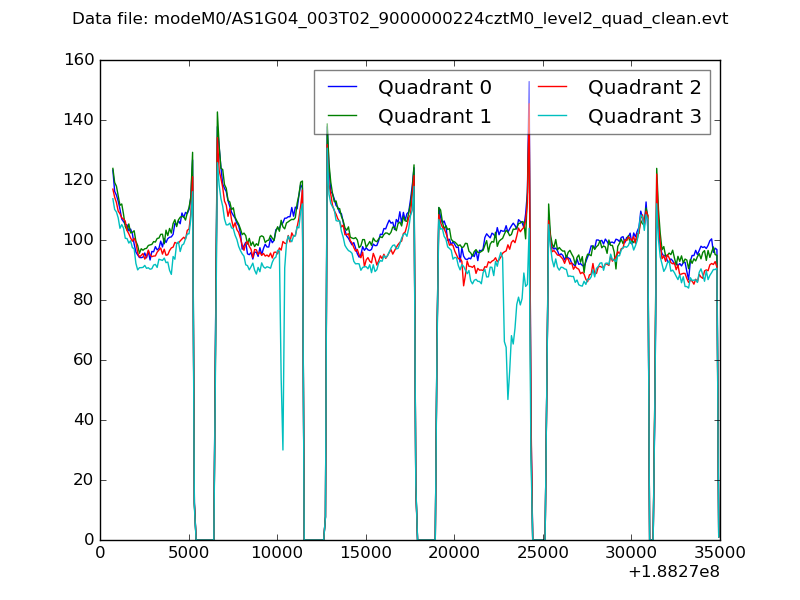 |
|
| Module-wise count rates for Quadrant A Data is divided into 100 sec bins |
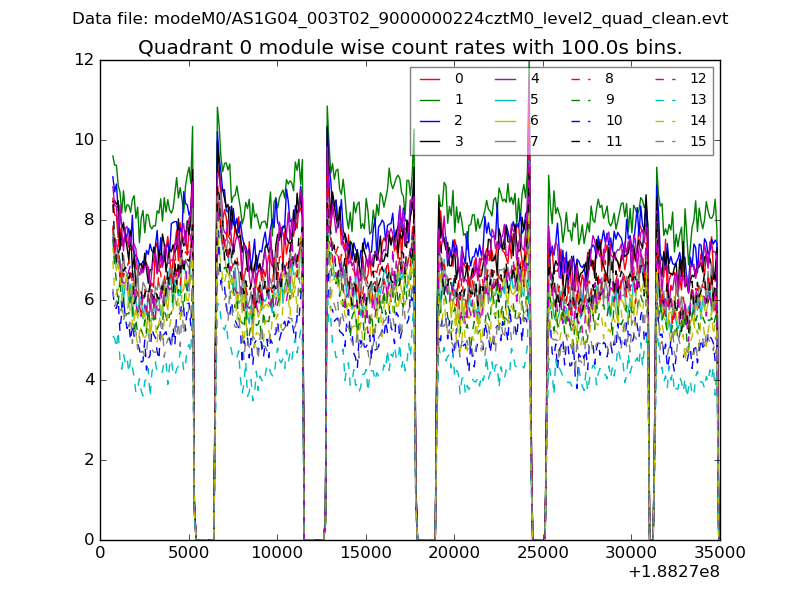 |
 |
| Module-wise count rates for Quadrant B Data is divided into 100 sec bins |
 |
 |
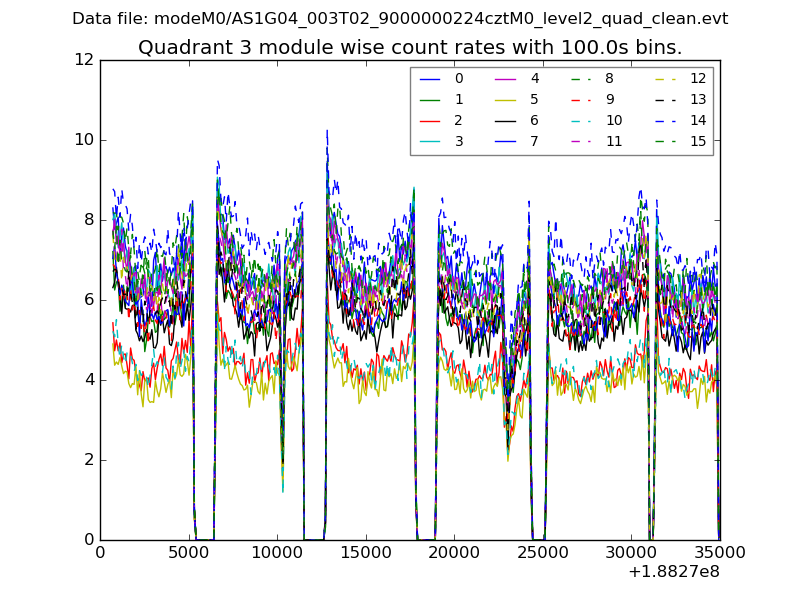
| Module-wise count rates for Quadrant C Data is divided into 100 sec bins |
 |
 |
| Module-wise count rates for Quadrant D Data is divided into 100 sec bins |
 |
 |
| Parameter | Plot |
|---|---|
| CZT HV Monitor |  |
| D_VDD | 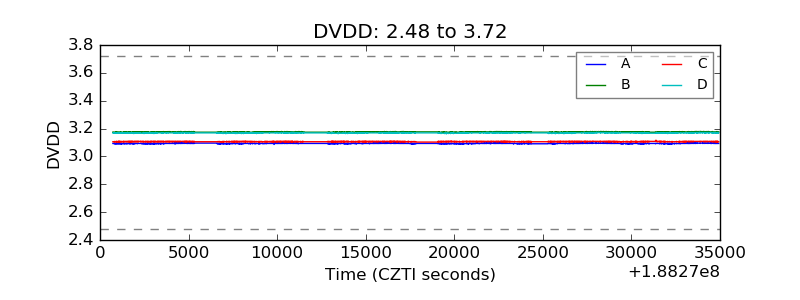 |
| Temperature 1 |  |
| Veto HV Monitor | 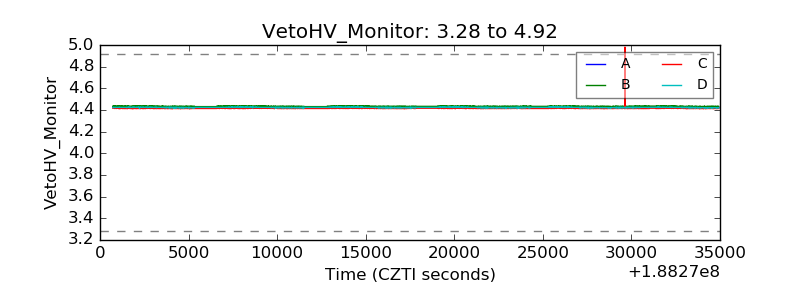 |
| Veto LLD | 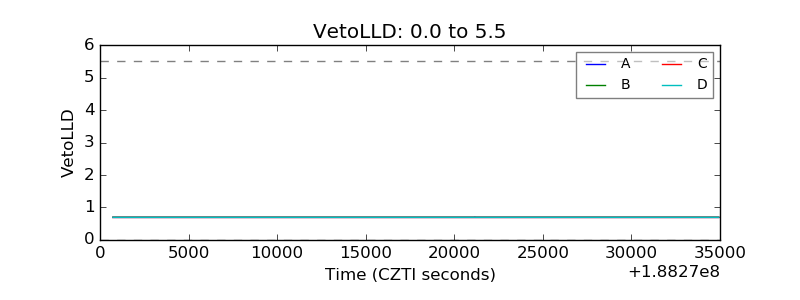 |
| Alpha Counter | 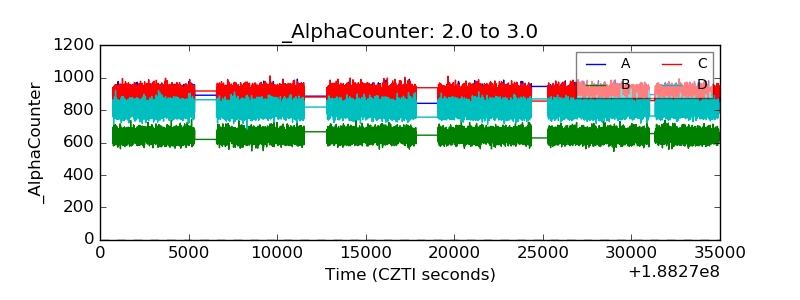 |
| _CPM_Rate | 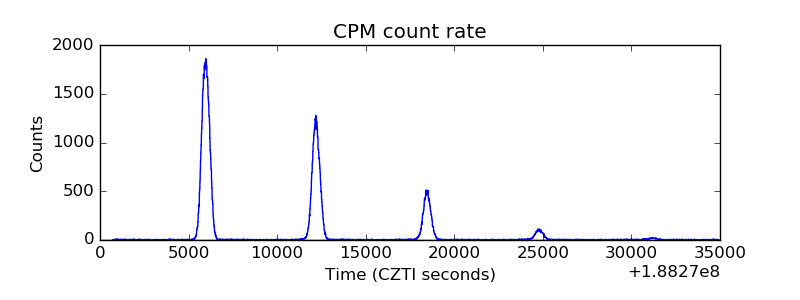 |
| CZT Counter | 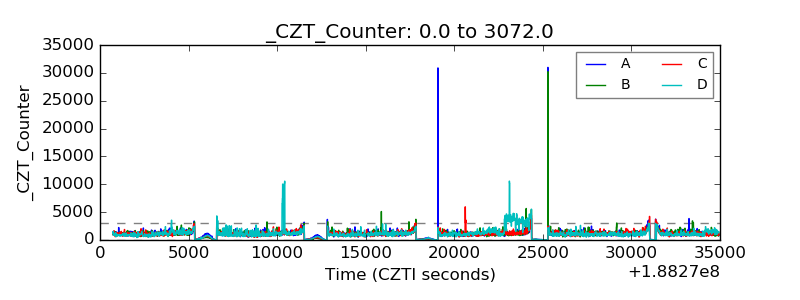 |
| +2.5 Volts monitor | 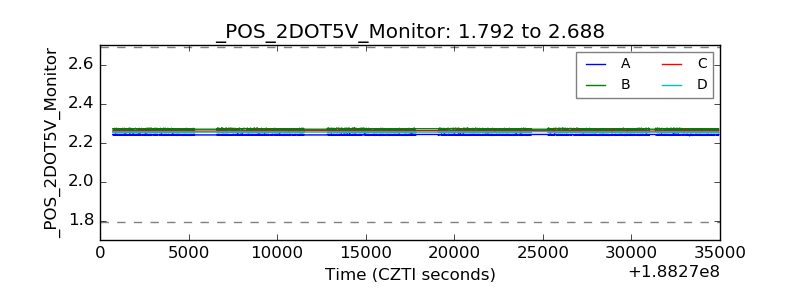 |
| +5 Volts monitor |  |
| _ROLL_ROT | 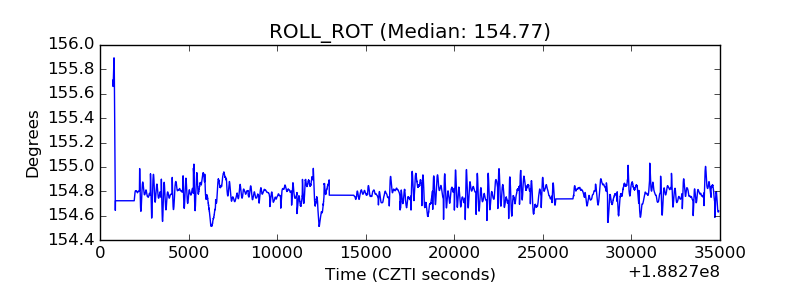 |
| _Roll_DEC | 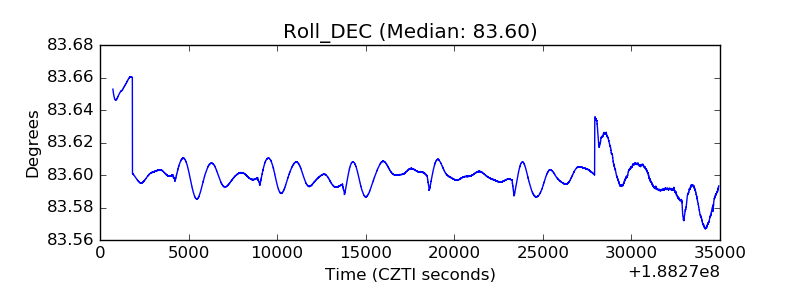 |
| _Roll_RA | 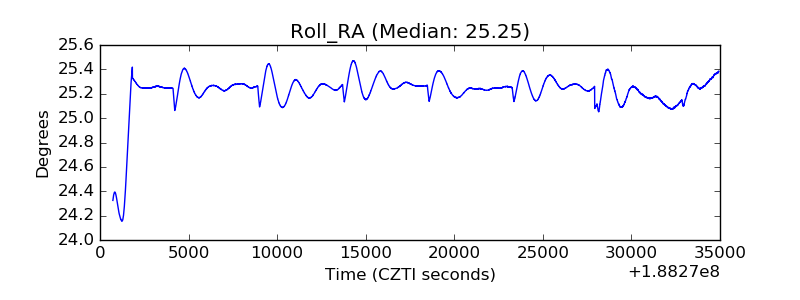 |
| Veto Counter |  |