| Param | Original file | Final file |
|---|---|---|
| Filename | modeM0/AS1G04_003T02_9000000224_01228cztM0_level2.evt | modeM0/AS1G04_003T02_9000000224_01228cztM0_level2_quad_clean.evt |
| Size (bytes) | 173,496,960 | 20,217,600 |
| Size | 165.5 MB | 19.3 MB |
| Events in quadrant A | 1,310,439 | 131,600 |
| Events in quadrant B | 1,411,089 | 133,603 |
| Events in quadrant C | 1,334,141 | 129,502 |
| Events in quadrant D | 1,115,156 | 126,018 |
| Mode M0 | |||
|---|---|---|---|
| Quadrant | BADHDUFLAG | Total packets | Discarded packets |
| A | 0 | 4748 | 1 |
| B | 0 | 5065 | 0 |
| C | 0 | 4836 | 0 |
| D | 0 | 4178 | 0 |
| Mode SS | |||
|---|---|---|---|
| Quadrant | BADHDUFLAG | Total packets | Discarded packets |
| A | 0 | 24 | 0 |
| B | 0 | 24 | 0 |
| C | 0 | 24 | 0 |
| D | 0 | 24 | 0 |
| Quadrant | Total seconds | Saturated seconds | Saturation percentage |
|---|---|---|---|
| A | 1207 | 0 | 0.000000% |
| B | 1207 | 1 | 0.082850% |
| C | 1207 | 0 | 0.000000% |
| D | 1207 | 0 | 0.000000% |
Noise dominated data is calculated using 1-second bins in cleaned event files. If a bin has >2000 counts, and if more than 50% of those come from <1% of pixels, then it is considered to be noise-dominated and hence unusable.
| Quadrant | # 1 sec bins | Bins with >0 counts | Bins with >2000 counts | High rate bins dominated by noise | Noise dominated (total time) | Noise dominated (detector-on time) | Marked lightcurve |
|---|---|---|---|---|---|---|---|
| A | 1207 | 1207 | 9 | 9 | 0.75% | 0.75% | 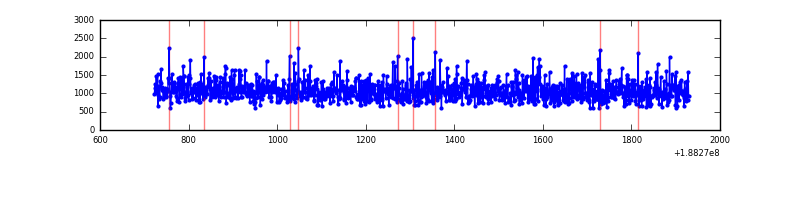 |
| B | 1207 | 1207 | 16 | 16 | 1.33% | 1.33% | 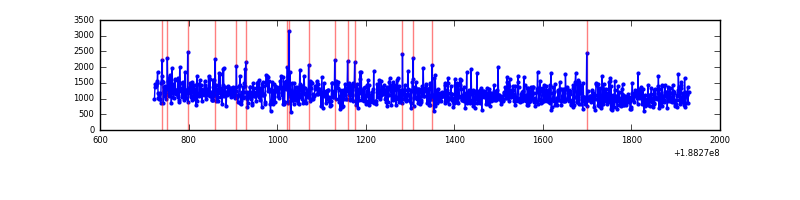 |
| C | 1207 | 1207 | 8 | 8 | 0.66% | 0.66% | 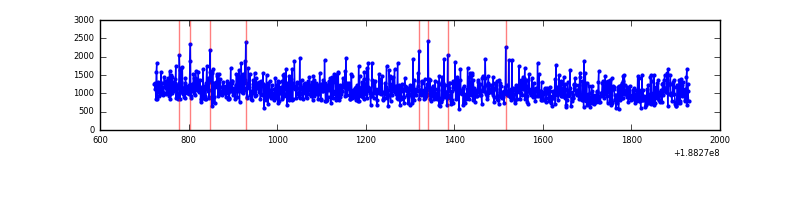 |
| D | 1207 | 1207 | 0 | 0 | 0.00% | 0.00% | 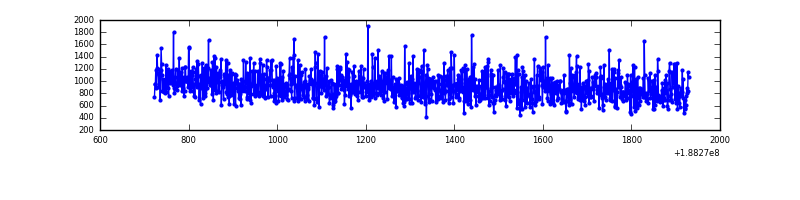 |
Top three noisy pixels from each quadrant. If the there are fewer than three noisy pixels in the level2.evt file, extra rows are filled as -1
| Pixel properties | Quadrant properties | ||||||
|---|---|---|---|---|---|---|---|
| Quadrant | DetID | PixID | Counts | Sigma | Mean | Median | Sigma |
| A | 3 | 80 | 21220 | 259.4 | 335 | 338 | 80.5 |
| A | 13 | 9 | 1436 | 13.64 | 335 | 338 | 80.5 |
| A | 11 | 79 | 1225 | 11.02 | 335 | 338 | 80.5 |
| B | 0 | 190 | 3267 | 33.4 | 369 | 369 | 86.8 |
| B | 5 | 191 | 2880 | 28.94 | 369 | 369 | 86.8 |
| B | 10 | 16 | 2594 | 25.64 | 369 | 369 | 86.8 |
| C | 15 | 241 | 60829 | 665.43 | 324 | 335 | 90.9 |
| C | 3 | 111 | 3203 | 31.55 | 324 | 335 | 90.9 |
| C | 3 | 79 | 1478 | 12.57 | 324 | 335 | 90.9 |
| D | 12 | 22 | 3364 | 33.0 | 295 | 302 | 92.8 |
| D | 1 | 20 | 2488 | 23.56 | 295 | 302 | 92.8 |
| D | 13 | 189 | 2021 | 18.53 | 295 | 302 | 92.8 |
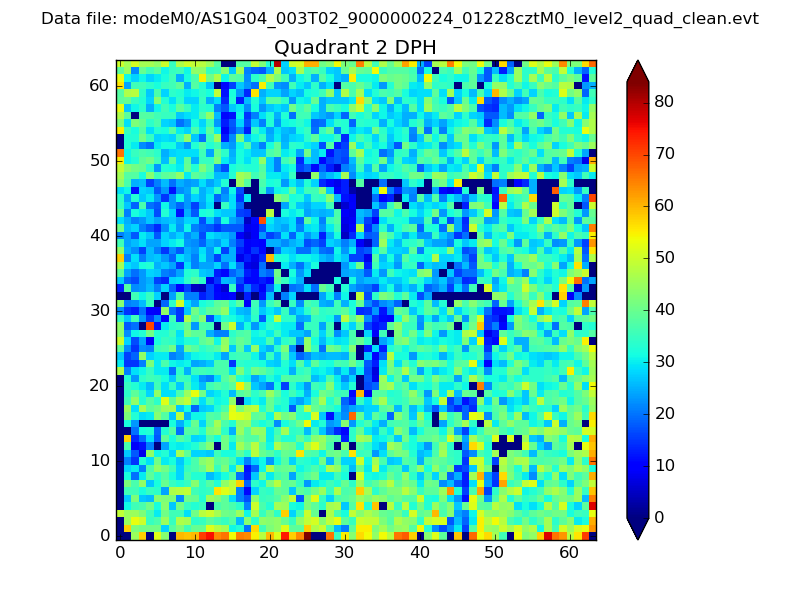
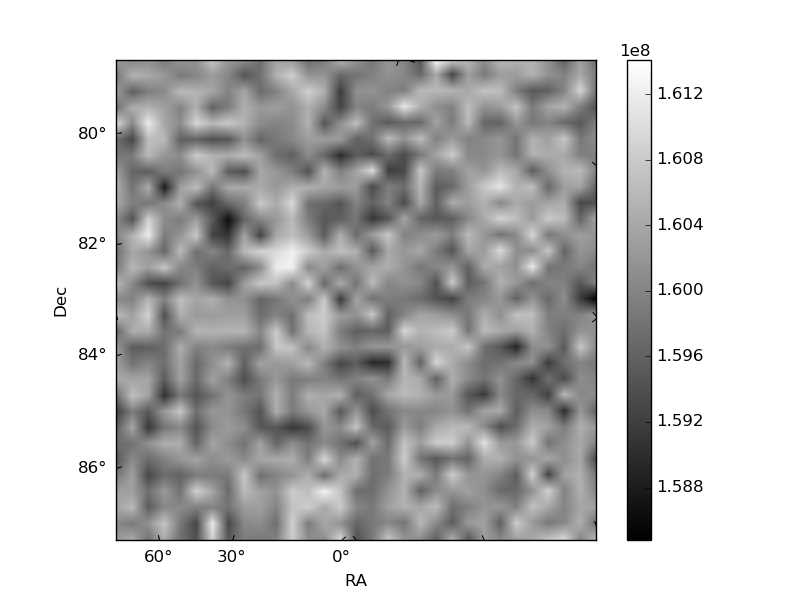
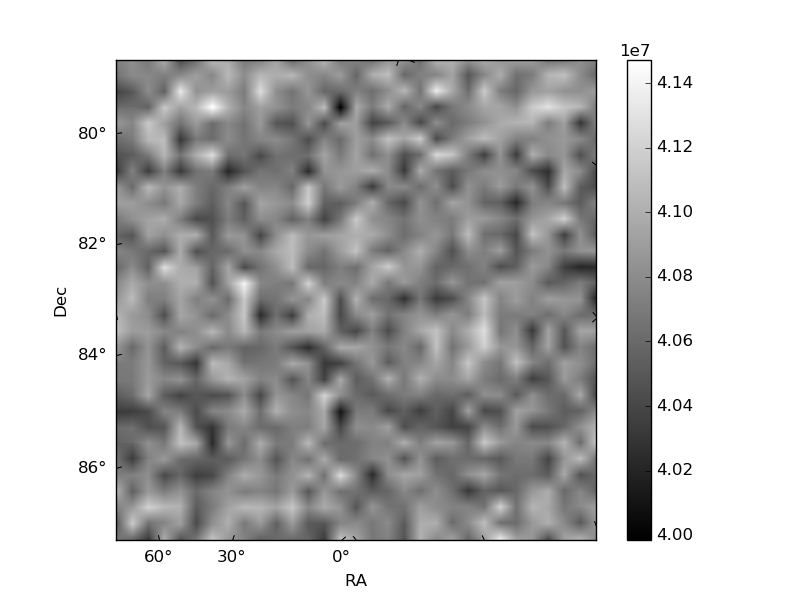
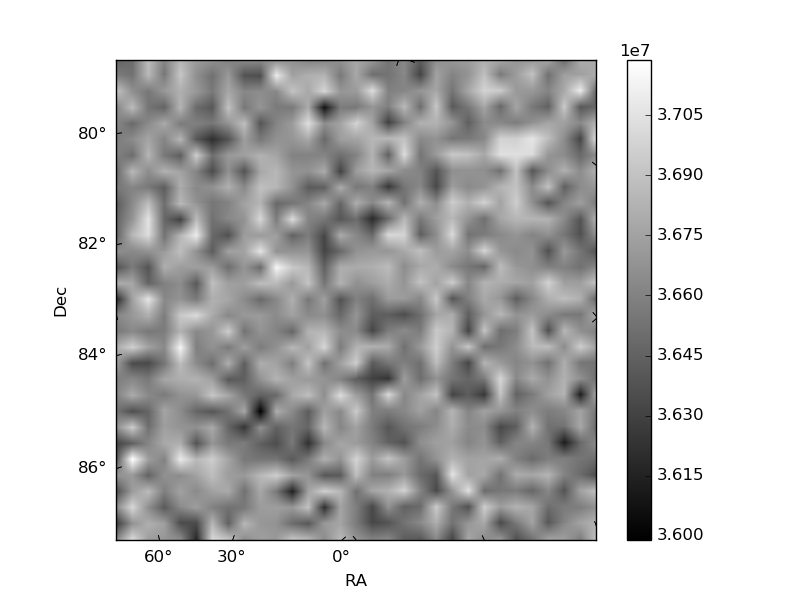
Histogram calculated using DETX and DETY for each event in the final _common_clean file
| Quadrant A | 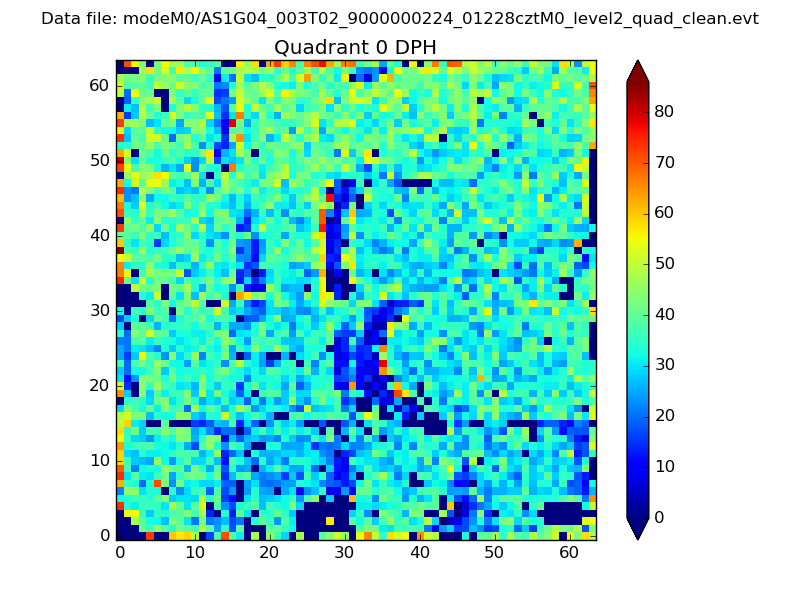 |
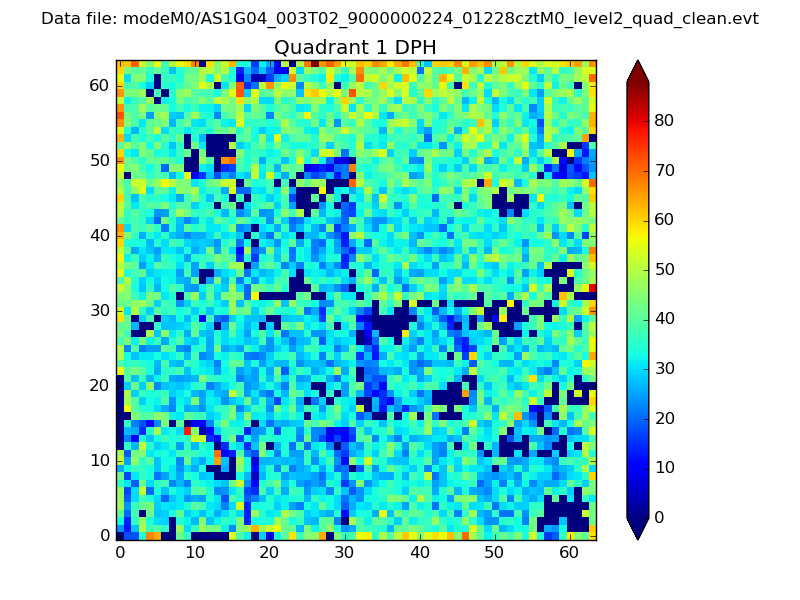 |
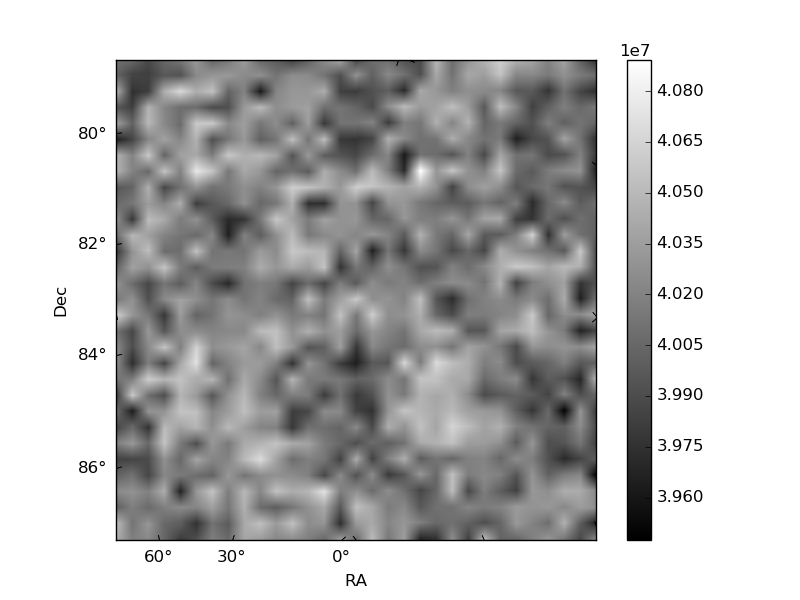
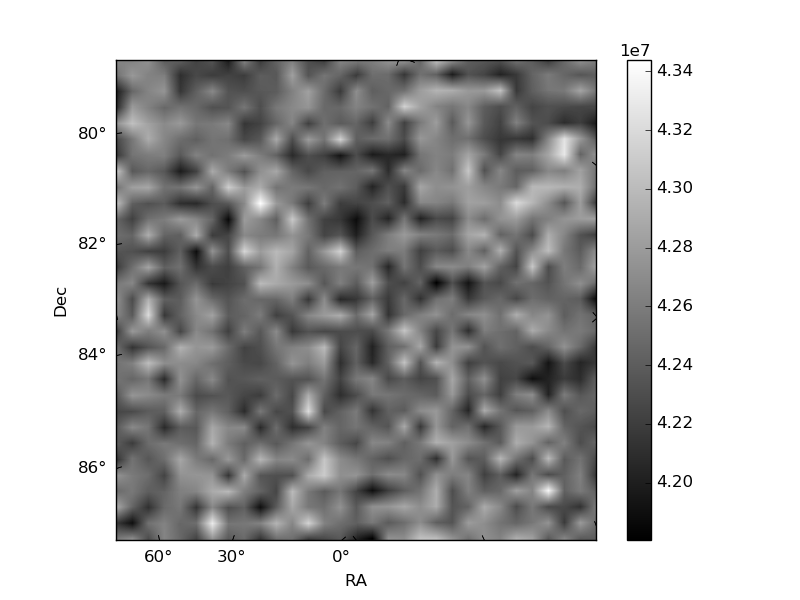
Quadrant B |
|---|---|---|---|
| Quadrant D | 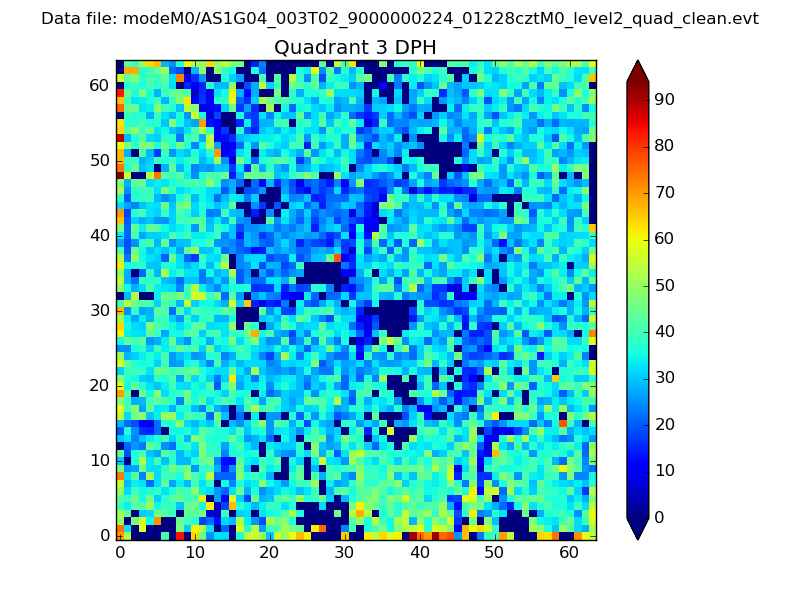 |
 |
Quadrant C |
| Plot type | Count rate plots | Images |
|---|---|---|
| Comparison with Poisson distribution Blue bars denote a histogram of data divided into 1 sec bins. Red curve is a Poisson curve with rate = median count rate of data. |
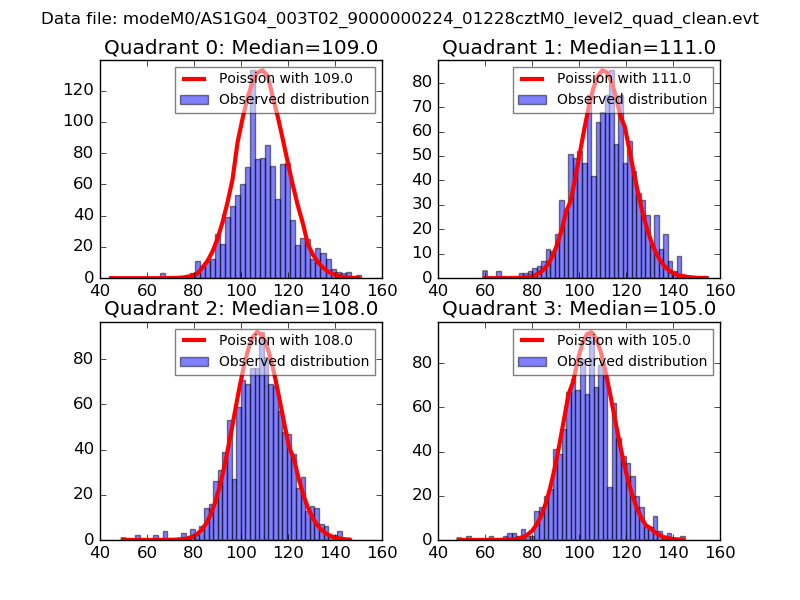 |
 |
| Quadrant-wise count rates Data is divided into 100 sec bins |
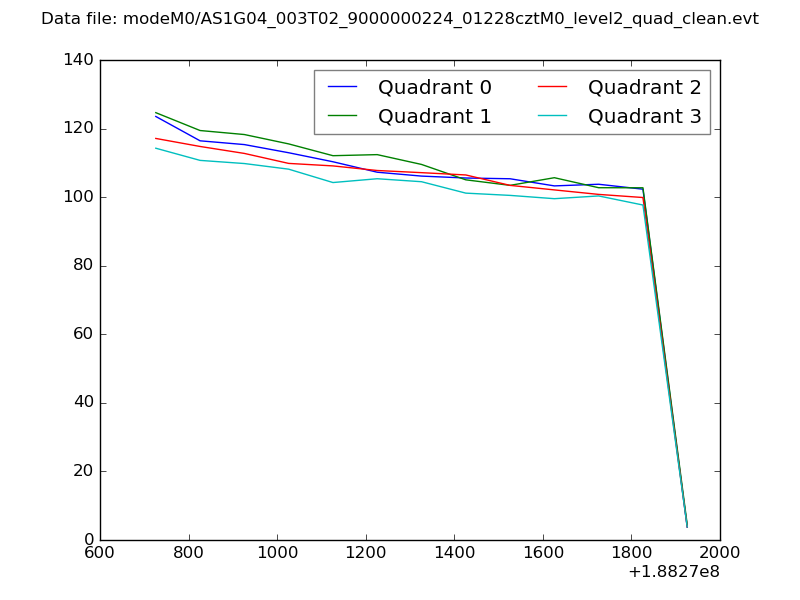 |
|
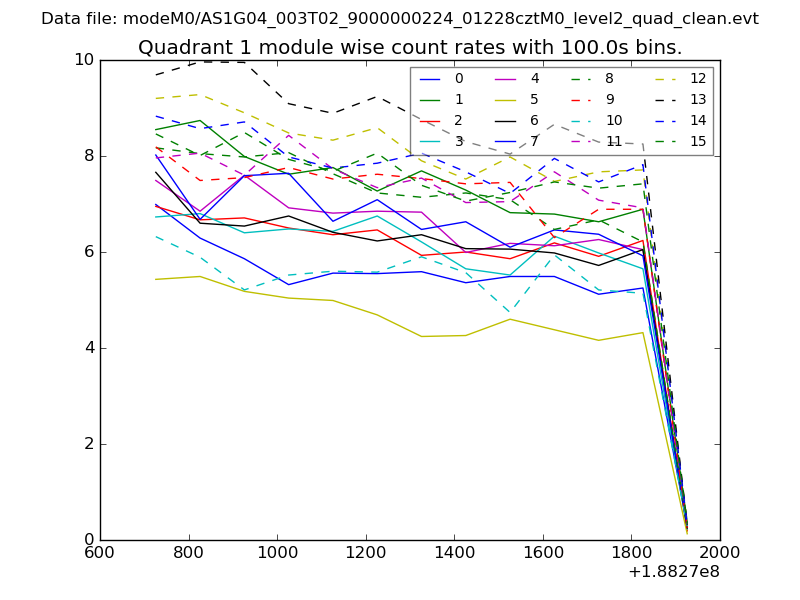
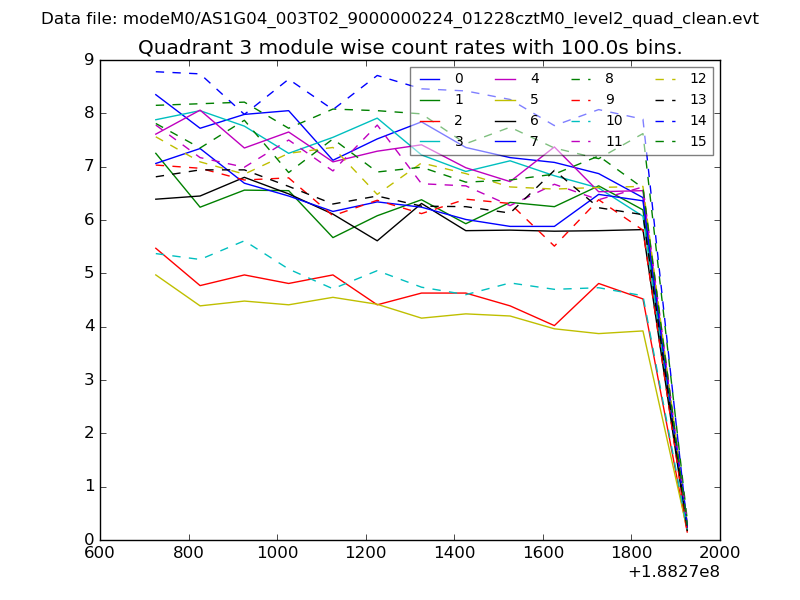
| Module-wise count rates for Quadrant A Data is divided into 100 sec bins |
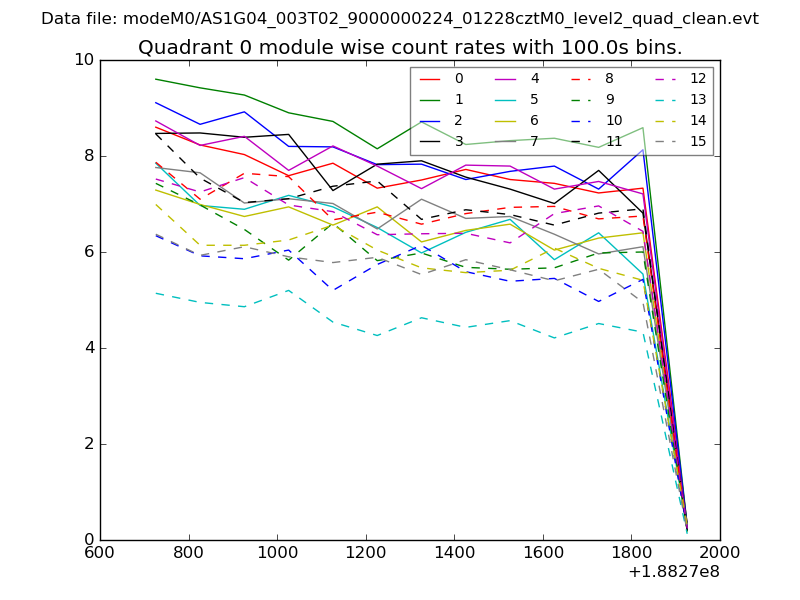 |
 |
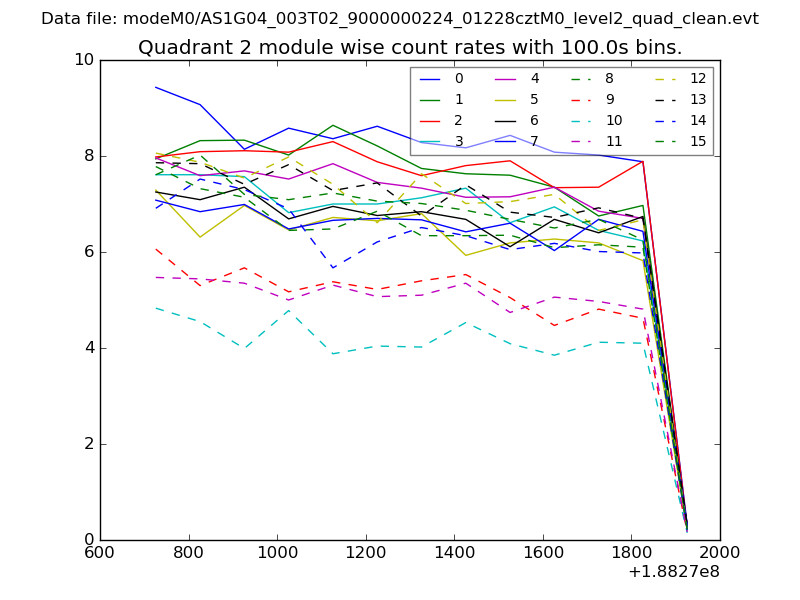
| Module-wise count rates for Quadrant B Data is divided into 100 sec bins |
 |
 |
| Module-wise count rates for Quadrant C Data is divided into 100 sec bins |
 |
 |
| Module-wise count rates for Quadrant D Data is divided into 100 sec bins |
 |
 |
| Parameter | Plot |
|---|---|
| CZT HV Monitor | 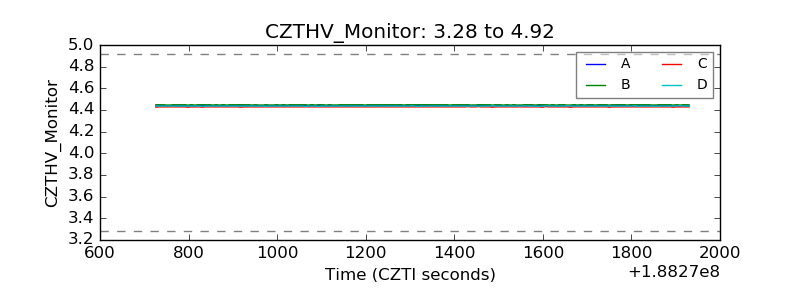 |
| D_VDD | 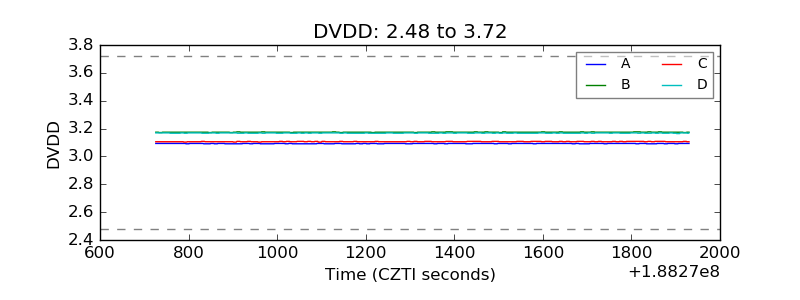 |
| Temperature 1 | 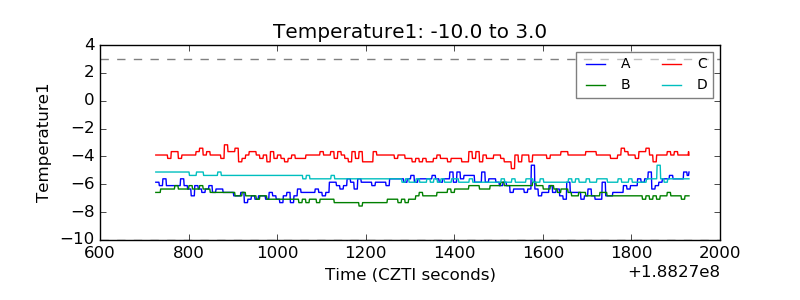 |
| Veto HV Monitor | 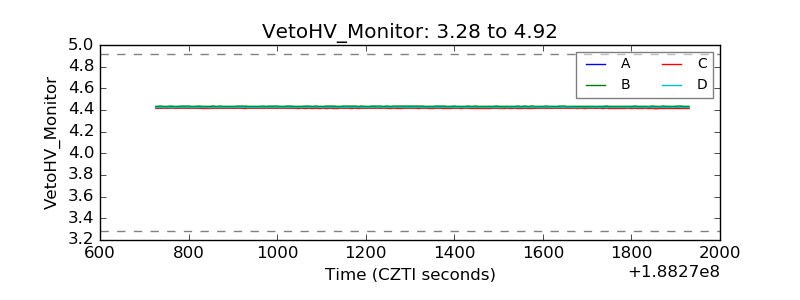 |
| Veto LLD | 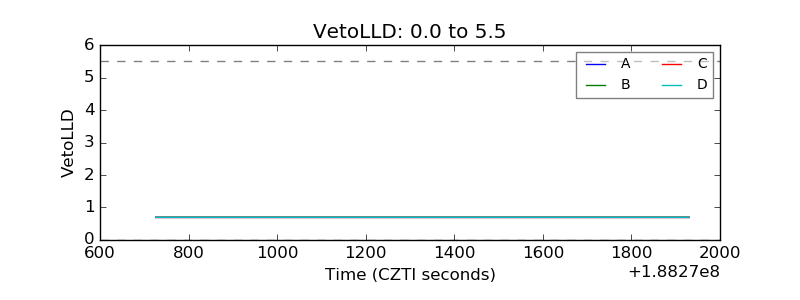 |
| Alpha Counter | 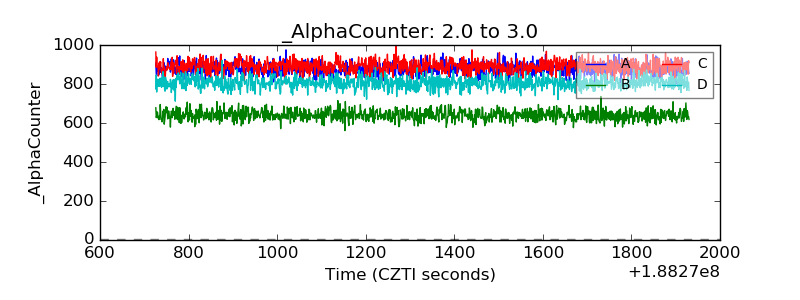 |
| _CPM_Rate | 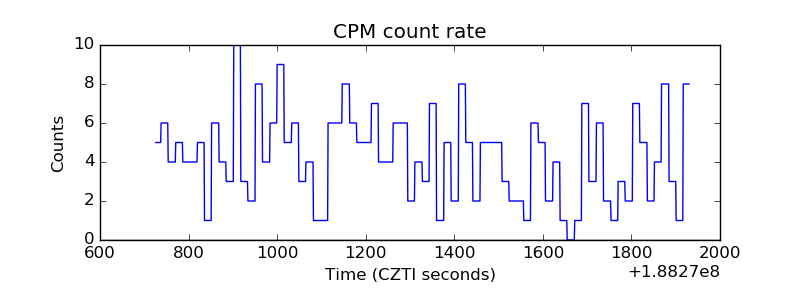 |
| CZT Counter | 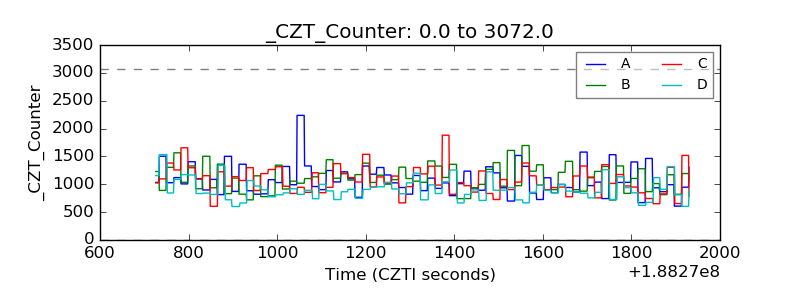 |
| +2.5 Volts monitor |  |
| +5 Volts monitor |  |
| _ROLL_ROT | 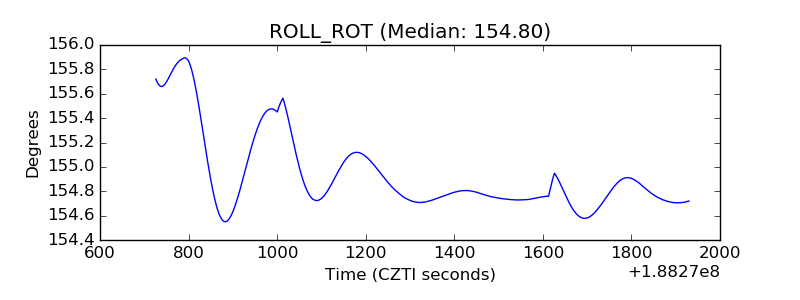 |
| _Roll_DEC | 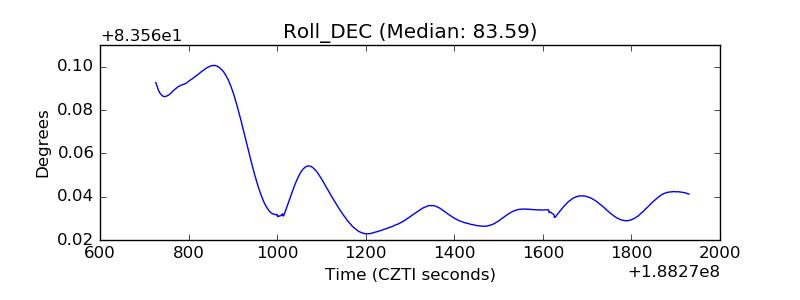 |
| _Roll_RA | 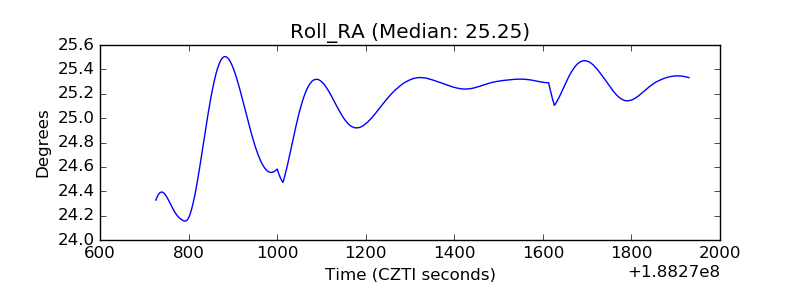 |
| Veto Counter | 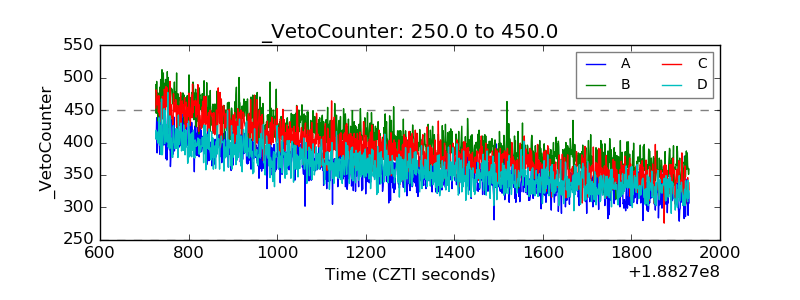 |