| Param | Original file | Final file |
|---|---|---|
| Filename | modeM0/AS1G04_003T02_9000000224_01229cztM0_level2.evt | modeM0/AS1G04_003T02_9000000224_01229cztM0_level2_quad_clean.evt |
| Size (bytes) | 948,009,600 | 97,090,560 |
| Size | 904.1 MB | 92.6 MB |
| Events in quadrant A | 7,036,405 | 641,402 |
| Events in quadrant B | 7,287,911 | 651,128 |
| Events in quadrant C | 6,955,937 | 623,869 |
| Events in quadrant D | 7,029,693 | 602,735 |
| Mode M9 | |||
|---|---|---|---|
| Quadrant | BADHDUFLAG | Total packets | Discarded packets |
| A | 0 | 13 | 0 |
| B | 0 | 13 | 0 |
| C | 0 | 13 | 0 |
| D | 0 | 13 | 0 |
| Mode M0 | |||
|---|---|---|---|
| Quadrant | BADHDUFLAG | Total packets | Discarded packets |
| A | 0 | 25188 | 2 |
| B | 0 | 25945 | 1 |
| C | 0 | 24962 | 1 |
| D | 0 | 25194 | 1 |
| Mode SS | |||
|---|---|---|---|
| Quadrant | BADHDUFLAG | Total packets | Discarded packets |
| A | 0 | 120 | 0 |
| B | 0 | 120 | 0 |
| C | 0 | 120 | 0 |
| D | 0 | 120 | 0 |
| Quadrant | Total seconds | Saturated seconds | Saturation percentage |
|---|---|---|---|
| A | 6041 | 15 | 0.248303% |
| B | 6041 | 14 | 0.231750% |
| C | 6041 | 8 | 0.132428% |
| D | 6041 | 57 | 0.943552% |
Noise dominated data is calculated using 1-second bins in cleaned event files. If a bin has >2000 counts, and if more than 50% of those come from <1% of pixels, then it is considered to be noise-dominated and hence unusable.
| Quadrant | # 1 sec bins | Bins with >0 counts | Bins with >2000 counts | High rate bins dominated by noise | Noise dominated (total time) | Noise dominated (detector-on time) | Marked lightcurve |
|---|---|---|---|---|---|---|---|
| A | 7286 | 6042 | 162 | 162 | 2.22% | 2.68% | 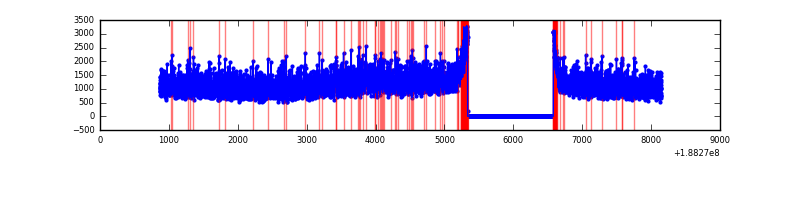 |
| B | 7286 | 6042 | 202 | 202 | 2.77% | 3.34% | 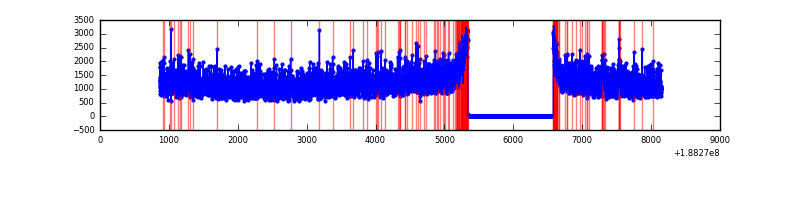 |
| C | 7286 | 6042 | 161 | 161 | 2.21% | 2.66% |  |
| D | 7286 | 6042 | 423 | 423 | 5.81% | 7.00% | 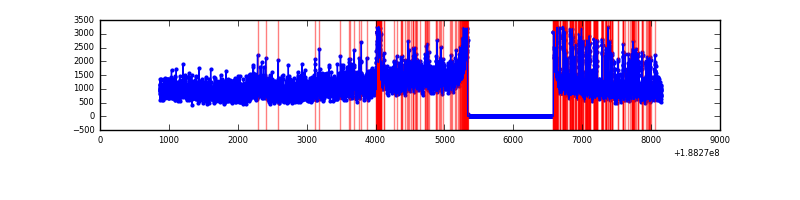 |
Top three noisy pixels from each quadrant. If the there are fewer than three noisy pixels in the level2.evt file, extra rows are filled as -1
| Pixel properties | Quadrant properties | ||||||
|---|---|---|---|---|---|---|---|
| Quadrant | DetID | PixID | Counts | Sigma | Mean | Median | Sigma |
| A | 12 | 133 | 55101 | 123.27 | 1809 | 1823 | 432.2 |
| A | 3 | 80 | 28299 | 61.26 | 1809 | 1823 | 432.2 |
| A | 11 | 79 | 6343 | 10.46 | 1809 | 1823 | 432.2 |
| B | 15 | 22 | 31392 | 67.13 | 1891 | 1905 | 439.2 |
| B | 5 | 191 | 24600 | 51.67 | 1891 | 1905 | 439.2 |
| B | 0 | 190 | 13696 | 26.84 | 1891 | 1905 | 439.2 |
| C | 15 | 241 | 322317 | 684.59 | 1686 | 1741 | 468.3 |
| C | 3 | 111 | 20526 | 40.12 | 1686 | 1741 | 468.3 |
| C | 3 | 79 | 18008 | 34.74 | 1686 | 1741 | 468.3 |
| D | 12 | 22 | 601611 | 1190.13 | 1624 | 1679 | 504.1 |
| D | 6 | 6 | 275205 | 542.61 | 1624 | 1679 | 504.1 |
| D | 10 | 170 | 65034 | 125.68 | 1624 | 1679 | 504.1 |
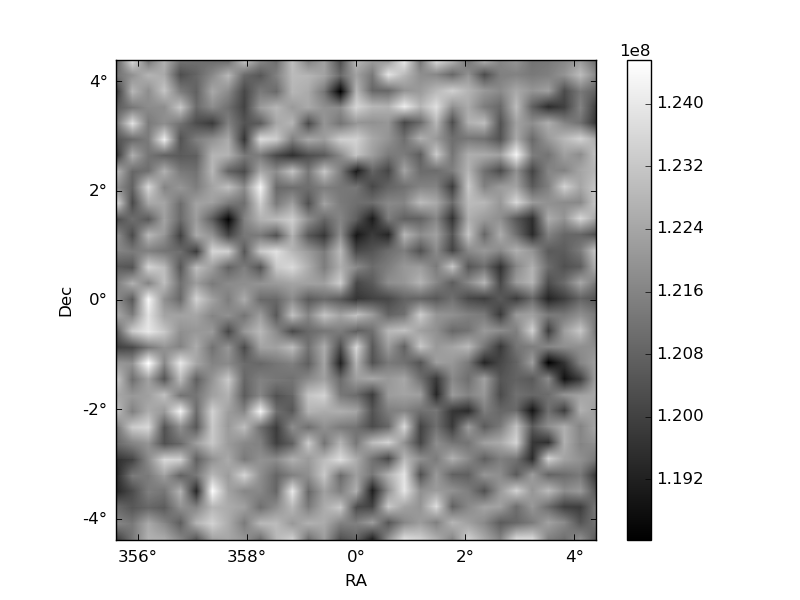
Histogram calculated using DETX and DETY for each event in the final _common_clean file
| Quadrant A | 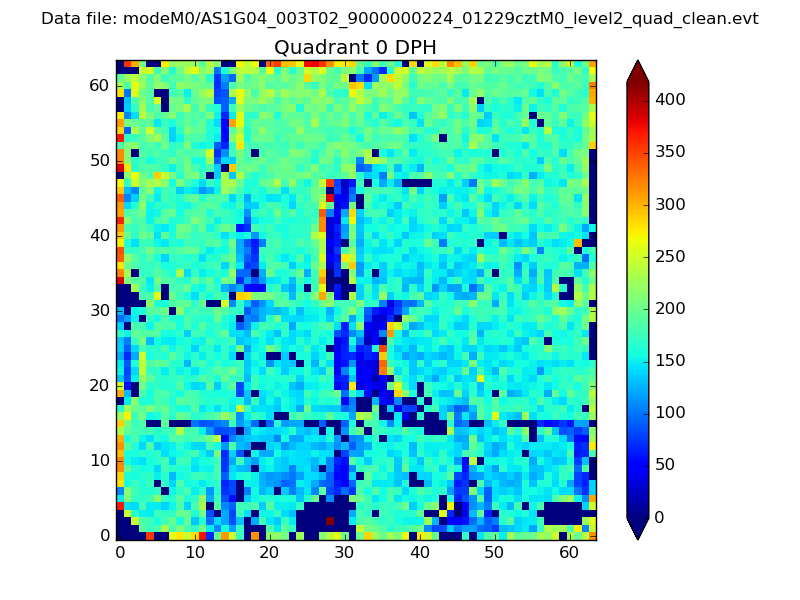 |
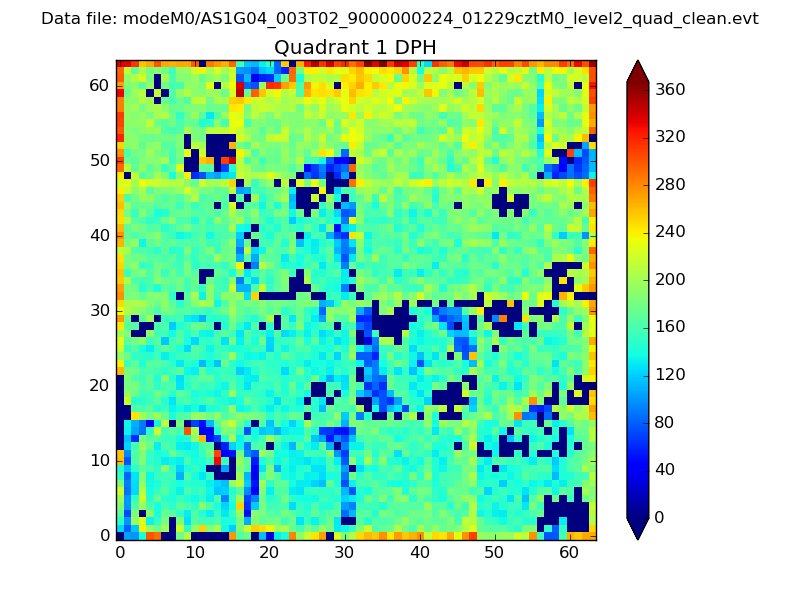 |
Quadrant B |
|---|---|---|---|
| Quadrant D |  |
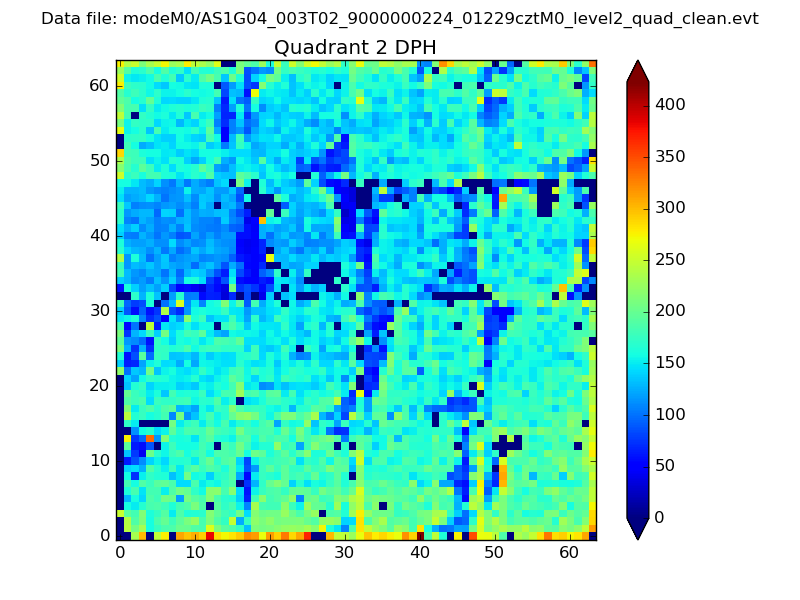 |
Quadrant C |
| Plot type | Count rate plots | Images |
|---|---|---|
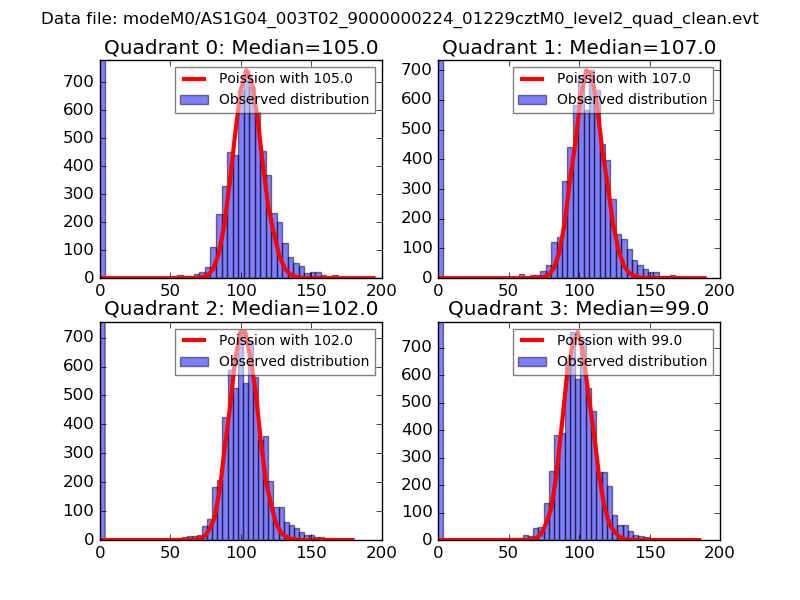
| Comparison with Poisson distribution Blue bars denote a histogram of data divided into 1 sec bins. Red curve is a Poisson curve with rate = median count rate of data. |
 |
 |
| Quadrant-wise count rates Data is divided into 100 sec bins |
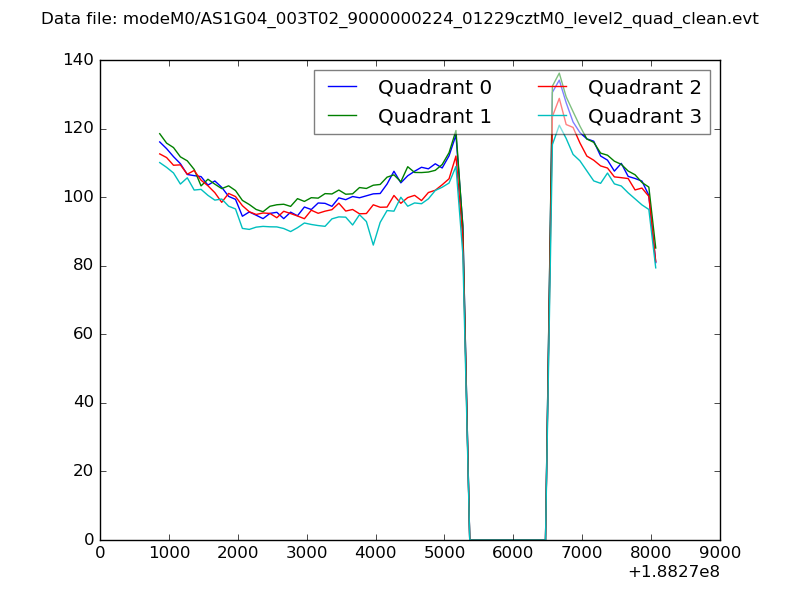 |
|
| Module-wise count rates for Quadrant A Data is divided into 100 sec bins |
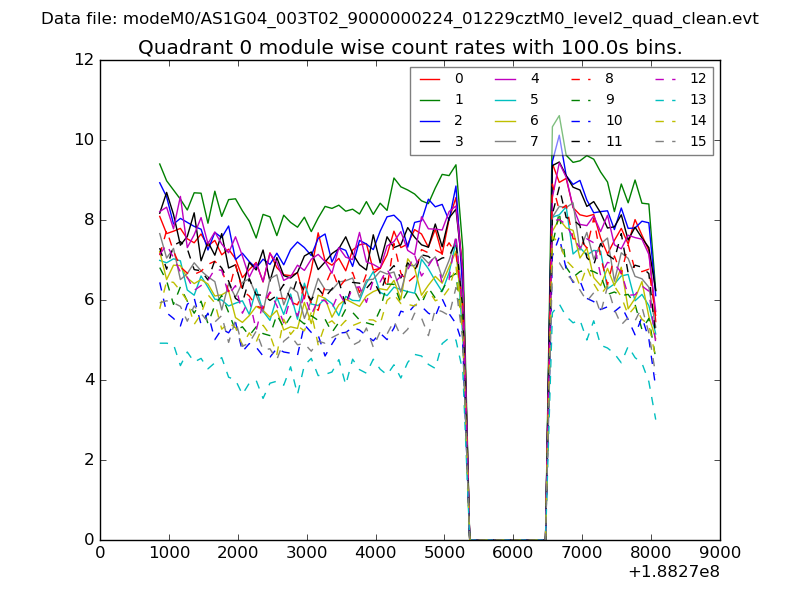 |
 |
| Module-wise count rates for Quadrant B Data is divided into 100 sec bins |
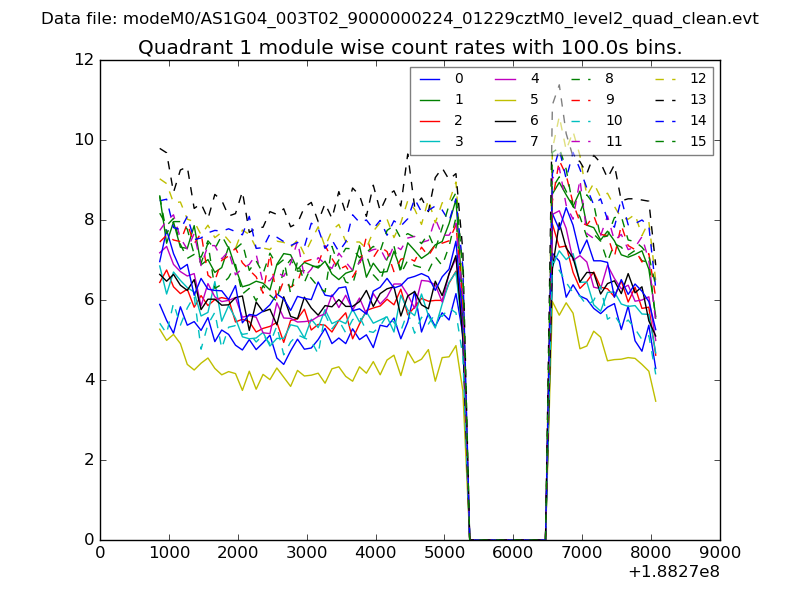 |
 |
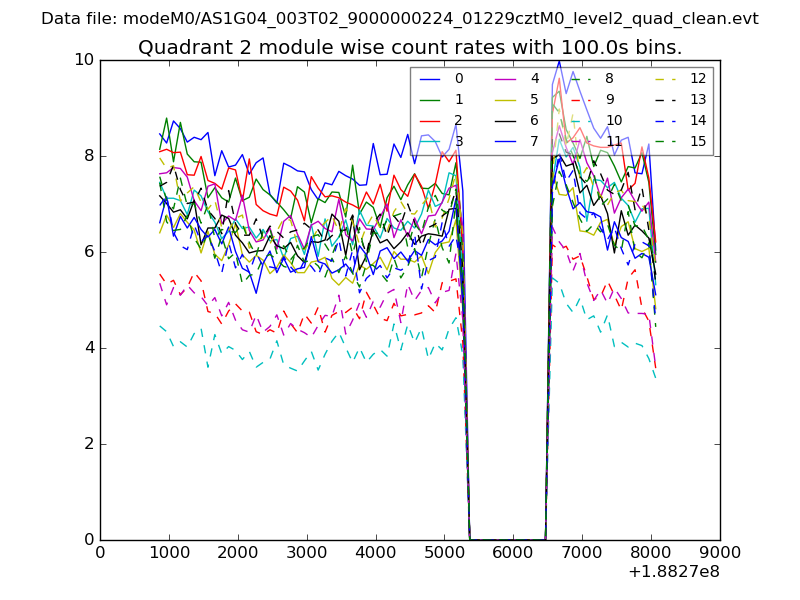
| Module-wise count rates for Quadrant C Data is divided into 100 sec bins |
 |
 |
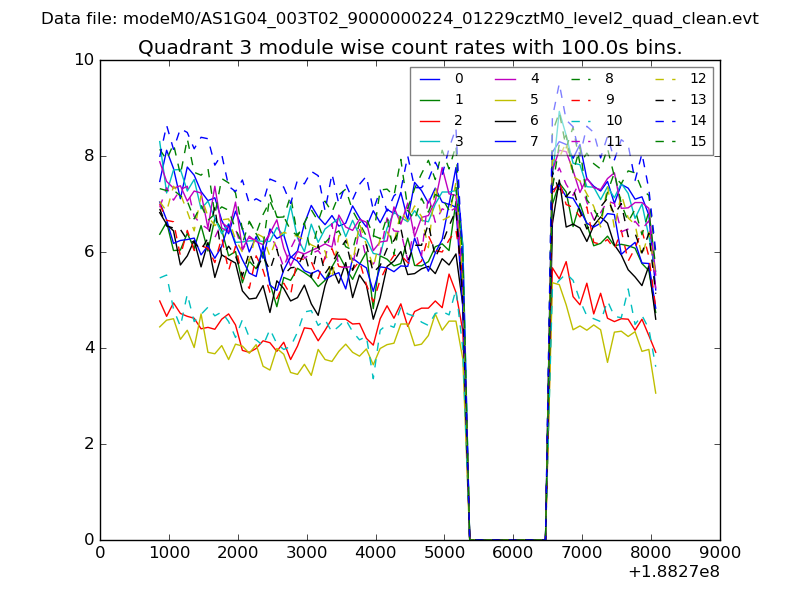
| Module-wise count rates for Quadrant D Data is divided into 100 sec bins |
 |
 |
| Parameter | Plot |
|---|---|
| CZT HV Monitor | 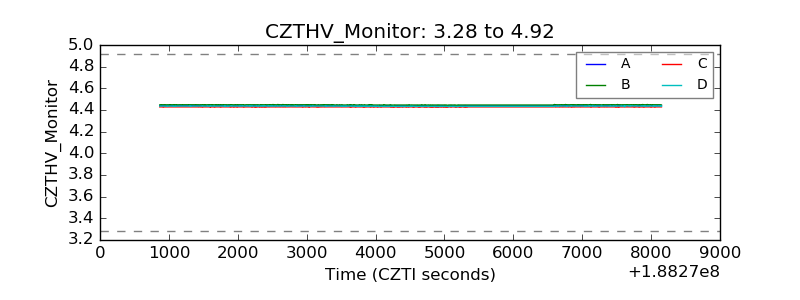 |
| D_VDD |  |
| Temperature 1 | 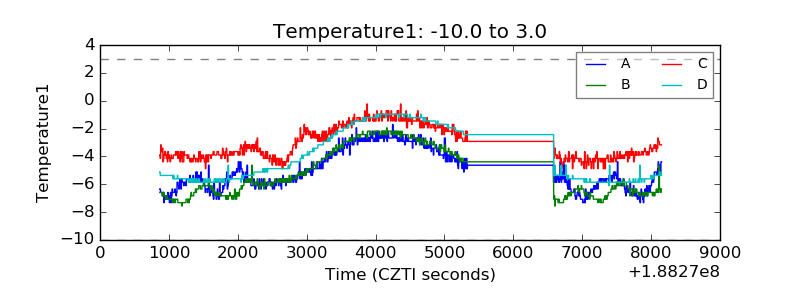 |
| Veto HV Monitor | 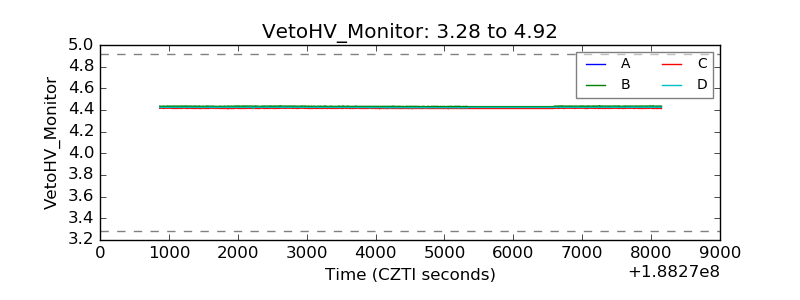 |
| Veto LLD | 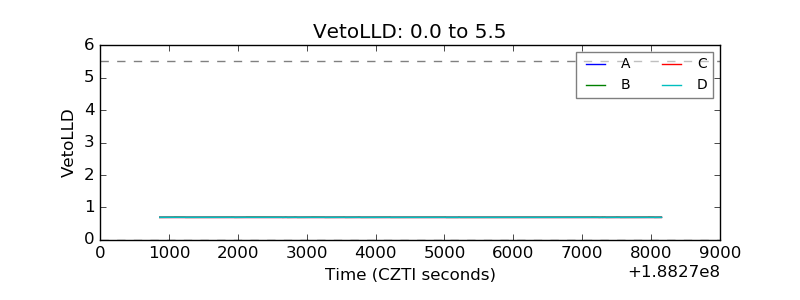 |
| Alpha Counter | 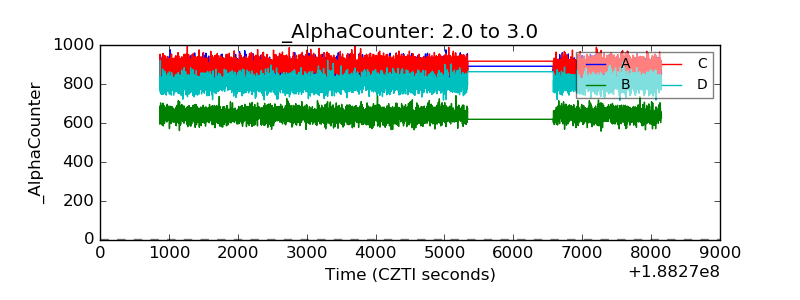 |
| _CPM_Rate | 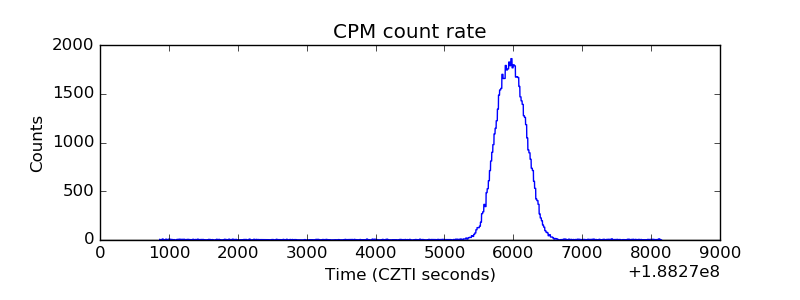 |
| CZT Counter |  |
| +2.5 Volts monitor |  |
| +5 Volts monitor |  |
| _ROLL_ROT | 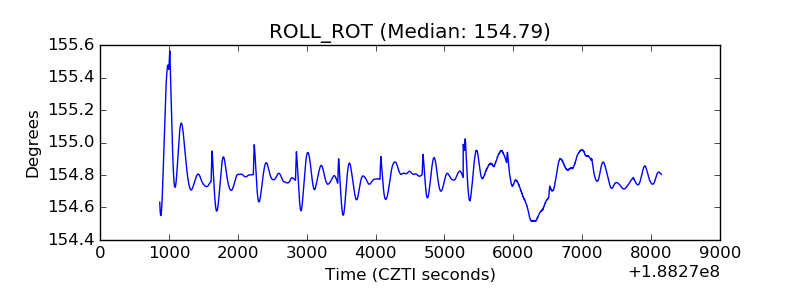 |
| _Roll_DEC | 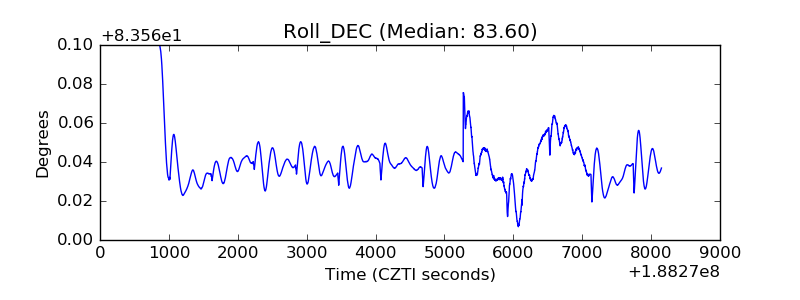 |
| _Roll_RA | 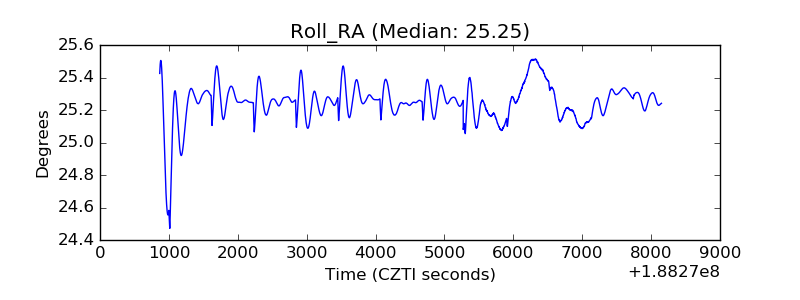 |
| Veto Counter | 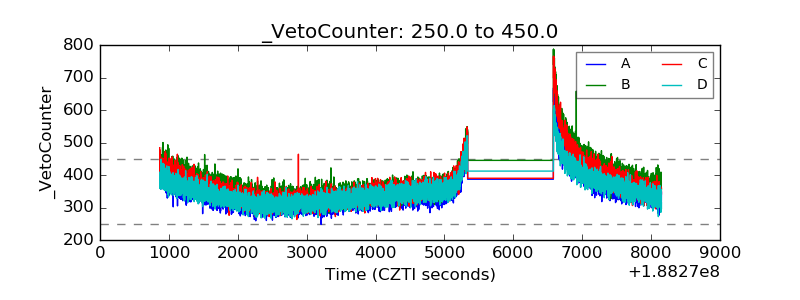 |