| Param | Original file | Final file |
|---|---|---|
| Filename | modeM0/AS1G04_003T02_9000000224_01230cztM0_level2.evt | modeM0/AS1G04_003T02_9000000224_01230cztM0_level2_quad_clean.evt |
| Size (bytes) | 963,967,680 | 99,158,400 |
| Size | 919.3 MB | 94.6 MB |
| Events in quadrant A | 7,140,504 | 658,121 |
| Events in quadrant B | 7,485,304 | 665,222 |
| Events in quadrant C | 7,044,272 | 638,074 |
| Events in quadrant D | 7,112,587 | 609,631 |
| Mode M9 | |||
|---|---|---|---|
| Quadrant | BADHDUFLAG | Total packets | Discarded packets |
| A | 0 | 13 | 0 |
| B | 0 | 13 | 0 |
| C | 0 | 13 | 0 |
| D | 0 | 13 | 0 |
| Mode M0 | |||
|---|---|---|---|
| Quadrant | BADHDUFLAG | Total packets | Discarded packets |
| A | 0 | 25605 | 2 |
| B | 0 | 26636 | 1 |
| C | 0 | 25279 | 1 |
| D | 0 | 25616 | 1 |
| Mode SS | |||
|---|---|---|---|
| Quadrant | BADHDUFLAG | Total packets | Discarded packets |
| A | 0 | 126 | 0 |
| B | 0 | 126 | 0 |
| C | 0 | 126 | 0 |
| D | 0 | 126 | 0 |
| Quadrant | Total seconds | Saturated seconds | Saturation percentage |
|---|---|---|---|
| A | 6187 | 8 | 0.129303% |
| B | 6187 | 14 | 0.226281% |
| C | 6187 | 7 | 0.113140% |
| D | 6187 | 175 | 2.828511% |
Noise dominated data is calculated using 1-second bins in cleaned event files. If a bin has >2000 counts, and if more than 50% of those come from <1% of pixels, then it is considered to be noise-dominated and hence unusable.
| Quadrant | # 1 sec bins | Bins with >0 counts | Bins with >2000 counts | High rate bins dominated by noise | Noise dominated (total time) | Noise dominated (detector-on time) | Marked lightcurve |
|---|---|---|---|---|---|---|---|
| A | 7487 | 6188 | 155 | 155 | 2.07% | 2.50% | 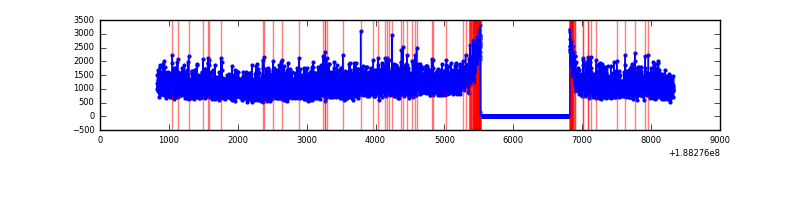 |
| B | 7487 | 6188 | 208 | 208 | 2.78% | 3.36% | 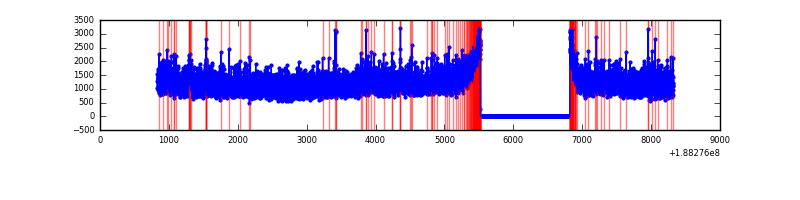 |
| C | 7487 | 6188 | 142 | 142 | 1.90% | 2.29% | 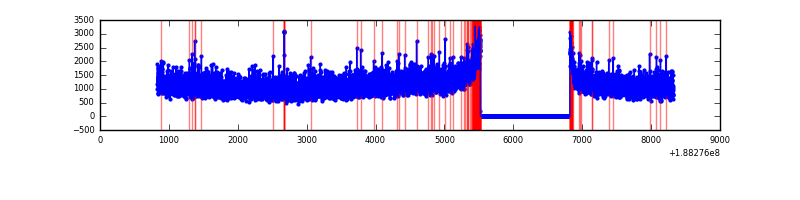 |
| D | 7487 | 6188 | 465 | 465 | 6.21% | 7.51% | 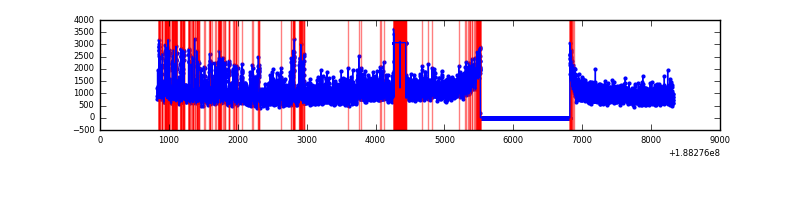 |
Top three noisy pixels from each quadrant. If the there are fewer than three noisy pixels in the level2.evt file, extra rows are filled as -1
| Pixel properties | Quadrant properties | ||||||
|---|---|---|---|---|---|---|---|
| Quadrant | DetID | PixID | Counts | Sigma | Mean | Median | Sigma |
| A | 12 | 243 | 10138 | 18.75 | 1854 | 1866 | 441.1 |
| A | 12 | 133 | 7417 | 12.58 | 1854 | 1866 | 441.1 |
| A | 11 | 79 | 7276 | 12.26 | 1854 | 1866 | 441.1 |
| B | 5 | 191 | 37011 | 77.74 | 1939 | 1948 | 451.0 |
| B | 15 | 22 | 22312 | 45.15 | 1939 | 1948 | 451.0 |
| B | 7 | 221 | 19173 | 38.19 | 1939 | 1948 | 451.0 |
| C | 15 | 241 | 325383 | 689.29 | 1707 | 1761 | 469.5 |
| C | 3 | 111 | 18379 | 35.4 | 1707 | 1761 | 469.5 |
| C | 9 | 52 | 18011 | 34.61 | 1707 | 1761 | 469.5 |
| D | 12 | 22 | 1000627 | 2002.74 | 1619 | 1677 | 498.8 |
| D | 6 | 6 | 39436 | 75.7 | 1619 | 1677 | 498.8 |
| D | 10 | 215 | 10631 | 17.95 | 1619 | 1677 | 498.8 |
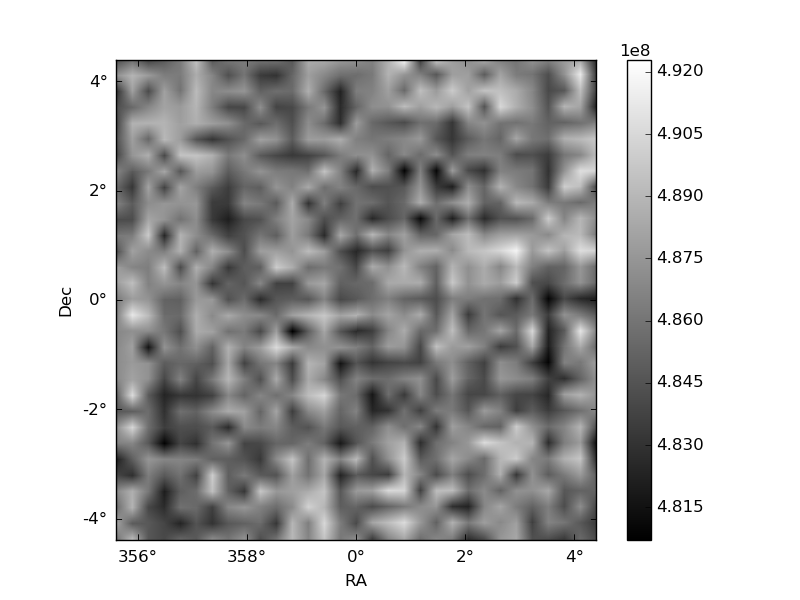
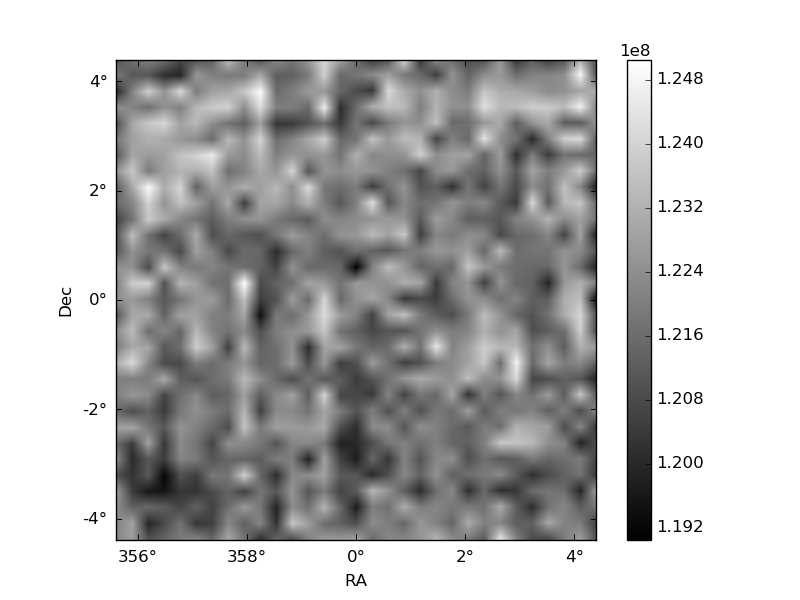
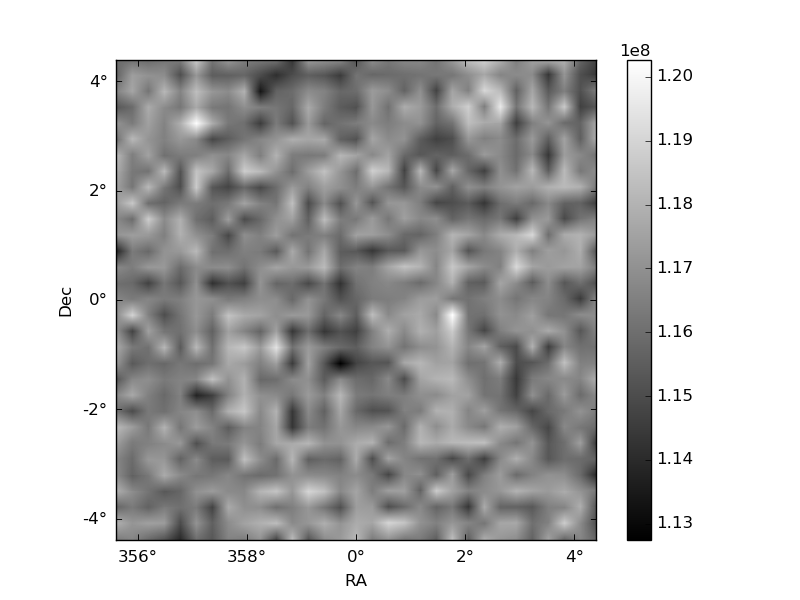
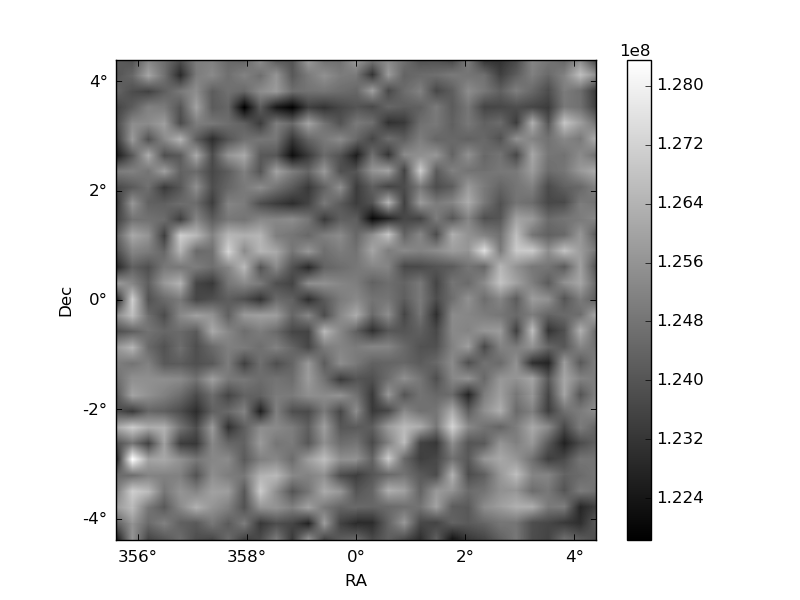
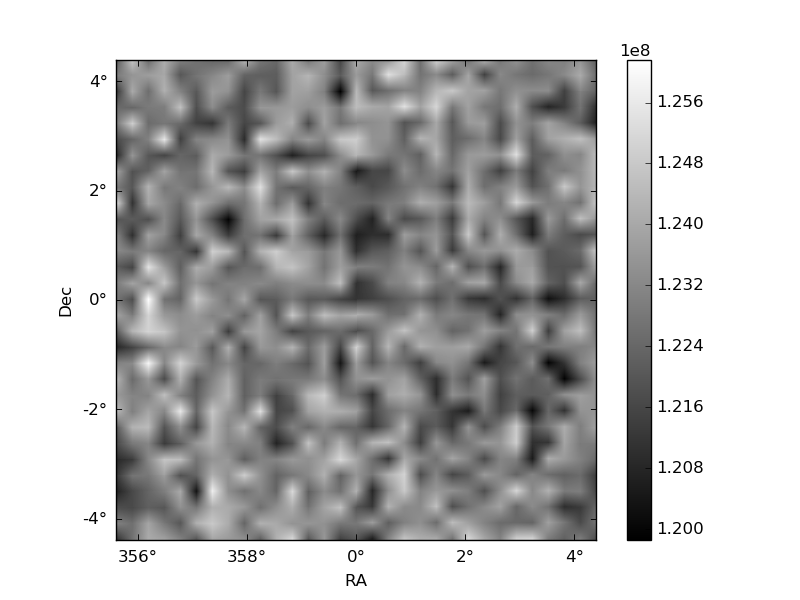
Histogram calculated using DETX and DETY for each event in the final _common_clean file
| Quadrant A | 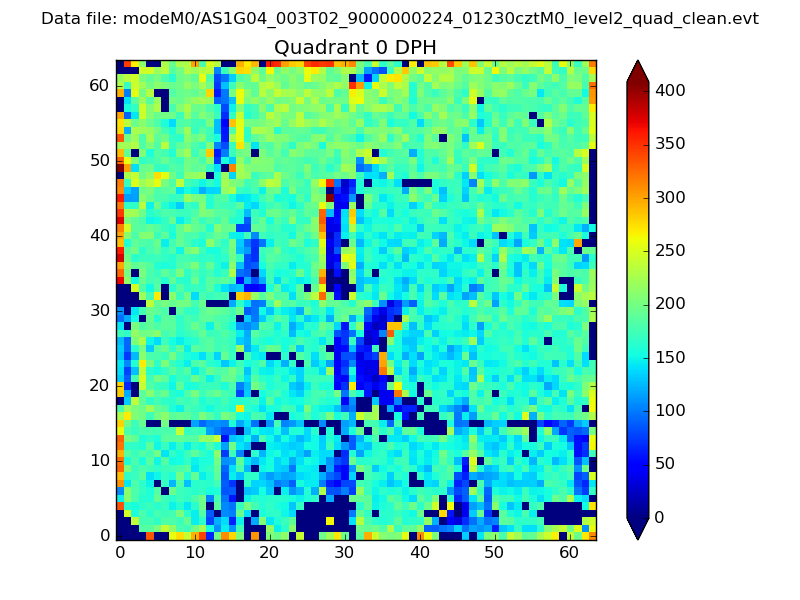 |
 |
Quadrant B |
|---|---|---|---|
| Quadrant D | 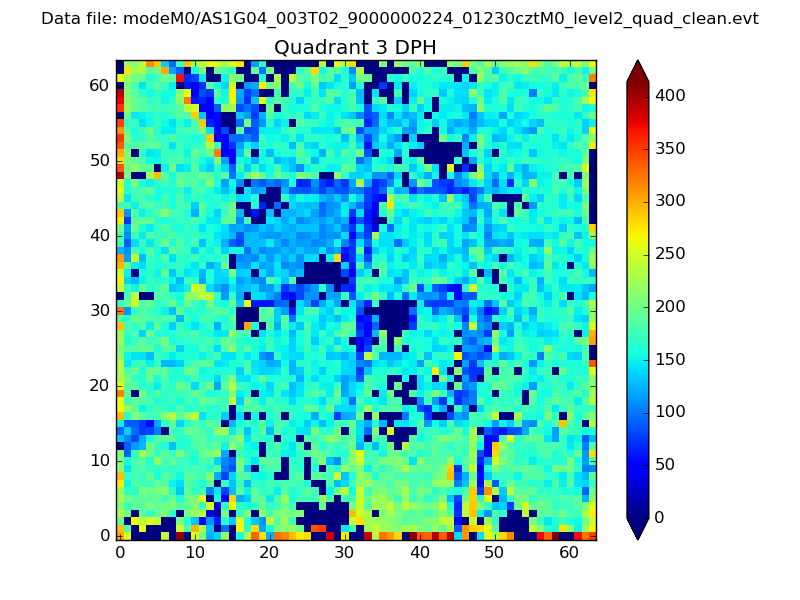 |
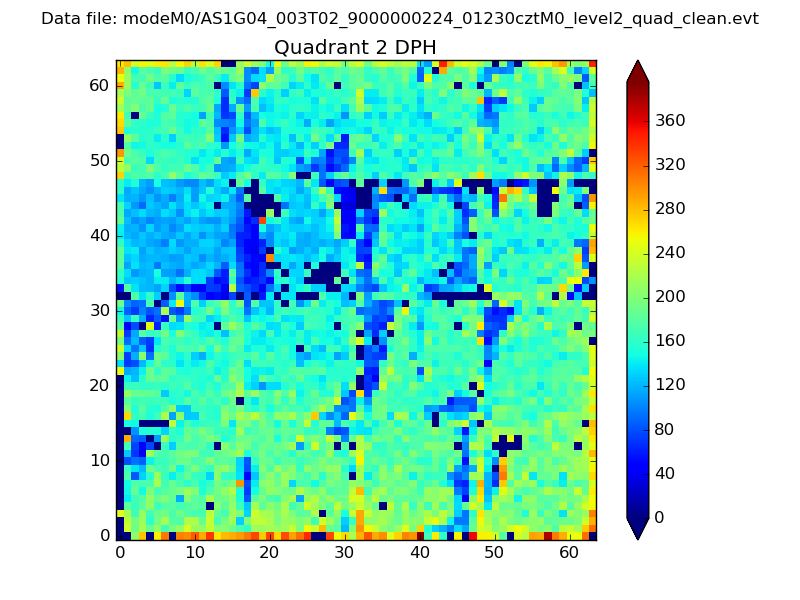 |
Quadrant C |
| Plot type | Count rate plots | Images |
|---|---|---|
| Comparison with Poisson distribution Blue bars denote a histogram of data divided into 1 sec bins. Red curve is a Poisson curve with rate = median count rate of data. |
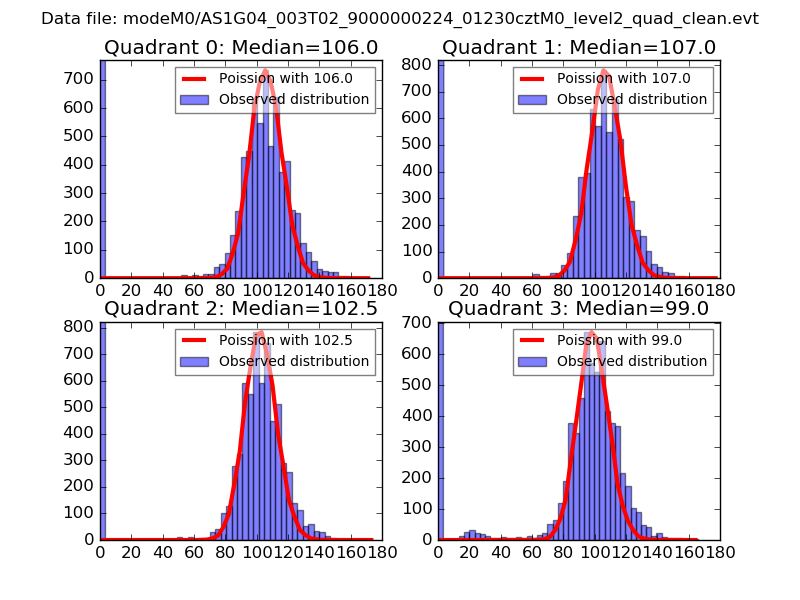 |
 |
| Quadrant-wise count rates Data is divided into 100 sec bins |
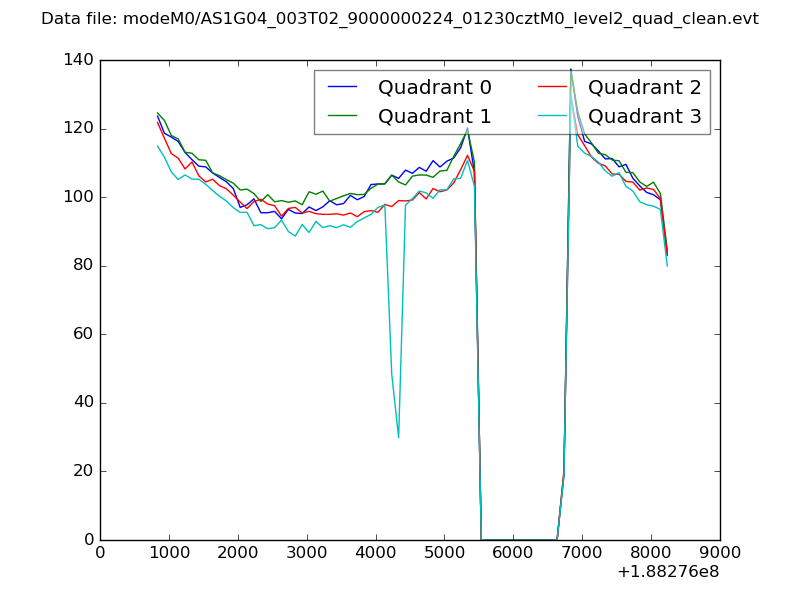 |
|
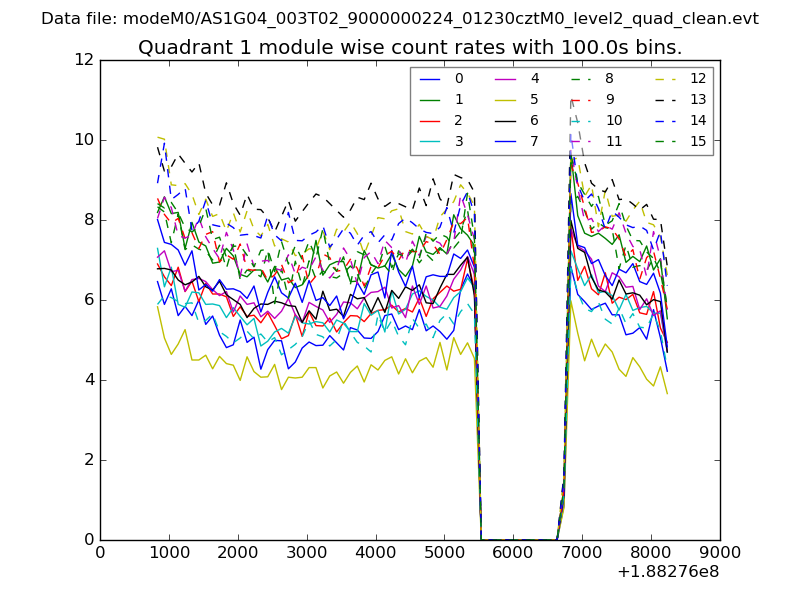
| Module-wise count rates for Quadrant A Data is divided into 100 sec bins |
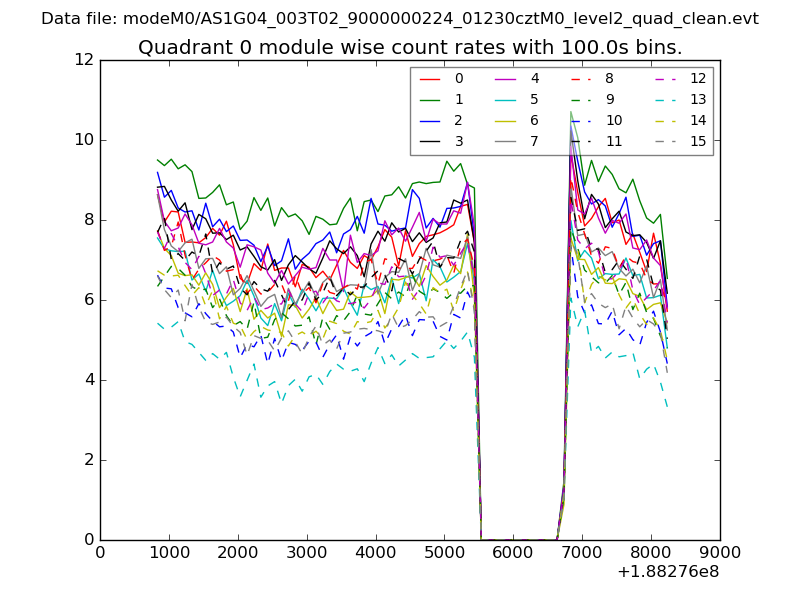 |
 |
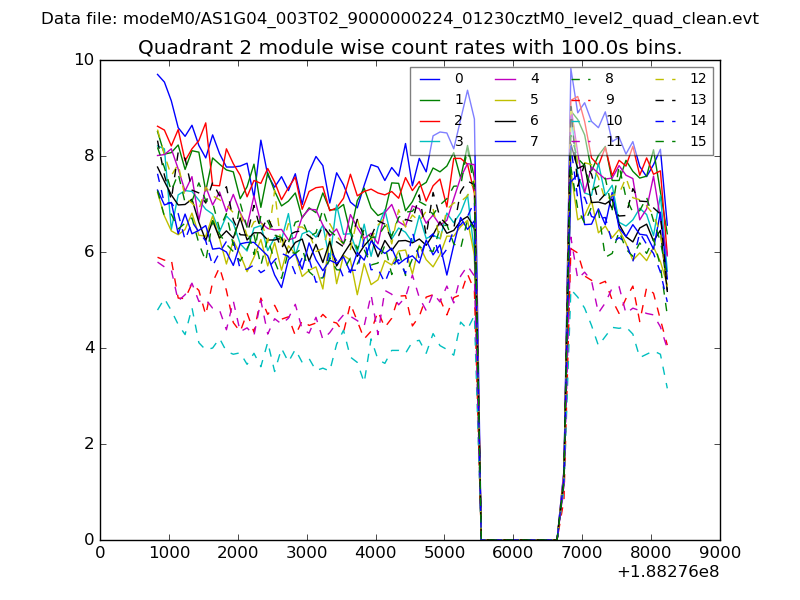
| Module-wise count rates for Quadrant B Data is divided into 100 sec bins |
 |
 |
| Module-wise count rates for Quadrant C Data is divided into 100 sec bins |
 |
 |
| Module-wise count rates for Quadrant D Data is divided into 100 sec bins |
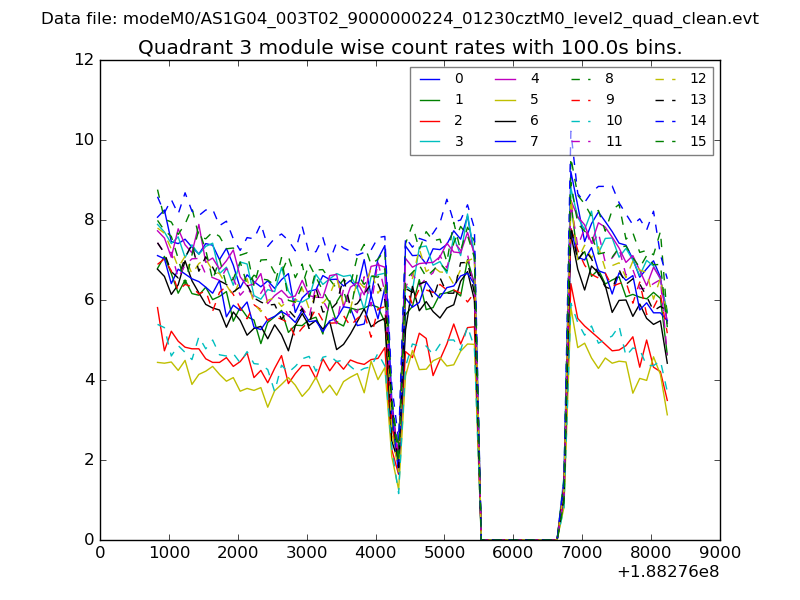 |
 |
| Parameter | Plot |
|---|---|
| CZT HV Monitor | 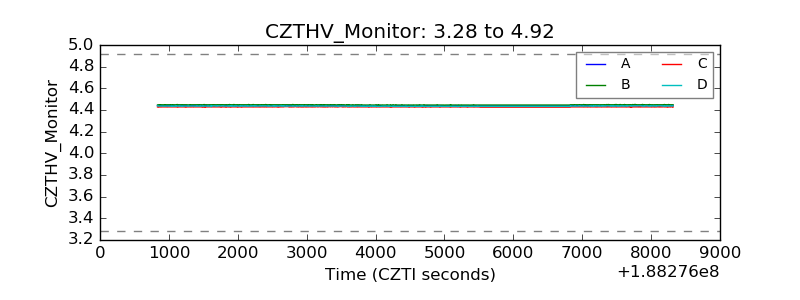 |
| D_VDD | 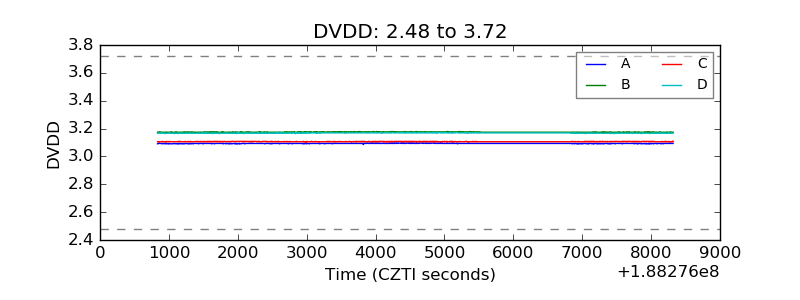 |
| Temperature 1 | 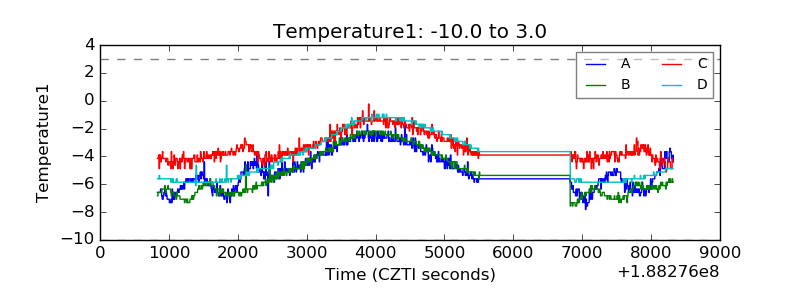 |
| Veto HV Monitor | 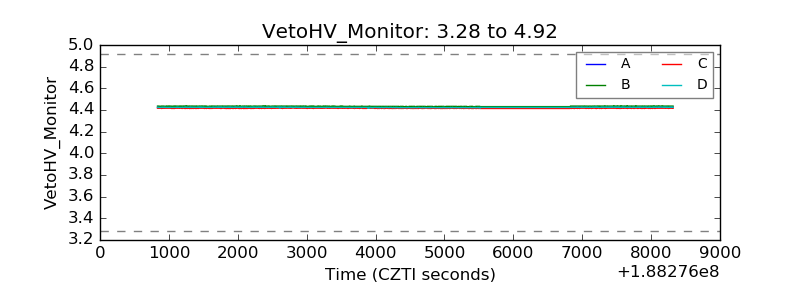 |
| Veto LLD | 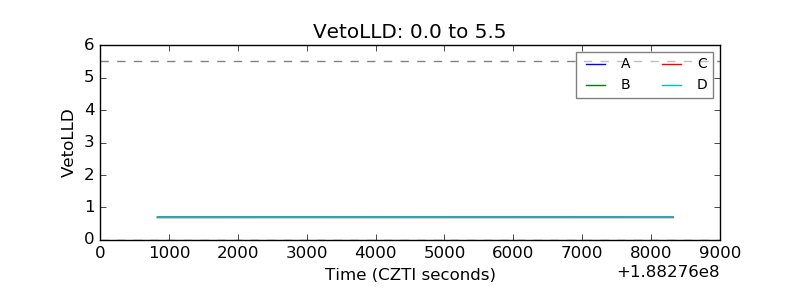 |
| Alpha Counter | 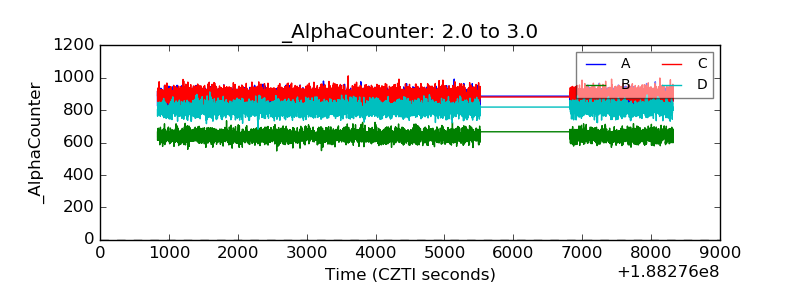 |
| _CPM_Rate | 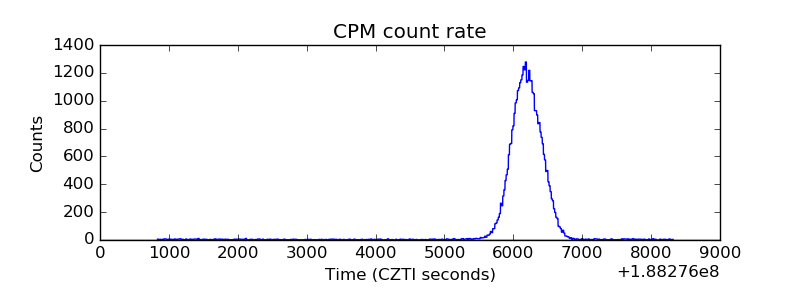 |
| CZT Counter | 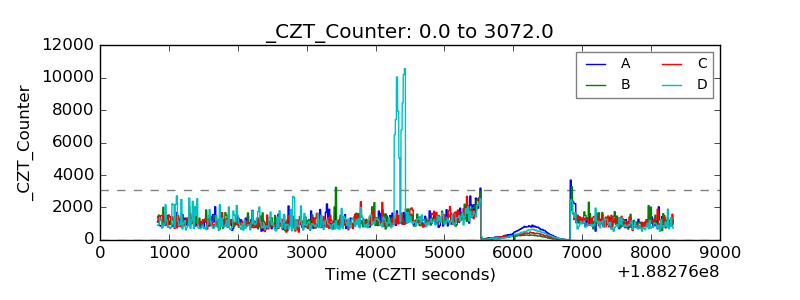 |
| +2.5 Volts monitor |  |
| +5 Volts monitor | 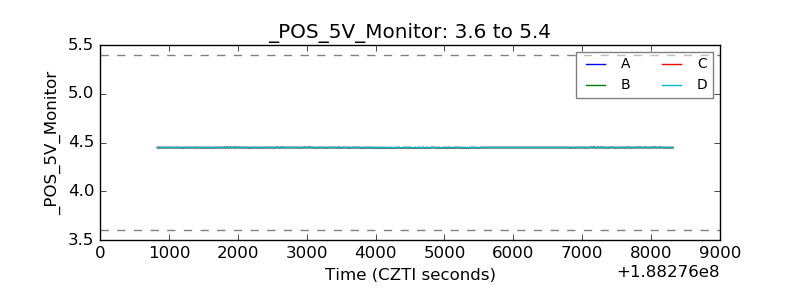 |
| _ROLL_ROT | 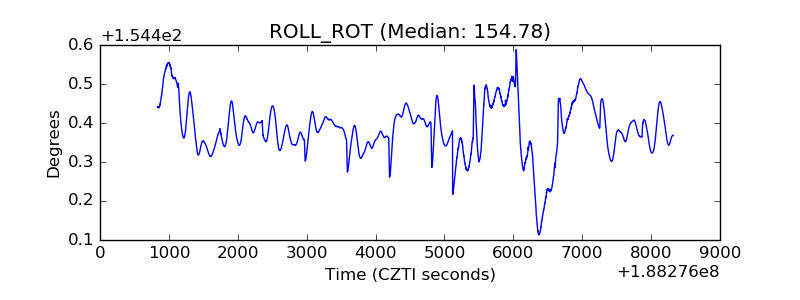 |
| _Roll_DEC | 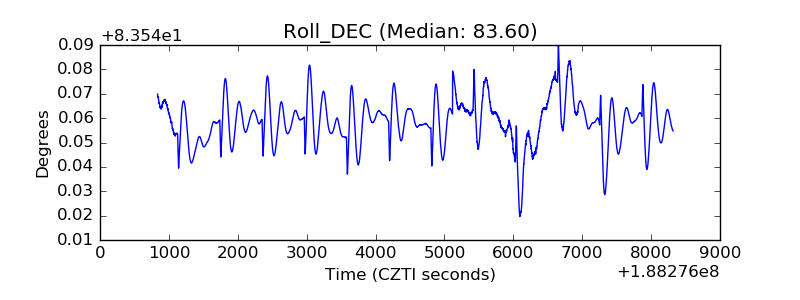 |
| _Roll_RA | 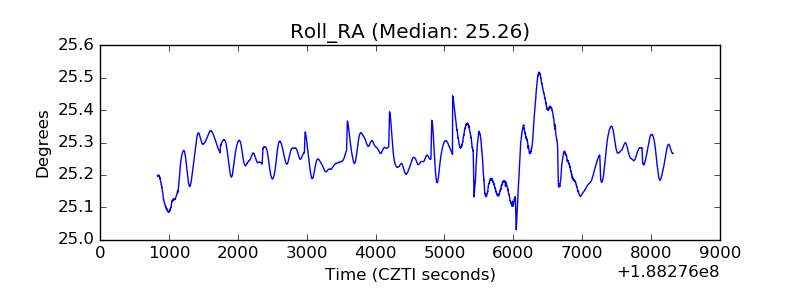 |
| Veto Counter | 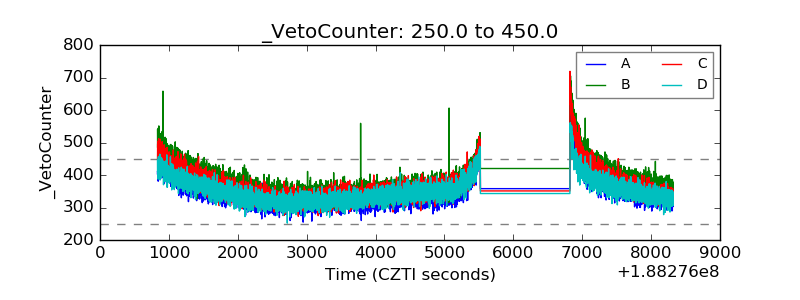 |