| Param | Original file | Final file |
|---|---|---|
| Filename | modeM0/AS1G04_003T02_9000000224_01231cztM0_level2.evt | modeM0/AS1G04_003T02_9000000224_01231cztM0_level2_quad_clean.evt |
| Size (bytes) | 962,565,120 | 98,599,680 |
| Size | 918.0 MB | 94.0 MB |
| Events in quadrant A | 7,347,415 | 651,219 |
| Events in quadrant B | 7,623,137 | 654,811 |
| Events in quadrant C | 7,226,639 | 627,778 |
| Events in quadrant D | 6,539,592 | 616,833 |
| Mode M9 | |||
|---|---|---|---|
| Quadrant | BADHDUFLAG | Total packets | Discarded packets |
| A | 0 | 13 | 0 |
| B | 0 | 13 | 0 |
| C | 0 | 13 | 0 |
| D | 0 | 13 | 0 |
| Mode M0 | |||
|---|---|---|---|
| Quadrant | BADHDUFLAG | Total packets | Discarded packets |
| A | 0 | 26283 | 2 |
| B | 0 | 27082 | 1 |
| C | 0 | 25883 | 1 |
| D | 0 | 23891 | 1 |
| Mode SS | |||
|---|---|---|---|
| Quadrant | BADHDUFLAG | Total packets | Discarded packets |
| A | 0 | 126 | 0 |
| B | 0 | 126 | 0 |
| C | 0 | 126 | 0 |
| D | 0 | 126 | 0 |
| Quadrant | Total seconds | Saturated seconds | Saturation percentage |
|---|---|---|---|
| A | 6243 | 12 | 0.192215% |
| B | 6243 | 18 | 0.288323% |
| C | 6243 | 6 | 0.096108% |
| D | 6243 | 1 | 0.016018% |
Noise dominated data is calculated using 1-second bins in cleaned event files. If a bin has >2000 counts, and if more than 50% of those come from <1% of pixels, then it is considered to be noise-dominated and hence unusable.
| Quadrant | # 1 sec bins | Bins with >0 counts | Bins with >2000 counts | High rate bins dominated by noise | Noise dominated (total time) | Noise dominated (detector-on time) | Marked lightcurve |
|---|---|---|---|---|---|---|---|
| A | 7473 | 6244 | 188 | 188 | 2.52% | 3.01% | 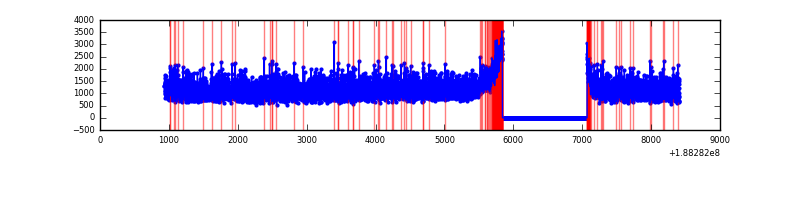 |
| B | 7473 | 6244 | 228 | 228 | 3.05% | 3.65% | 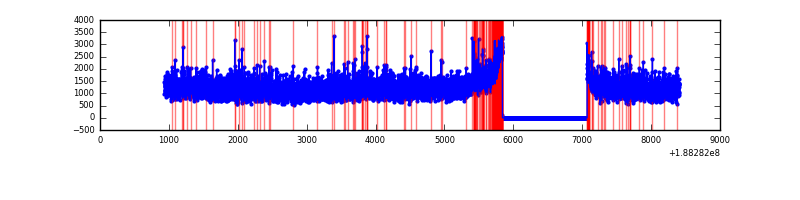 |
| C | 7473 | 6244 | 194 | 194 | 2.60% | 3.11% | 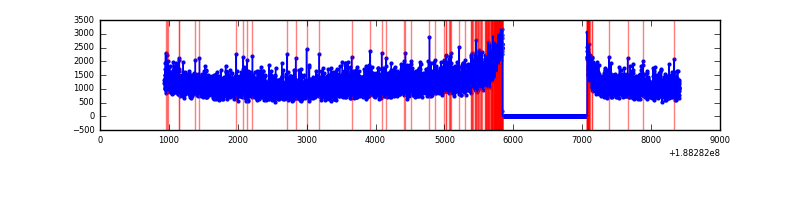 |
| D | 7473 | 6244 | 106 | 106 | 1.42% | 1.70% | 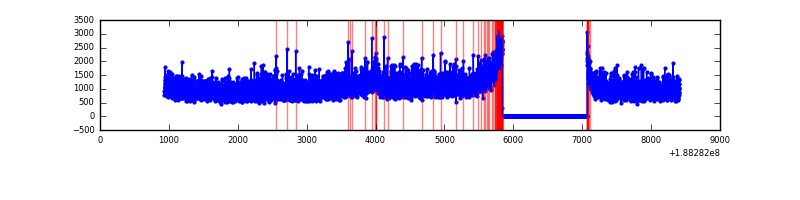 |
Top three noisy pixels from each quadrant. If the there are fewer than three noisy pixels in the level2.evt file, extra rows are filled as -1
| Pixel properties | Quadrant properties | ||||||
|---|---|---|---|---|---|---|---|
| Quadrant | DetID | PixID | Counts | Sigma | Mean | Median | Sigma |
| A | 12 | 243 | 47377 | 100.14 | 1900 | 1916 | 454.0 |
| A | 11 | 79 | 7896 | 13.17 | 1900 | 1916 | 454.0 |
| A | 12 | 133 | 6300 | 9.66 | 1900 | 1916 | 454.0 |
| B | 5 | 191 | 50385 | 104.53 | 1969 | 1979 | 463.1 |
| B | 15 | 22 | 47991 | 99.36 | 1969 | 1979 | 463.1 |
| B | 14 | 3 | 22117 | 43.49 | 1969 | 1979 | 463.1 |
| C | 15 | 241 | 332214 | 679.38 | 1752 | 1810 | 486.3 |
| C | 3 | 111 | 20583 | 38.6 | 1752 | 1810 | 486.3 |
| C | 3 | 79 | 17105 | 31.45 | 1752 | 1810 | 486.3 |
| D | 12 | 22 | 109672 | 204.54 | 1703 | 1763 | 527.6 |
| D | 6 | 6 | 34574 | 62.19 | 1703 | 1763 | 527.6 |
| D | 10 | 84 | 10385 | 16.34 | 1703 | 1763 | 527.6 |
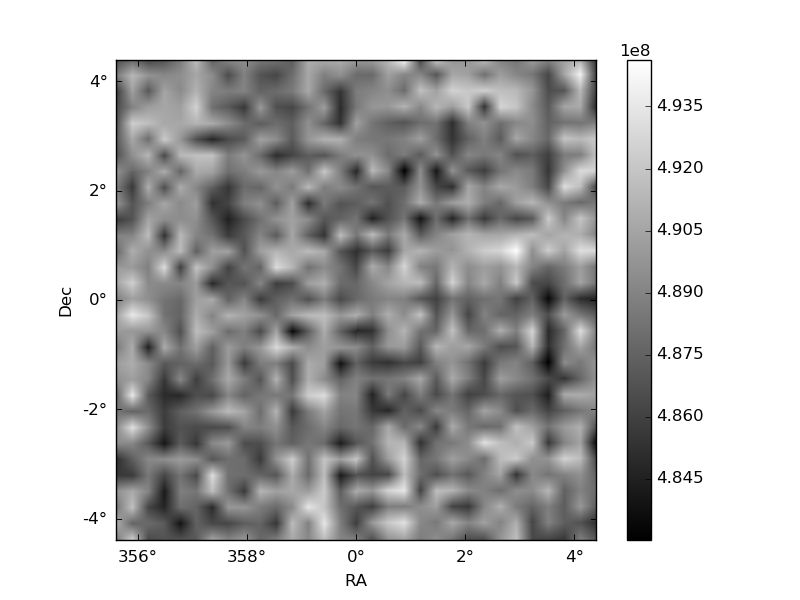
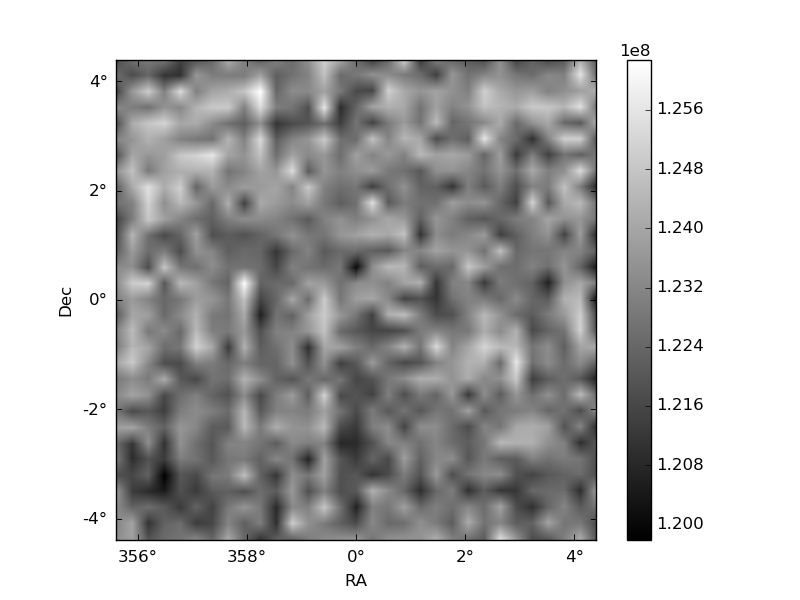
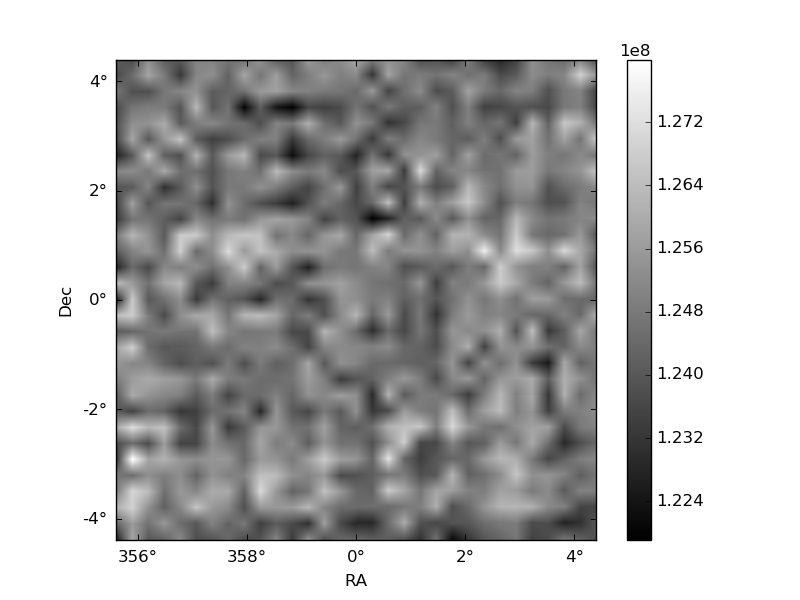
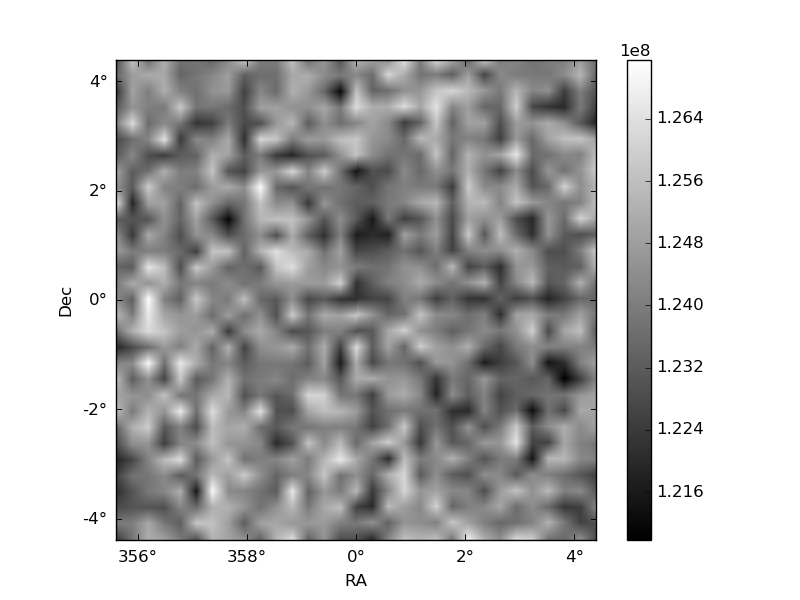
Histogram calculated using DETX and DETY for each event in the final _common_clean file
| Quadrant A | 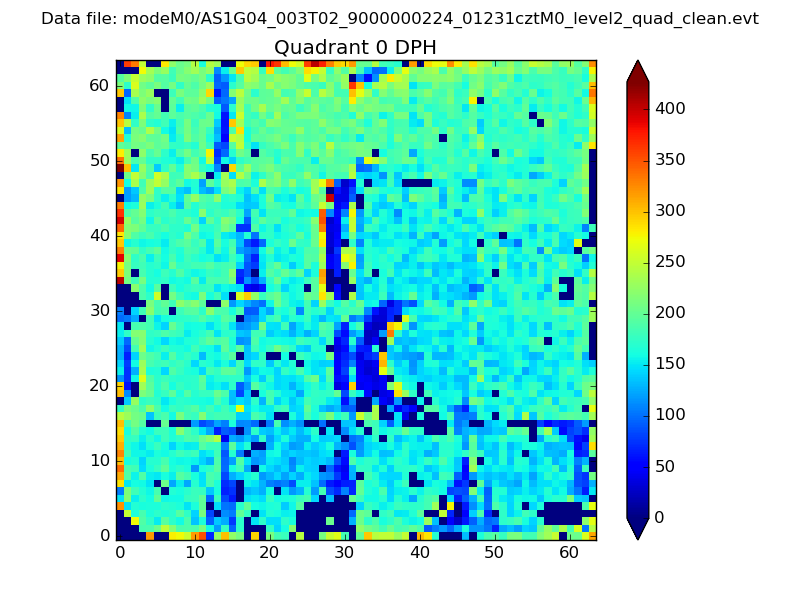 |
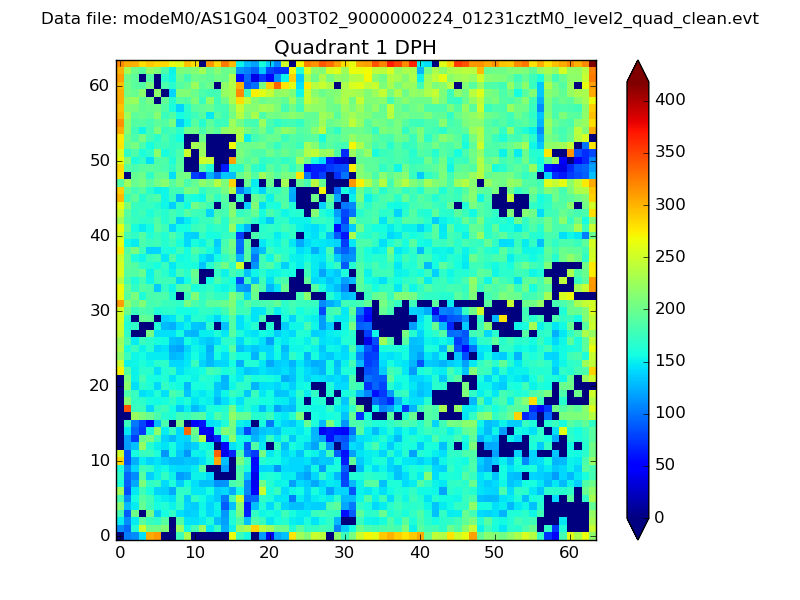 |
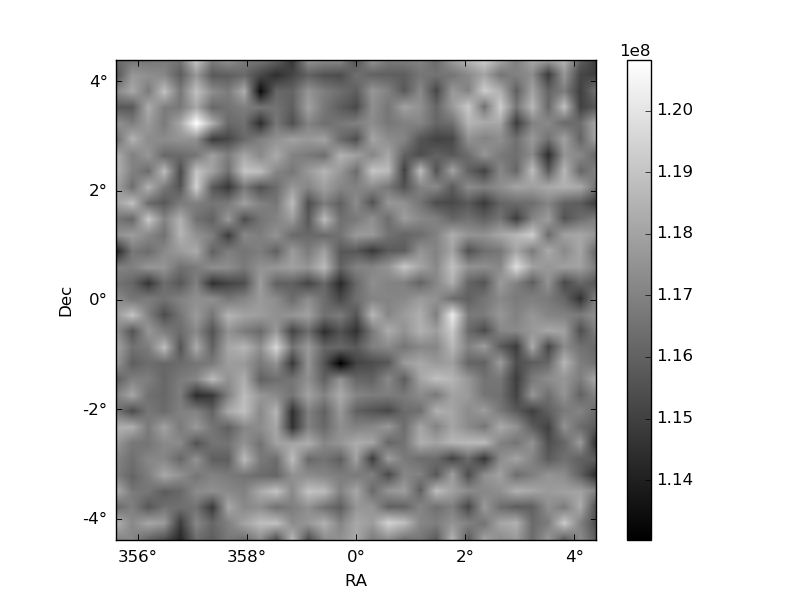
Quadrant B |
|---|---|---|---|
| Quadrant D | 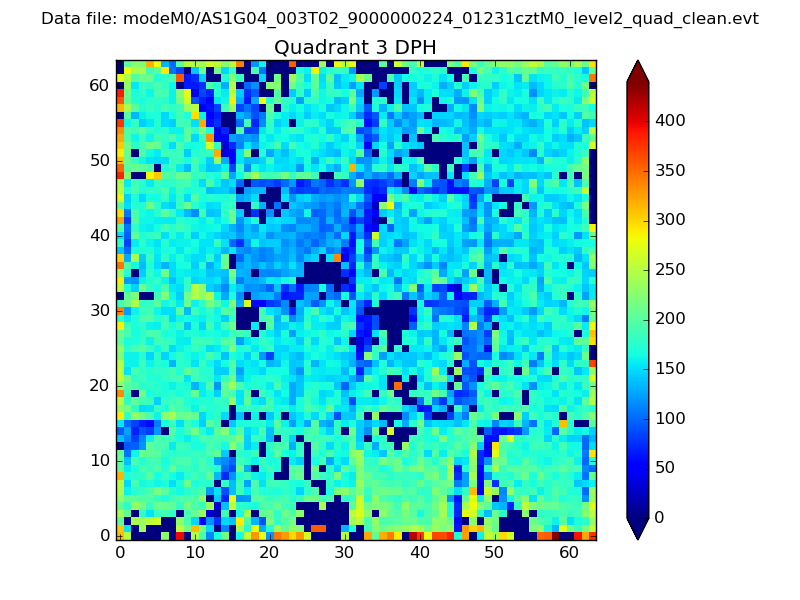 |
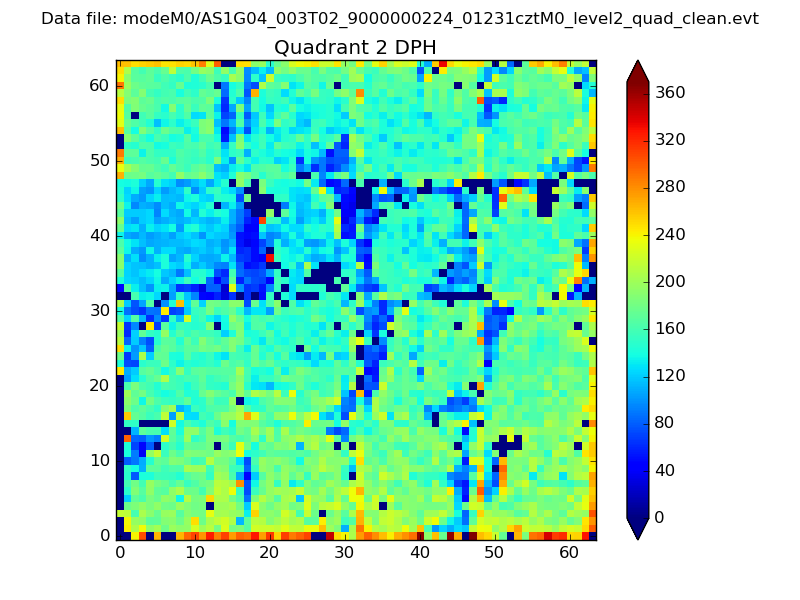 |
Quadrant C |
| Plot type | Count rate plots | Images |
|---|---|---|
| Comparison with Poisson distribution Blue bars denote a histogram of data divided into 1 sec bins. Red curve is a Poisson curve with rate = median count rate of data. |
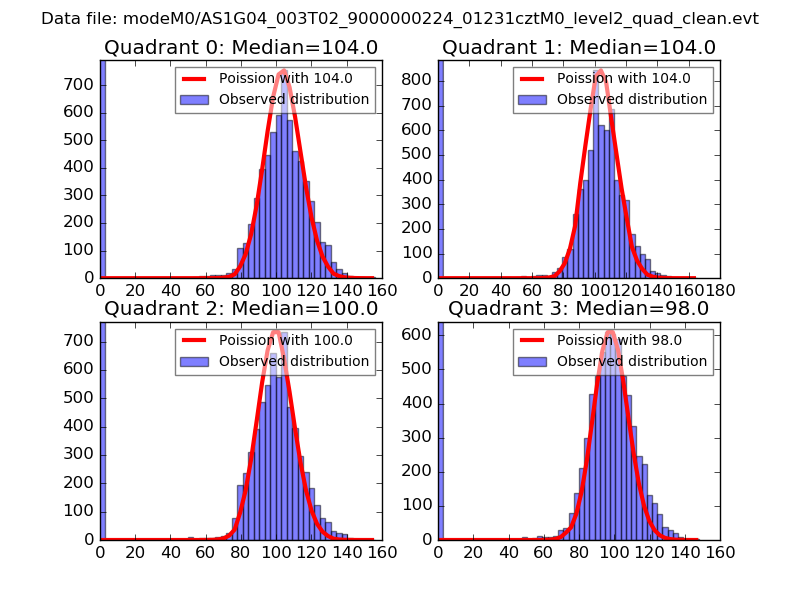 |
 |
| Quadrant-wise count rates Data is divided into 100 sec bins |
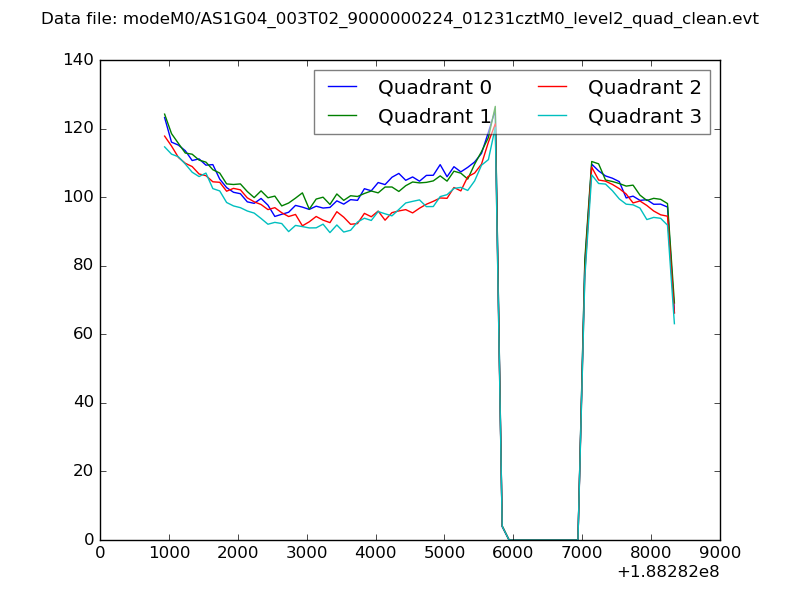 |
|
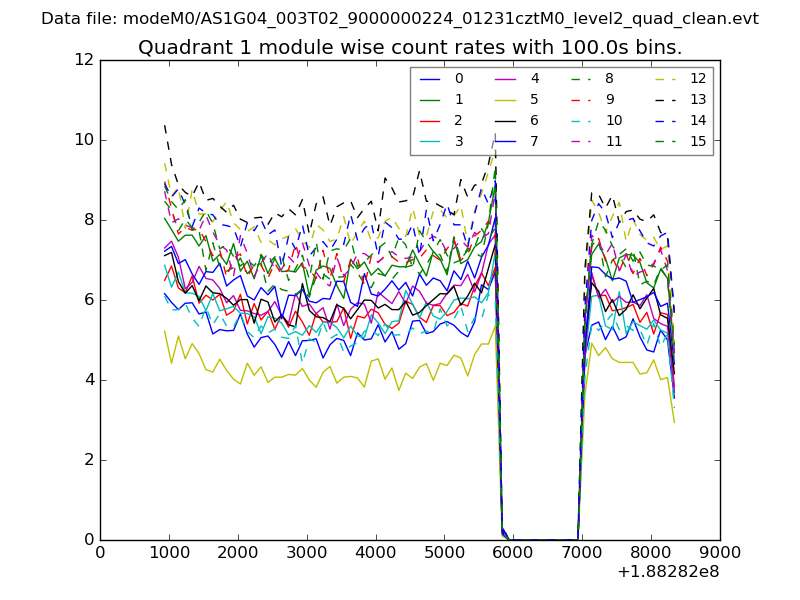
| Module-wise count rates for Quadrant A Data is divided into 100 sec bins |
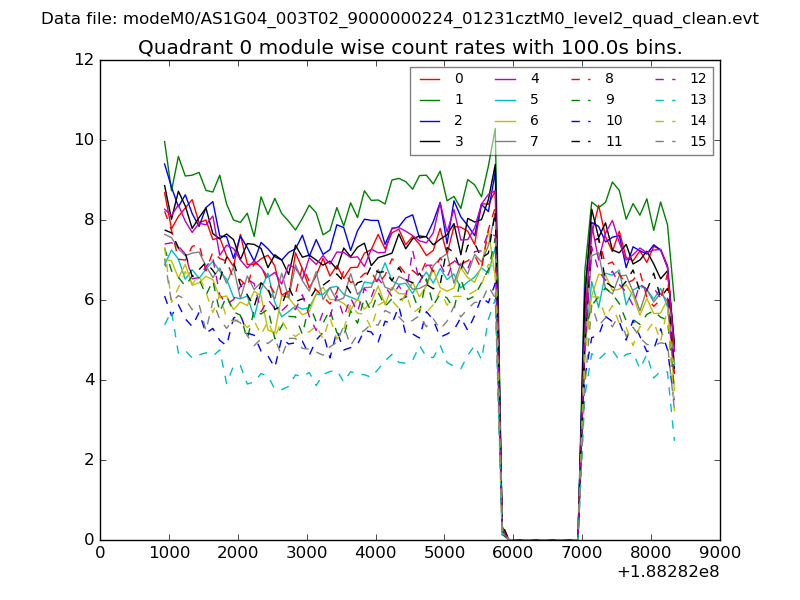 |
 |
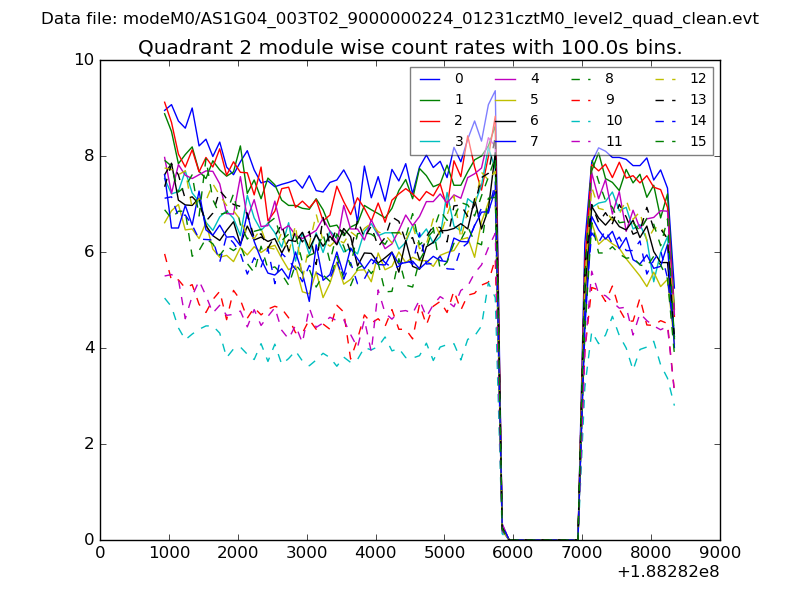
| Module-wise count rates for Quadrant B Data is divided into 100 sec bins |
 |
 |
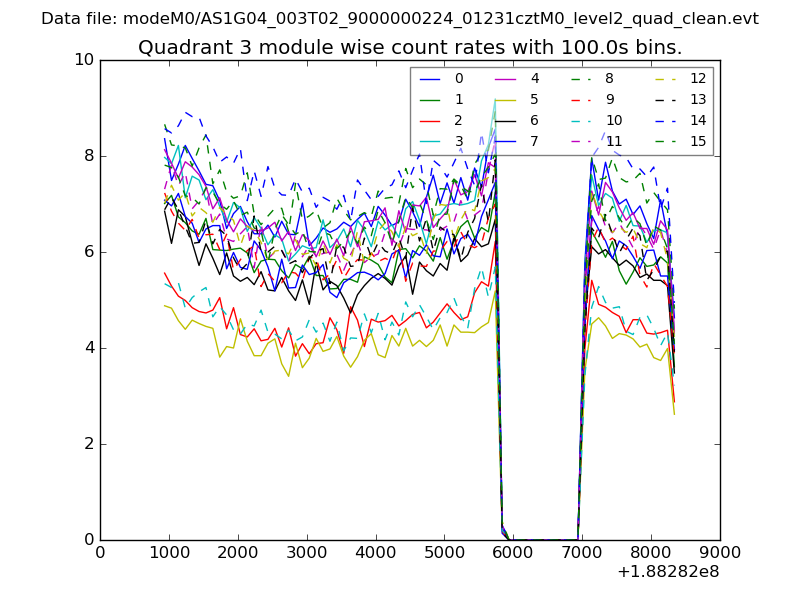
| Module-wise count rates for Quadrant C Data is divided into 100 sec bins |
 |
 |
| Module-wise count rates for Quadrant D Data is divided into 100 sec bins |
 |
 |
| Parameter | Plot |
|---|---|
| CZT HV Monitor | 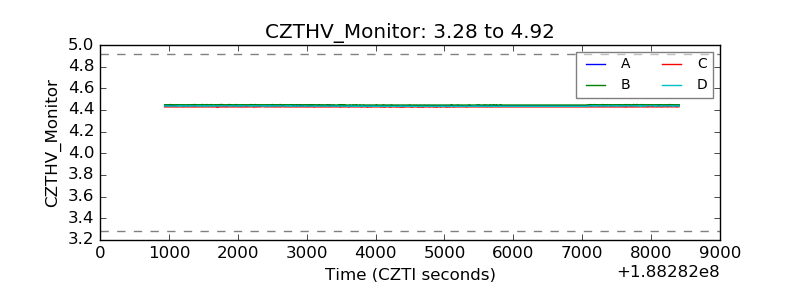 |
| D_VDD | 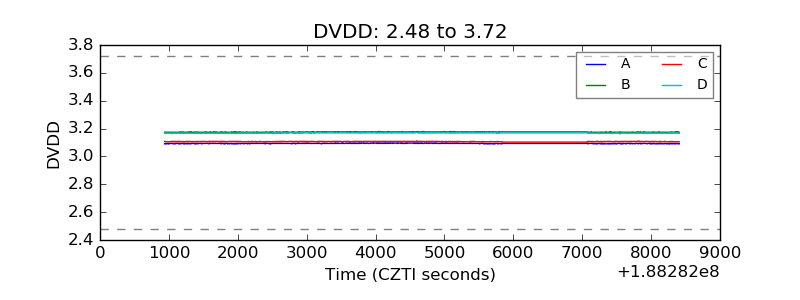 |
| Temperature 1 | 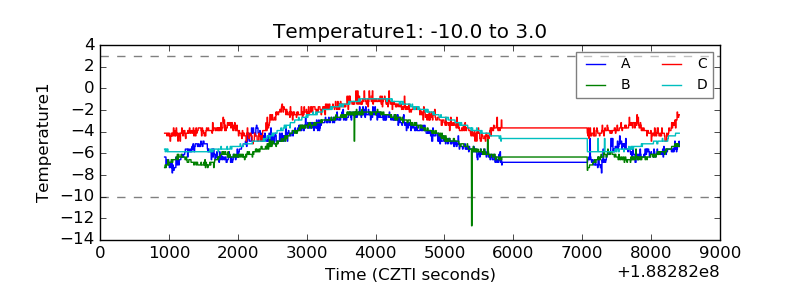 |
| Veto HV Monitor | 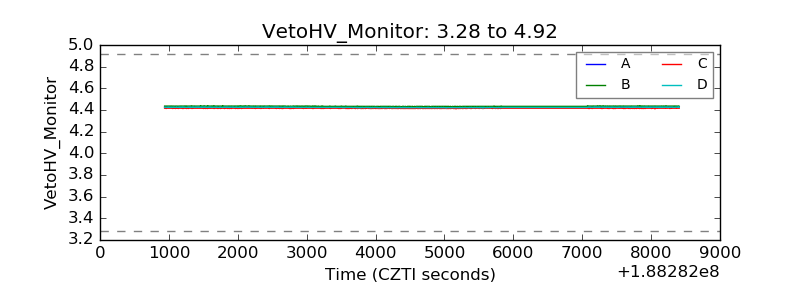 |
| Veto LLD | 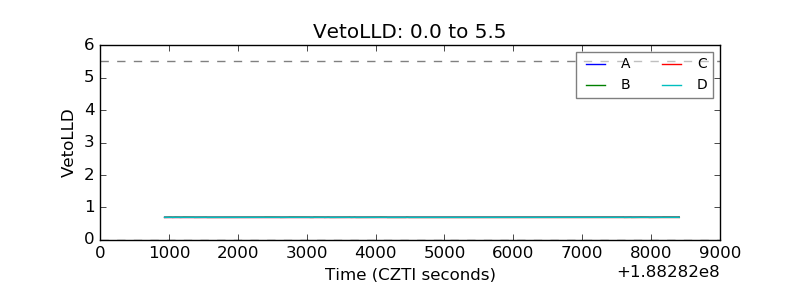 |
| Alpha Counter | 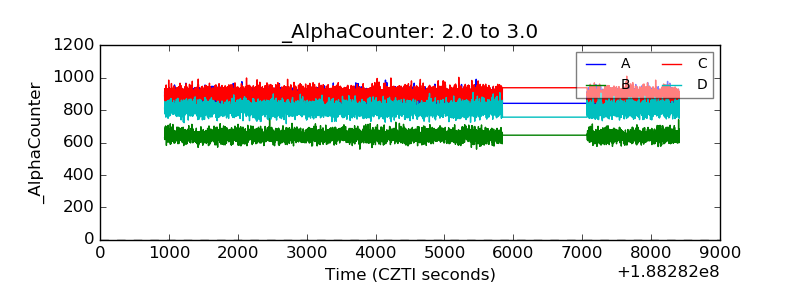 |
| _CPM_Rate | 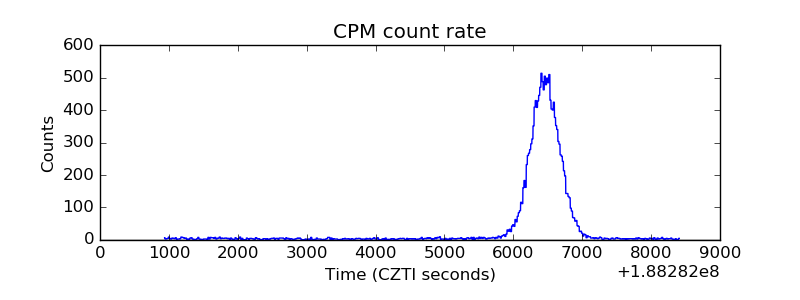 |
| CZT Counter | 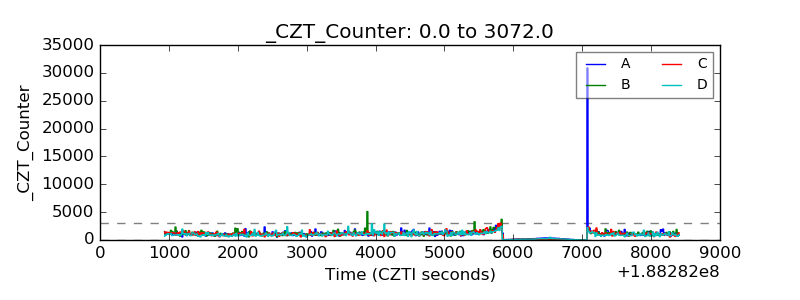 |
| +2.5 Volts monitor |  |
| +5 Volts monitor |  |
| _ROLL_ROT | 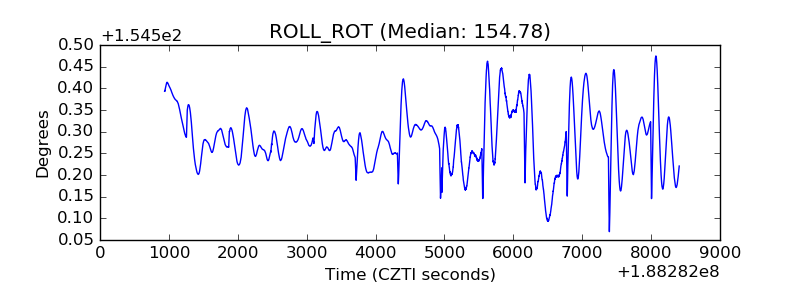 |
| _Roll_DEC | 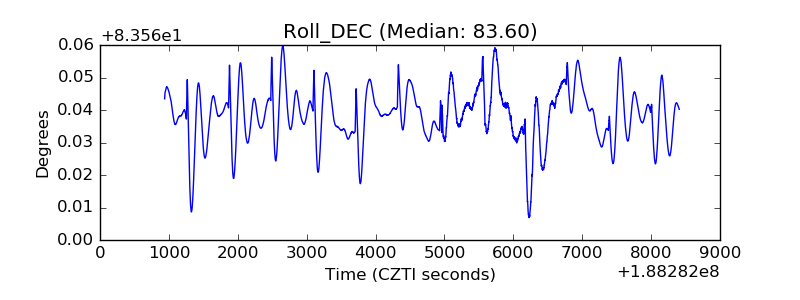 |
| _Roll_RA | 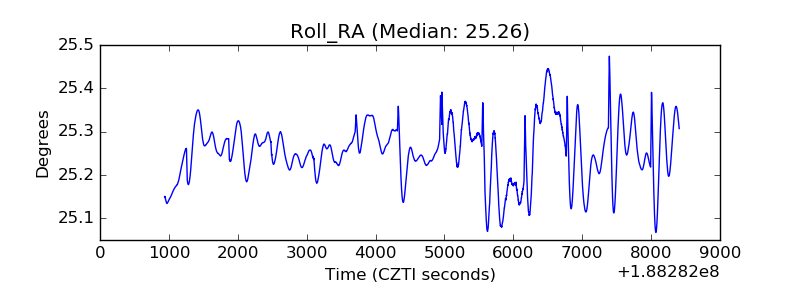 |
| Veto Counter | 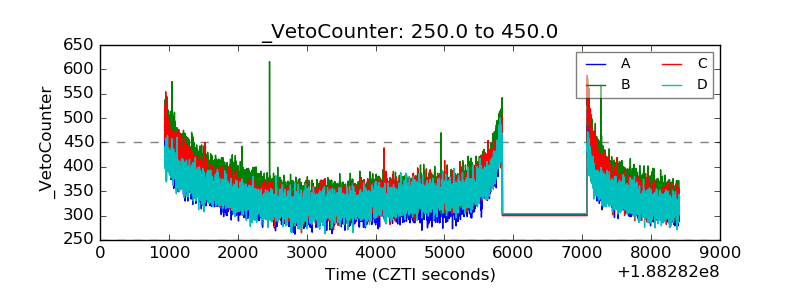 |