| Param | Original file | Final file |
|---|---|---|
| Filename | modeM0/AS1G04_003T02_9000000224_01234cztM0_level2.evt | modeM0/AS1G04_003T02_9000000224_01234cztM0_level2_quad_clean.evt |
| Size (bytes) | 423,270,720 | 38,859,840 |
| Size | 403.7 MB | 37.1 MB |
| Events in quadrant A | 3,115,558 | 254,745 |
| Events in quadrant B | 3,259,448 | 253,354 |
| Events in quadrant C | 3,000,370 | 239,704 |
| Events in quadrant D | 3,262,574 | 235,921 |
| Mode M0 | |||
|---|---|---|---|
| Quadrant | BADHDUFLAG | Total packets | Discarded packets |
| A | 0 | 11141 | 0 |
| B | 0 | 11598 | 0 |
| C | 0 | 10836 | 0 |
| D | 0 | 11602 | 0 |
| Mode SS | |||
|---|---|---|---|
| Quadrant | BADHDUFLAG | Total packets | Discarded packets |
| A | 0 | 54 | 0 |
| B | 0 | 54 | 0 |
| C | 0 | 54 | 0 |
| D | 0 | 54 | 0 |
| Quadrant | Total seconds | Saturated seconds | Saturation percentage |
|---|---|---|---|
| A | 2689 | 18 | 0.669394% |
| B | 2689 | 17 | 0.632205% |
| C | 2689 | 0 | 0.000000% |
| D | 2689 | 4 | 0.148754% |
Noise dominated data is calculated using 1-second bins in cleaned event files. If a bin has >2000 counts, and if more than 50% of those come from <1% of pixels, then it is considered to be noise-dominated and hence unusable.
| Quadrant | # 1 sec bins | Bins with >0 counts | Bins with >2000 counts | High rate bins dominated by noise | Noise dominated (total time) | Noise dominated (detector-on time) | Marked lightcurve |
|---|---|---|---|---|---|---|---|
| A | 2689 | 2689 | 58 | 58 | 2.16% | 2.16% | 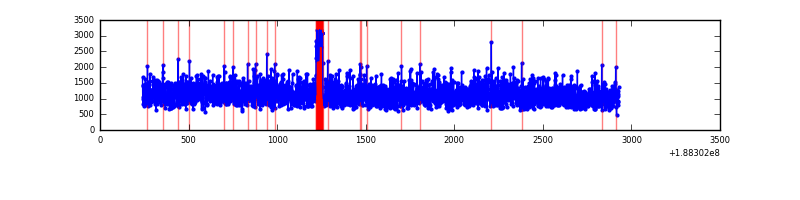 |
| B | 2689 | 2689 | 68 | 68 | 2.53% | 2.53% | 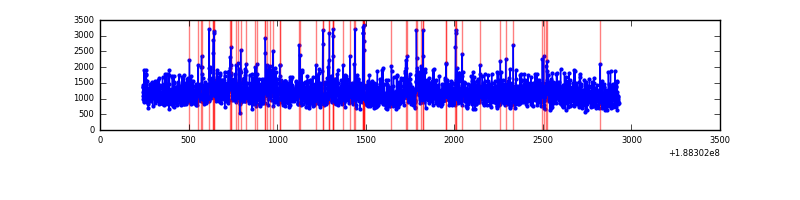 |
| C | 2689 | 2689 | 20 | 20 | 0.74% | 0.74% | 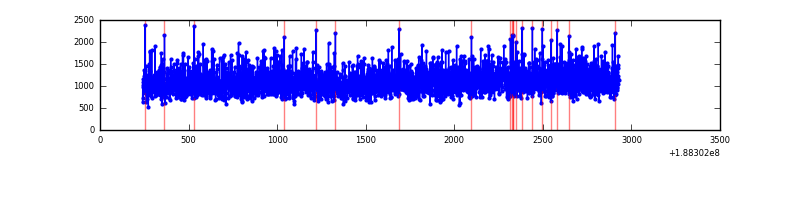 |
| D | 2689 | 2689 | 121 | 121 | 4.50% | 4.50% | 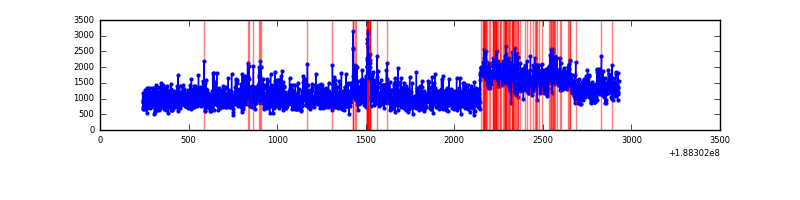 |
Top three noisy pixels from each quadrant. If the there are fewer than three noisy pixels in the level2.evt file, extra rows are filled as -1
| Pixel properties | Quadrant properties | ||||||
|---|---|---|---|---|---|---|---|
| Quadrant | DetID | PixID | Counts | Sigma | Mean | Median | Sigma |
| A | 12 | 133 | 68969 | 362.86 | 781 | 786 | 187.9 |
| A | 3 | 80 | 26770 | 138.28 | 781 | 786 | 187.9 |
| A | 12 | 243 | 20764 | 106.32 | 781 | 786 | 187.9 |
| B | 6 | 53 | 108020 | 576.44 | 785 | 788 | 186.0 |
| B | 15 | 22 | 85482 | 455.29 | 785 | 788 | 186.0 |
| B | 5 | 249 | 28880 | 151.01 | 785 | 788 | 186.0 |
| C | 15 | 241 | 143793 | 704.37 | 723 | 748 | 203.1 |
| C | 3 | 79 | 14413 | 67.29 | 723 | 748 | 203.1 |
| C | 3 | 111 | 11097 | 50.96 | 723 | 748 | 203.1 |
| D | 1 | 239 | 409907 | 1817.1 | 728 | 753 | 225.2 |
| D | 10 | 84 | 102546 | 452.07 | 728 | 753 | 225.2 |
| D | 1 | 83 | 11734 | 48.77 | 728 | 753 | 225.2 |
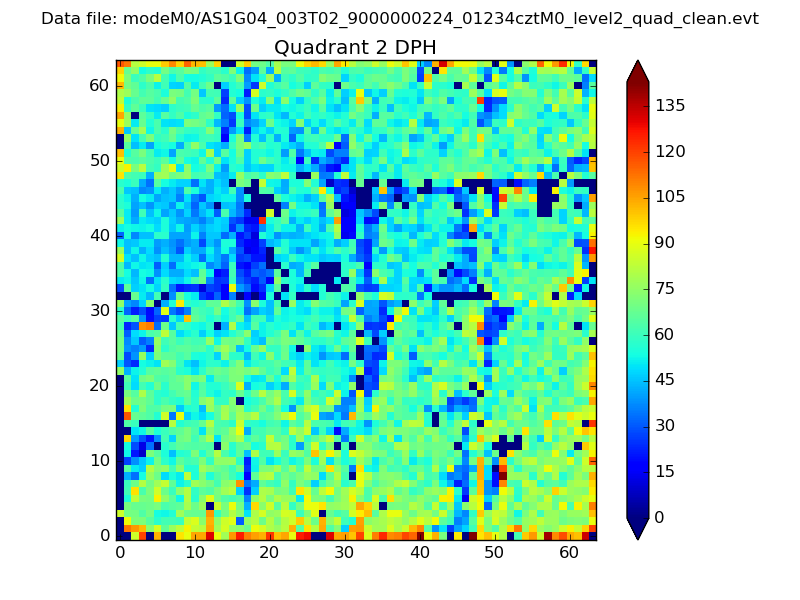
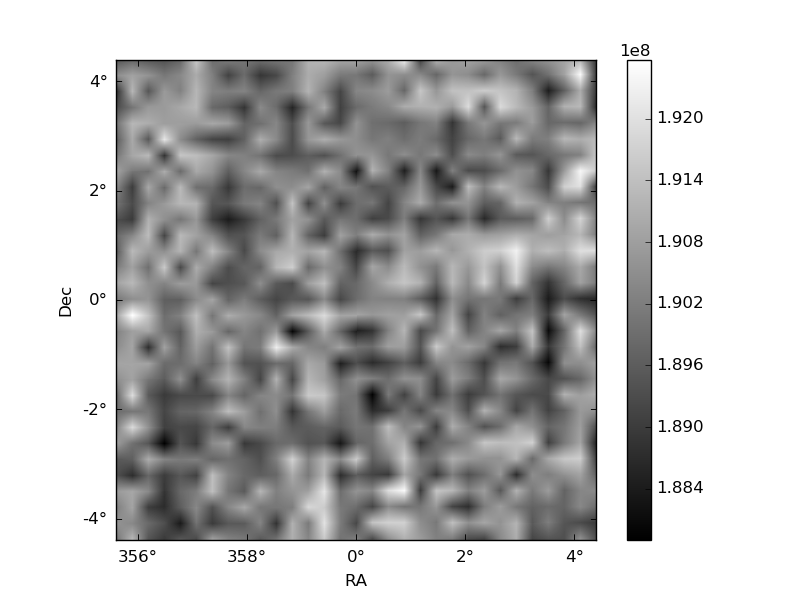
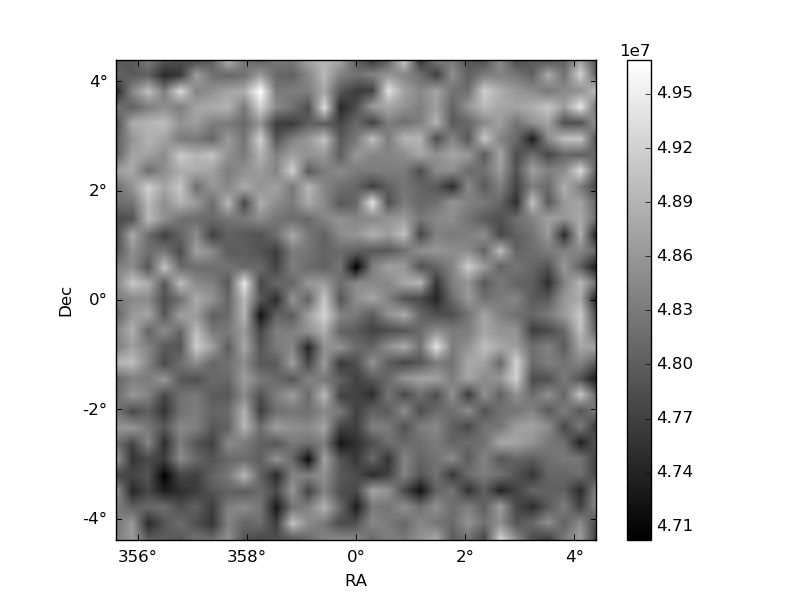
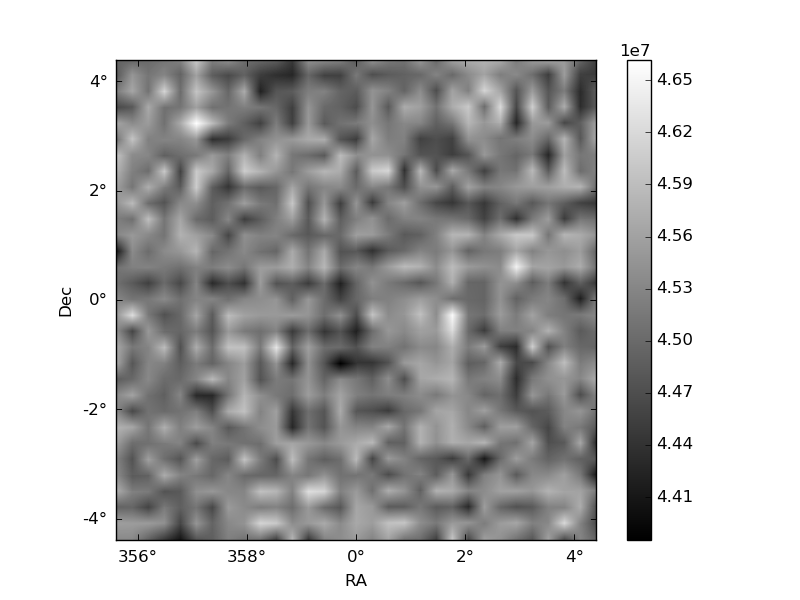
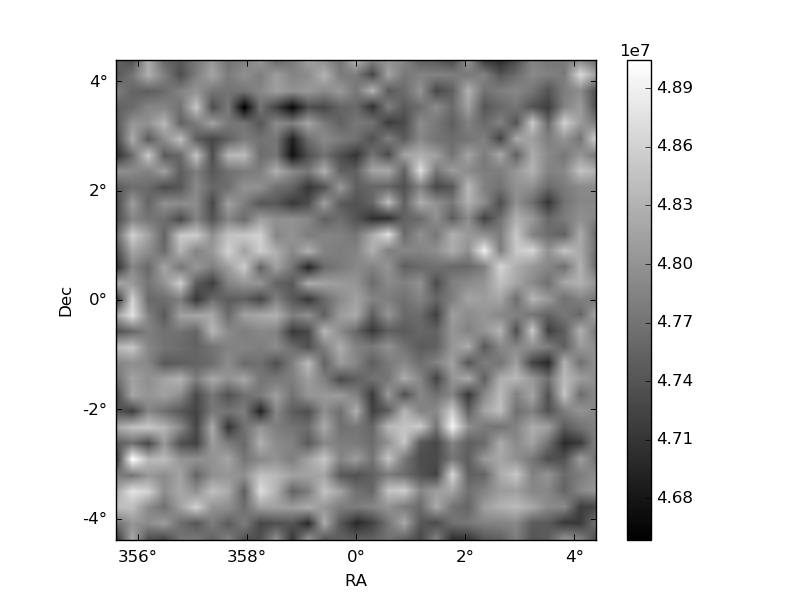
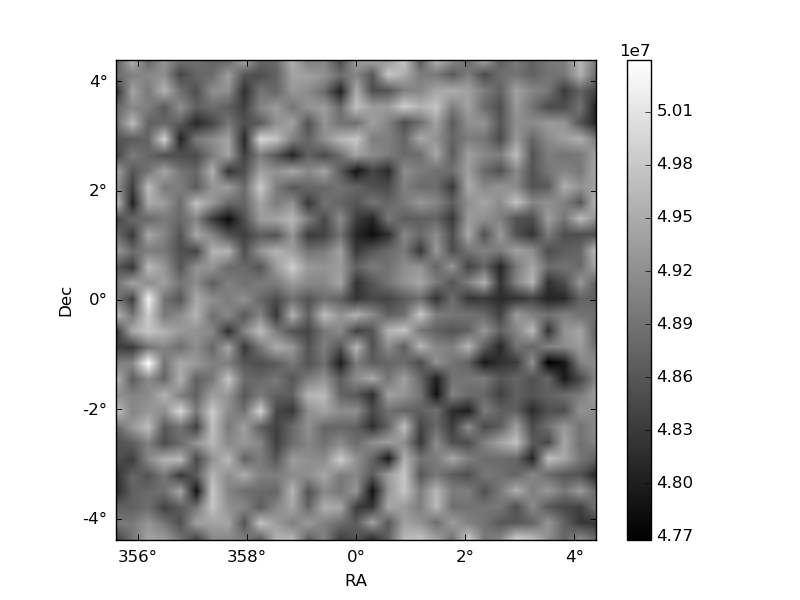
Histogram calculated using DETX and DETY for each event in the final _common_clean file
| Quadrant A | 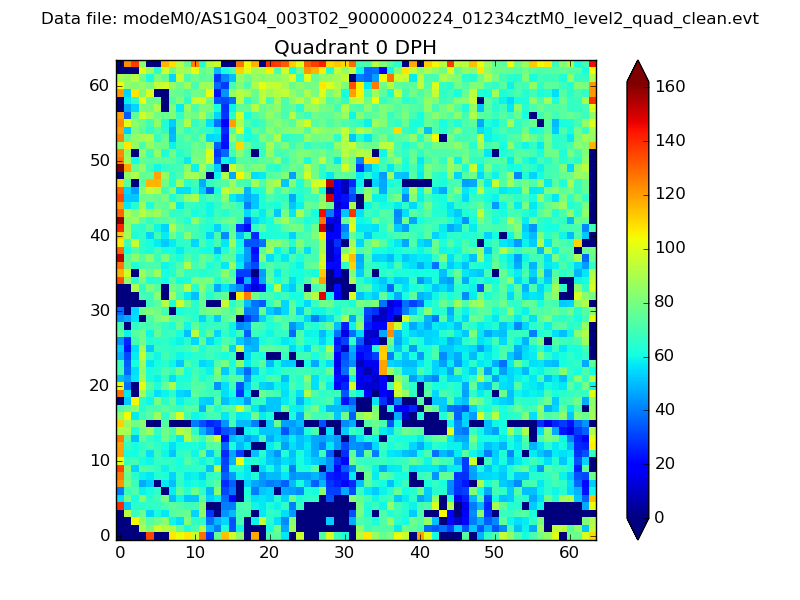 |
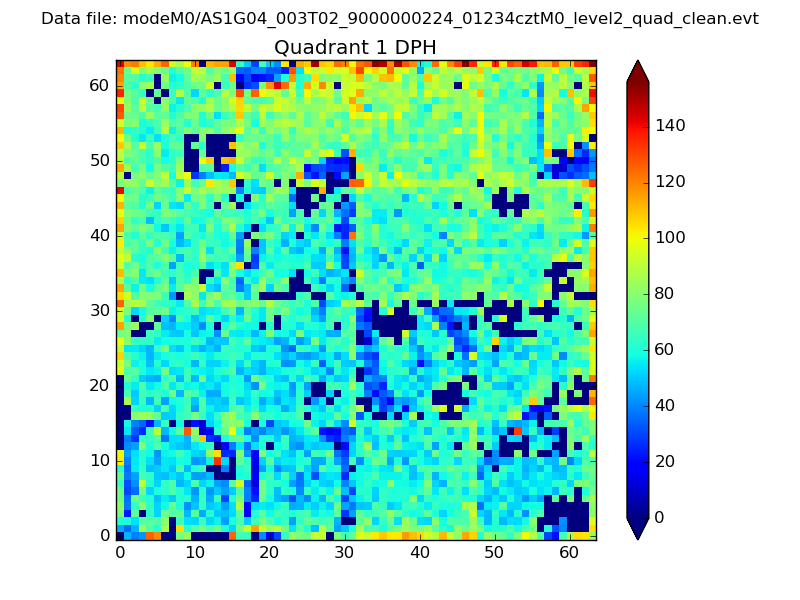 |
Quadrant B |
|---|---|---|---|
| Quadrant D | 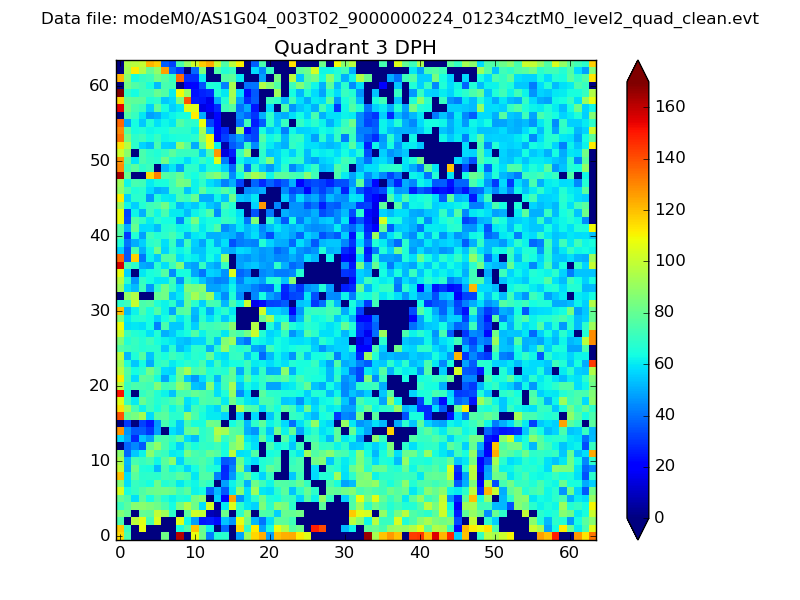 |
 |
Quadrant C |
| Plot type | Count rate plots | Images |
|---|---|---|
| Comparison with Poisson distribution Blue bars denote a histogram of data divided into 1 sec bins. Red curve is a Poisson curve with rate = median count rate of data. |
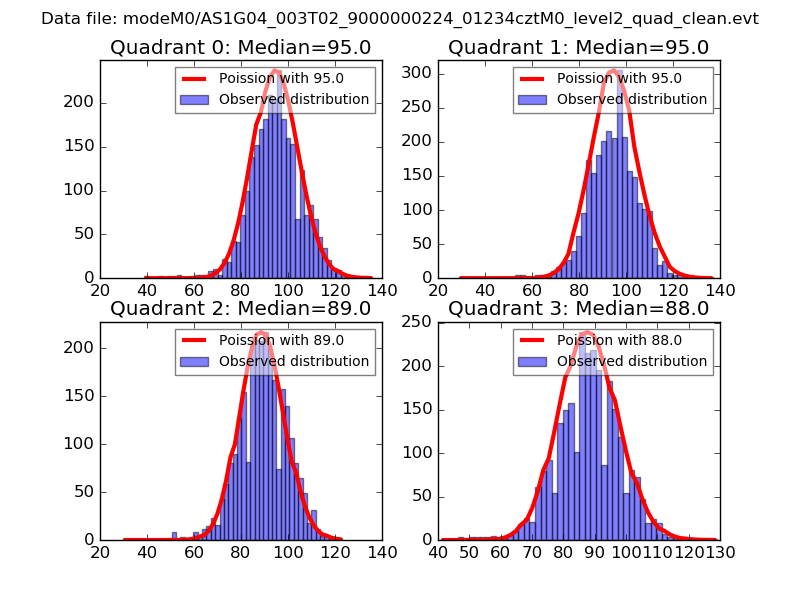 |
 |
| Quadrant-wise count rates Data is divided into 100 sec bins |
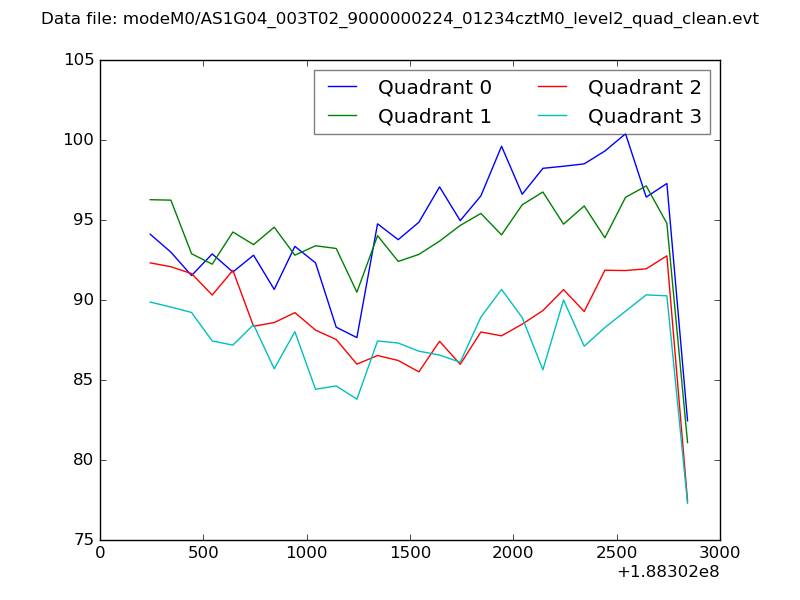 |
|
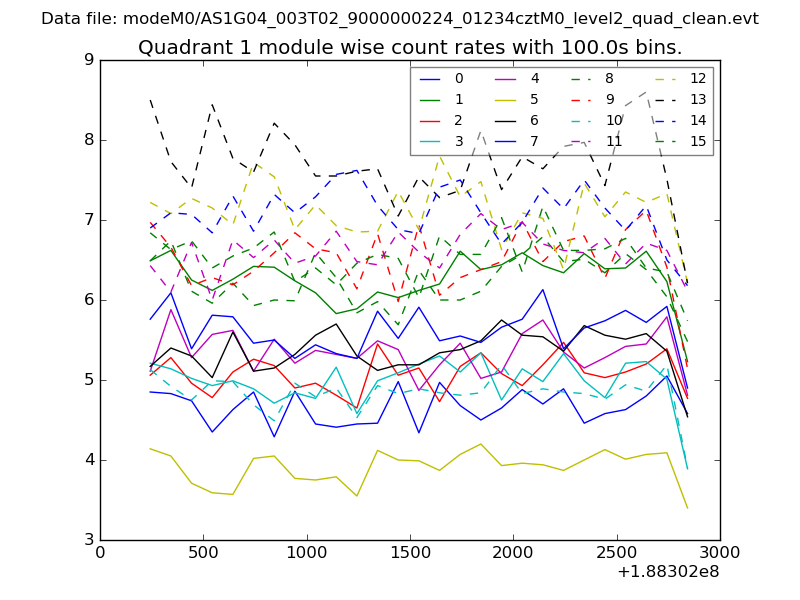
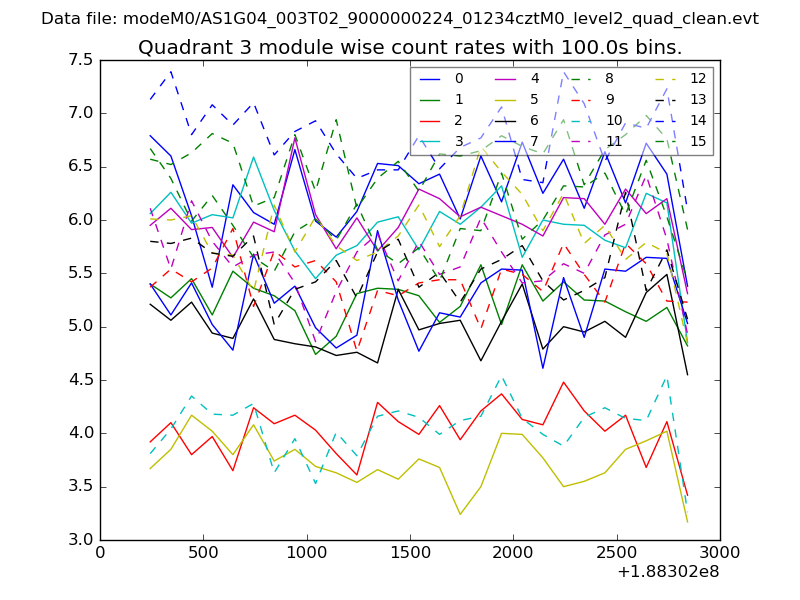
| Module-wise count rates for Quadrant A Data is divided into 100 sec bins |
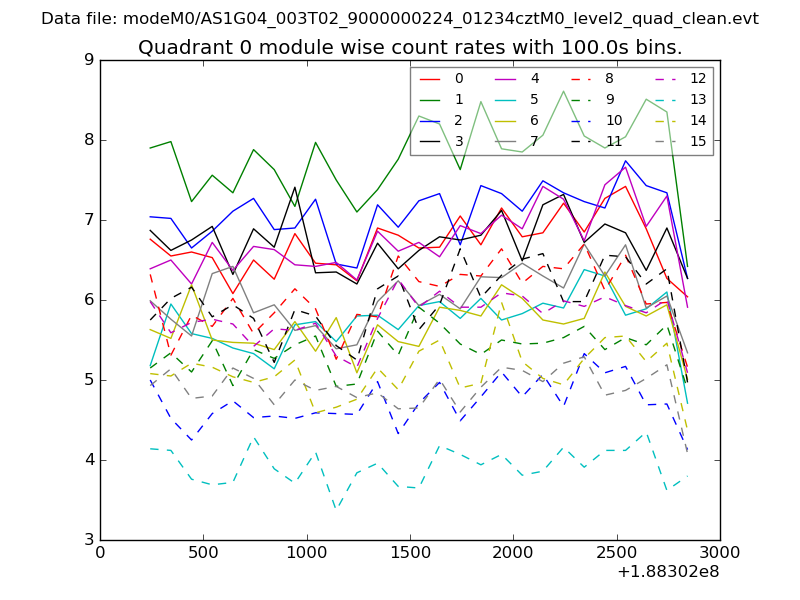 |
 |
| Module-wise count rates for Quadrant B Data is divided into 100 sec bins |
 |
 |
| Module-wise count rates for Quadrant C Data is divided into 100 sec bins |
 |
 |
| Module-wise count rates for Quadrant D Data is divided into 100 sec bins |
 |
 |
| Parameter | Plot |
|---|---|
| CZT HV Monitor | 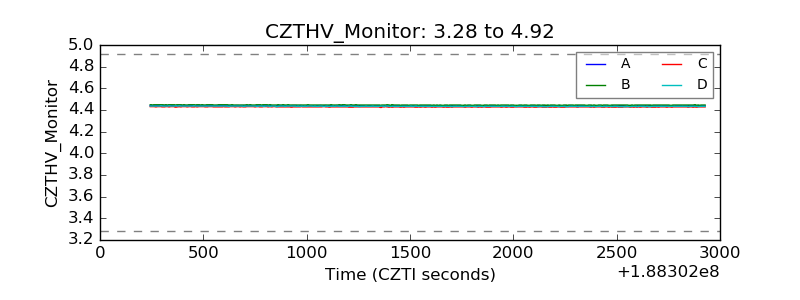 |
| D_VDD | 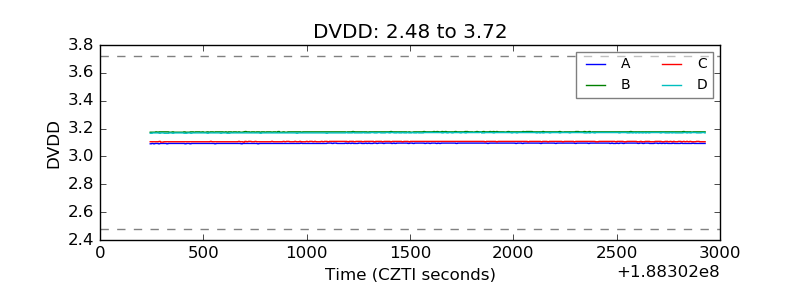 |
| Temperature 1 | 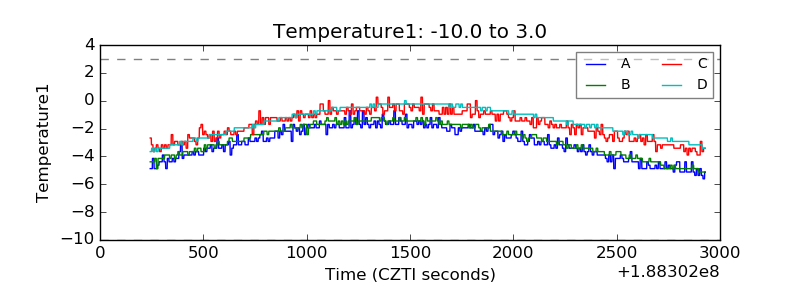 |
| Veto HV Monitor | 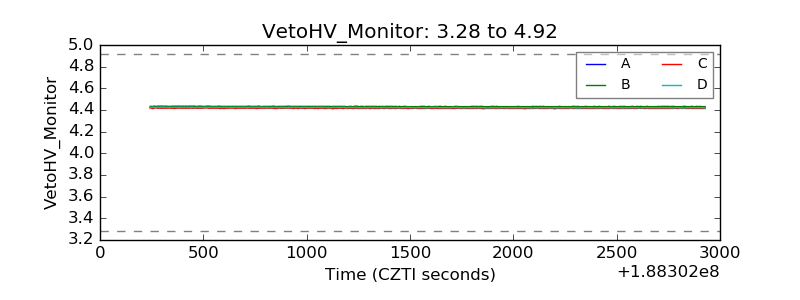 |
| Veto LLD | 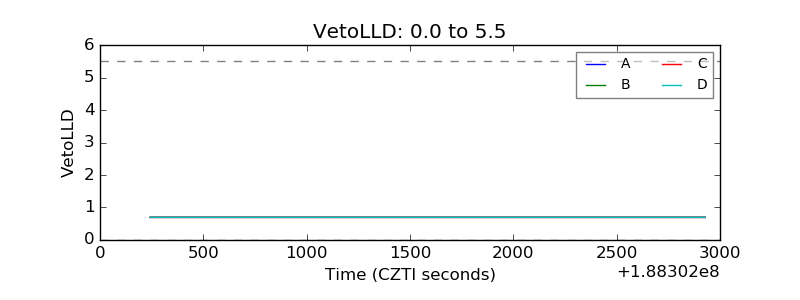 |
| Alpha Counter | 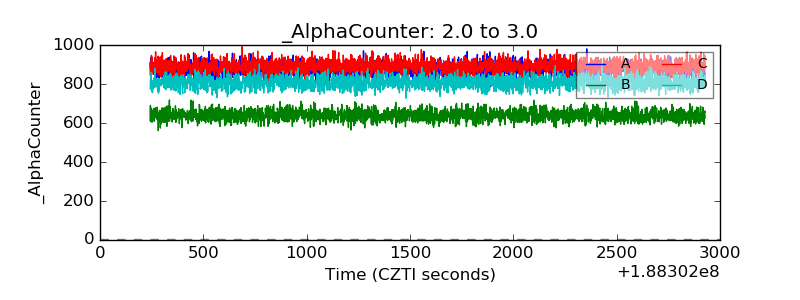 |
| _CPM_Rate | 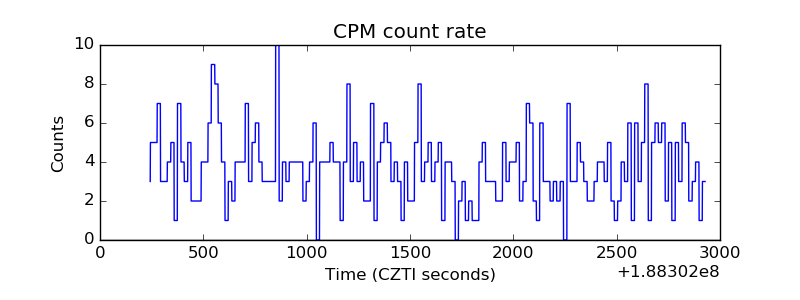 |
| CZT Counter | 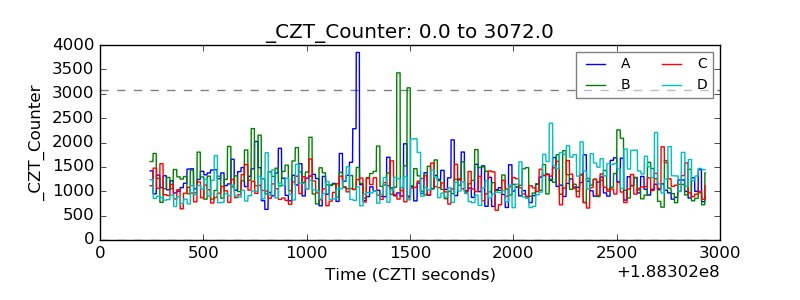 |
| +2.5 Volts monitor |  |
| +5 Volts monitor |  |
| _ROLL_ROT | 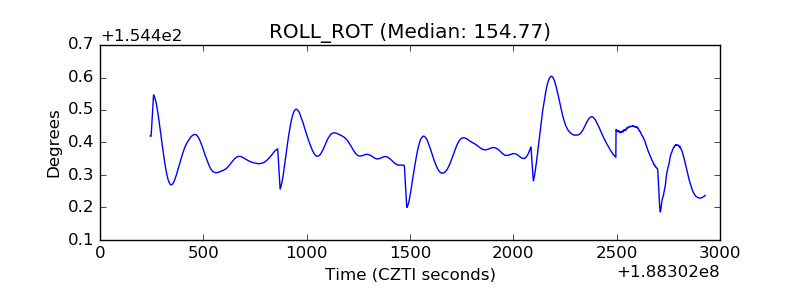 |
| _Roll_DEC | 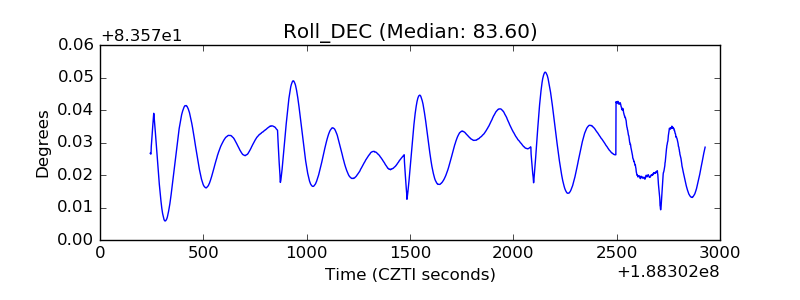 |
| _Roll_RA | 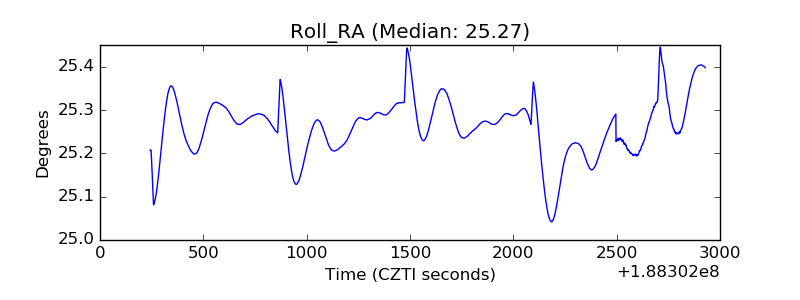 |
| Veto Counter | 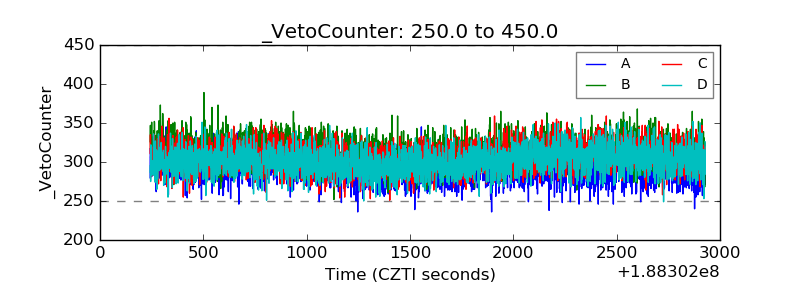 |