| Param | Original file | Final file |
|---|---|---|
| Filename | modeM0/AS1G04_011T02_9000000226_01234cztM0_level2.evt | modeM0/AS1G04_011T02_9000000226_01234cztM0_level2_quad_clean.evt |
| Size (bytes) | 617,114,880 | 48,182,400 |
| Size | 588.5 MB | 46.0 MB |
| Events in quadrant A | 4,112,958 | 320,895 |
| Events in quadrant B | 6,465,663 | 289,892 |
| Events in quadrant C | 4,137,898 | 316,137 |
| Events in quadrant D | 3,770,877 | 314,896 |
| Mode SS | |||
|---|---|---|---|
| Quadrant | BADHDUFLAG | Total packets | Discarded packets |
| A | 0 | 60 | 0 |
| B | 0 | 60 | 0 |
| C | 0 | 60 | 0 |
| D | 0 | 60 | 0 |
| Mode M0 | |||
|---|---|---|---|
| Quadrant | BADHDUFLAG | Total packets | Discarded packets |
| A | 0 | 14353 | 1 |
| B | 0 | 21402 | 0 |
| C | 0 | 14430 | 0 |
| D | 0 | 13363 | 0 |
| Quadrant | Total seconds | Saturated seconds | Saturation percentage |
|---|---|---|---|
| A | 3045 | 9 | 0.295567% |
| B | 3045 | 574 | 18.850575% |
| C | 3045 | 1 | 0.032841% |
| D | 3045 | 0 | 0.000000% |
Noise dominated data is calculated using 1-second bins in cleaned event files. If a bin has >2000 counts, and if more than 50% of those come from <1% of pixels, then it is considered to be noise-dominated and hence unusable.
| Quadrant | # 1 sec bins | Bins with >0 counts | Bins with >2000 counts | High rate bins dominated by noise | Noise dominated (total time) | Noise dominated (detector-on time) | Marked lightcurve |
|---|---|---|---|---|---|---|---|
| A | 3045 | 3045 | 245 | 245 | 8.05% | 8.05% | 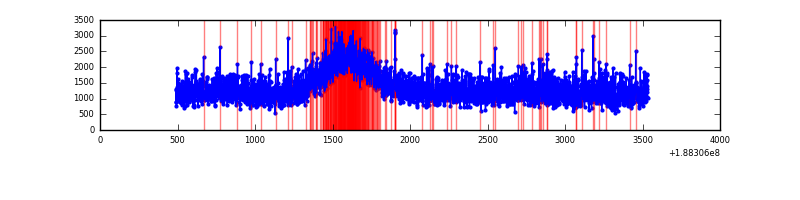 |
| B | 3045 | 3045 | 1546 | 1546 | 50.77% | 50.77% | 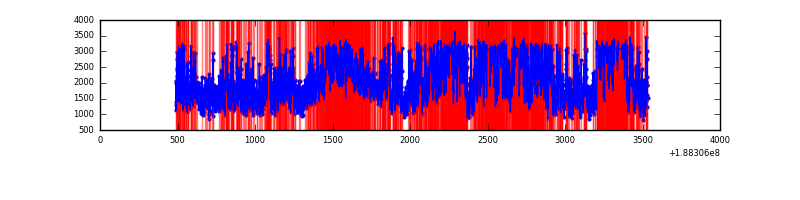 |
| C | 3045 | 3045 | 234 | 234 | 7.68% | 7.68% | 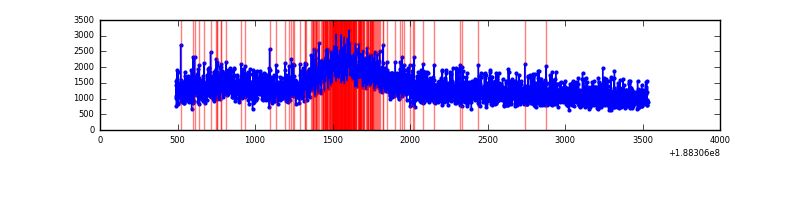 |
| D | 3045 | 3045 | 144 | 144 | 4.73% | 4.73% | 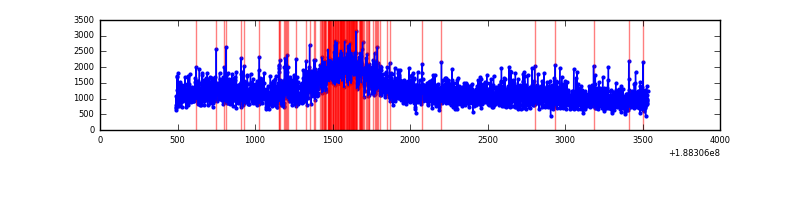 |
Top three noisy pixels from each quadrant. If the there are fewer than three noisy pixels in the level2.evt file, extra rows are filled as -1
| Pixel properties | Quadrant properties | ||||||
|---|---|---|---|---|---|---|---|
| Quadrant | DetID | PixID | Counts | Sigma | Mean | Median | Sigma |
| A | 3 | 80 | 22584 | 83.91 | 1059 | 1061 | 256.5 |
| A | 12 | 243 | 16299 | 59.4 | 1059 | 1061 | 256.5 |
| A | 13 | 9 | 7128 | 23.65 | 1059 | 1061 | 256.5 |
| B | 2 | 32 | 2364539 | 9619.62 | 1025 | 1026 | 245.7 |
| B | 5 | 200 | 95147 | 383.08 | 1025 | 1026 | 245.7 |
| B | 15 | 22 | 43259 | 171.89 | 1025 | 1026 | 245.7 |
| C | 15 | 241 | 165125 | 577.01 | 1009 | 1043 | 284.4 |
| C | 3 | 79 | 15452 | 50.67 | 1009 | 1043 | 284.4 |
| C | 3 | 111 | 13981 | 45.5 | 1009 | 1043 | 284.4 |
| D | 10 | 84 | 17527 | 52.78 | 1003 | 1037 | 312.4 |
| D | 10 | 85 | 7843 | 21.79 | 1003 | 1037 | 312.4 |
| D | 1 | 255 | 2625 | 5.08 | 1003 | 1037 | 312.4 |
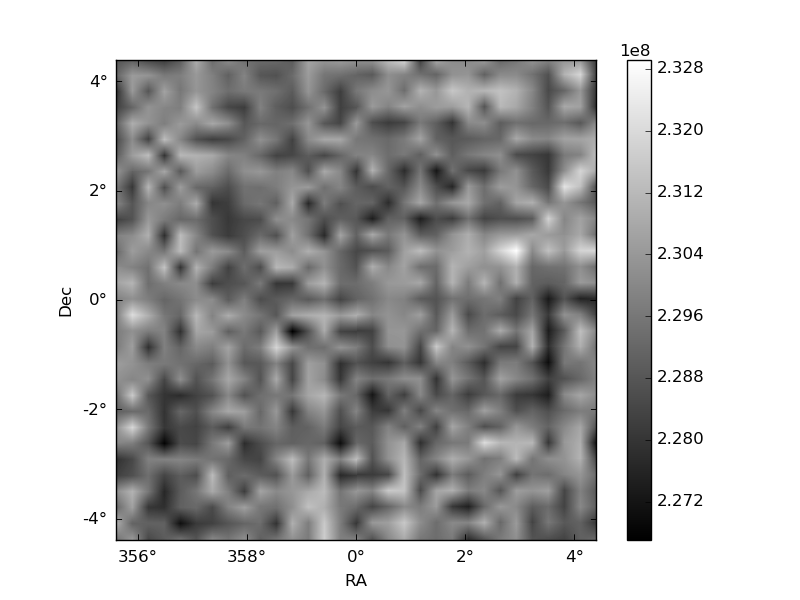
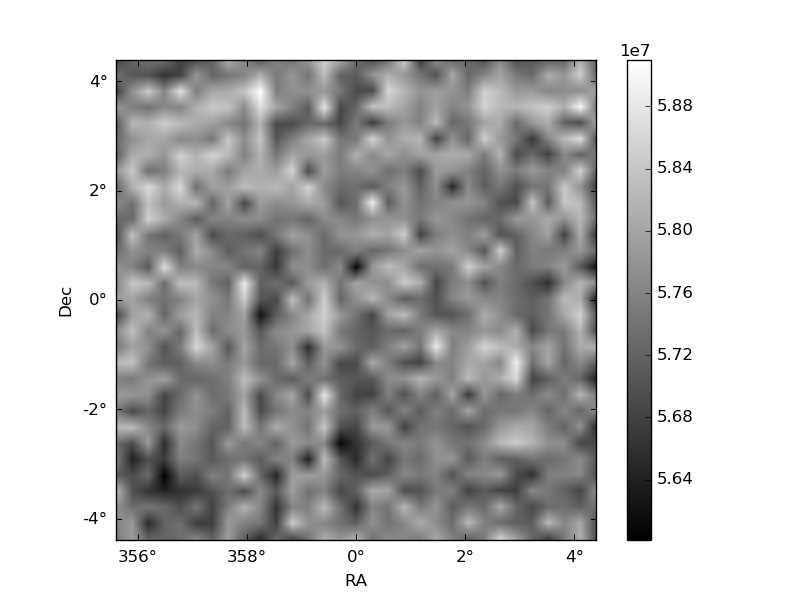
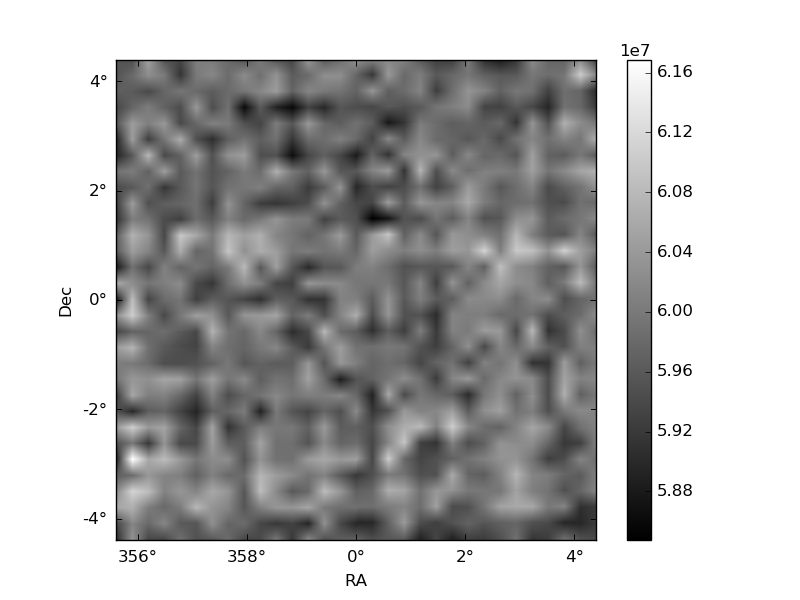
Histogram calculated using DETX and DETY for each event in the final _common_clean file
| Quadrant A | 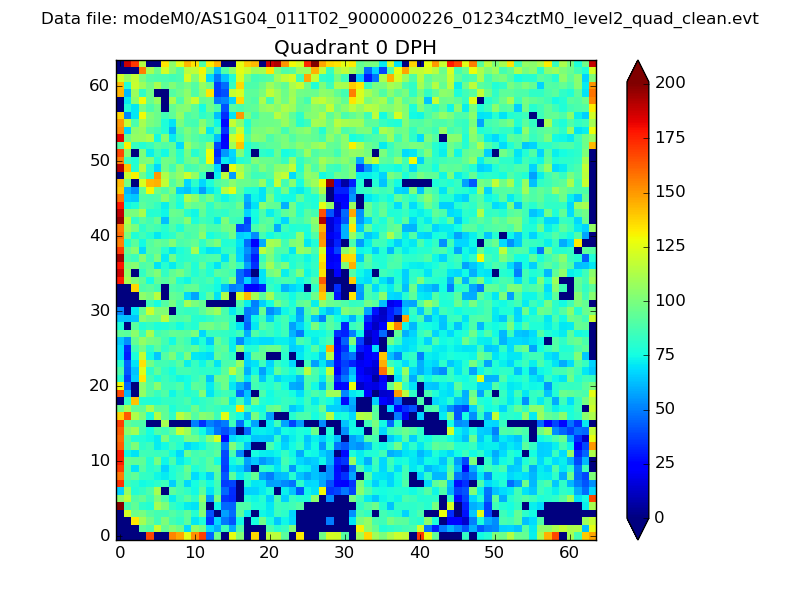 |
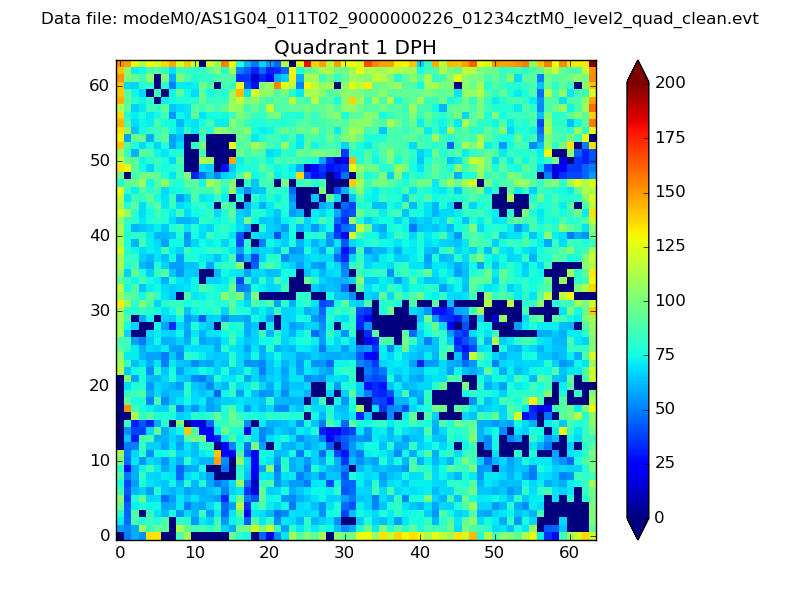 |
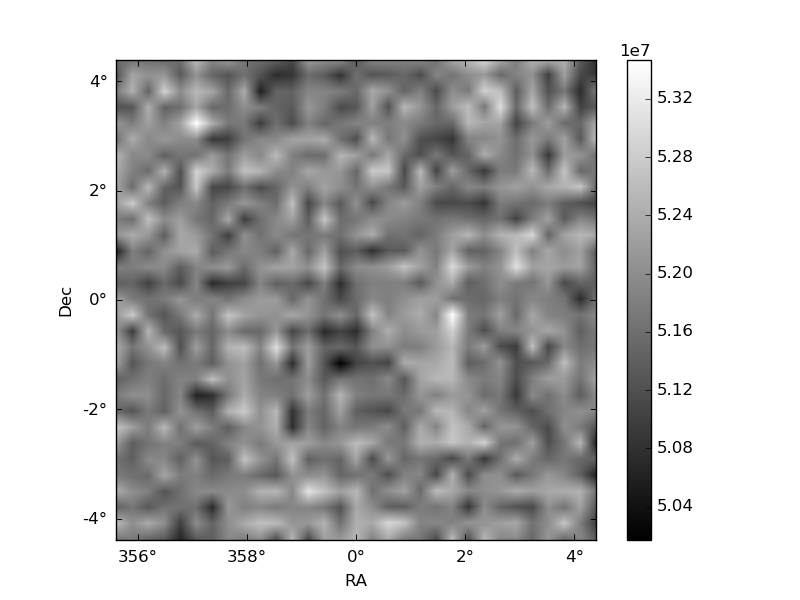
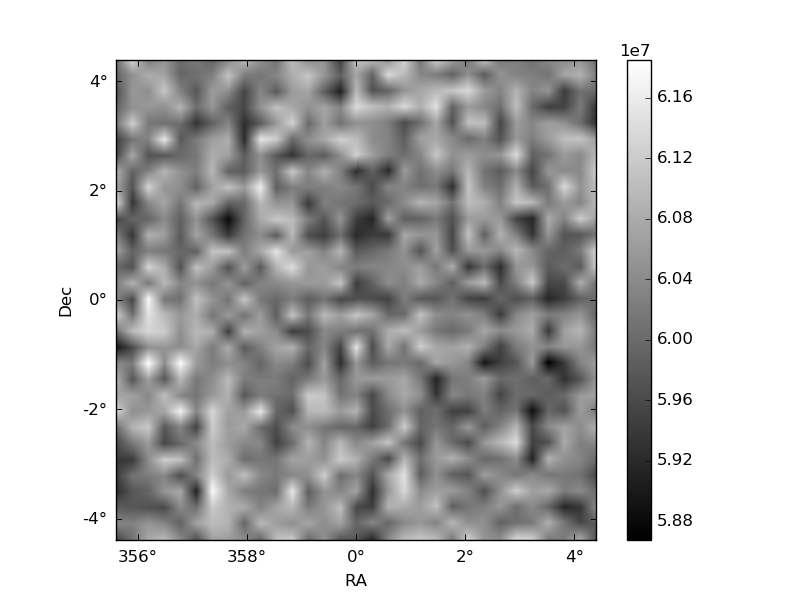
Quadrant B |
|---|---|---|---|
| Quadrant D | 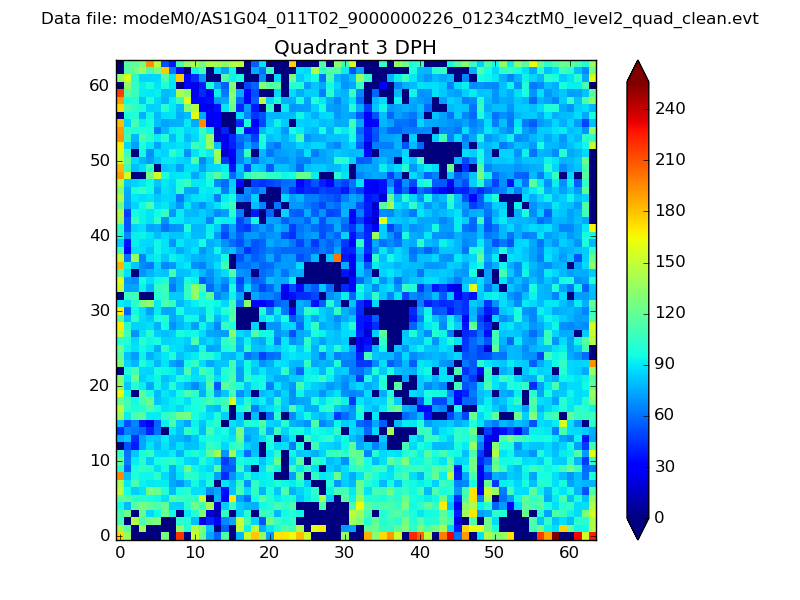 |
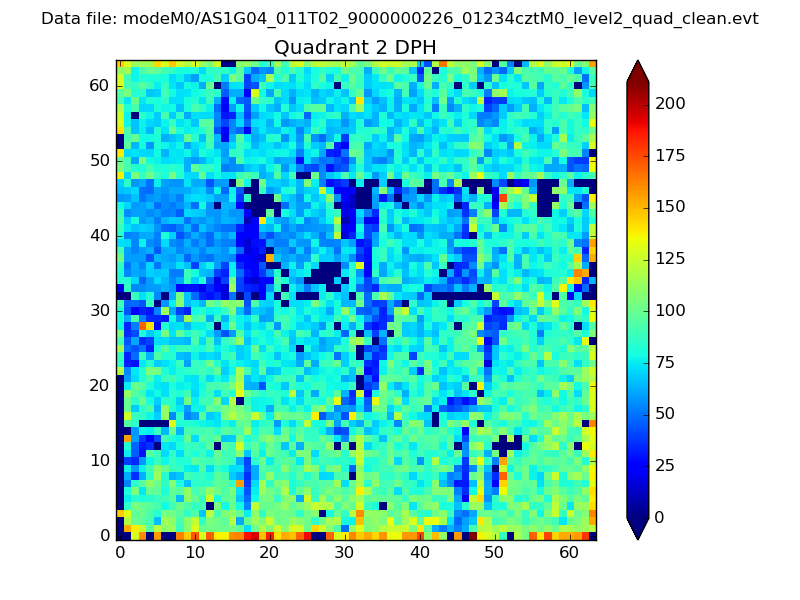 |
Quadrant C |
| Plot type | Count rate plots | Images |
|---|---|---|
| Comparison with Poisson distribution Blue bars denote a histogram of data divided into 1 sec bins. Red curve is a Poisson curve with rate = median count rate of data. |
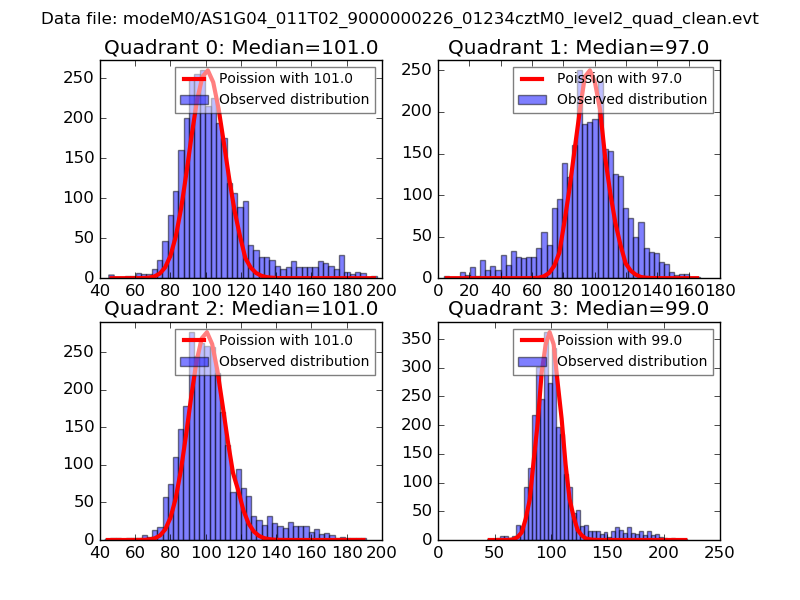 |
 |
| Quadrant-wise count rates Data is divided into 100 sec bins |
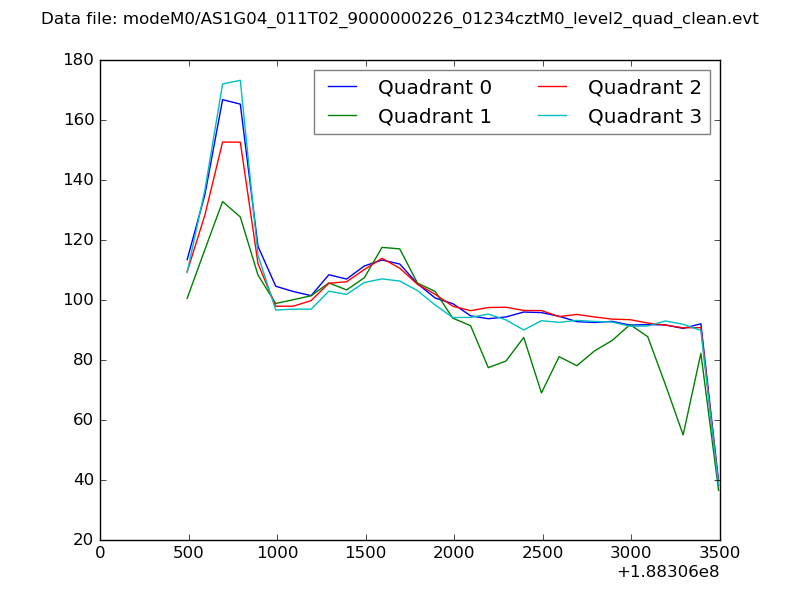 |
|
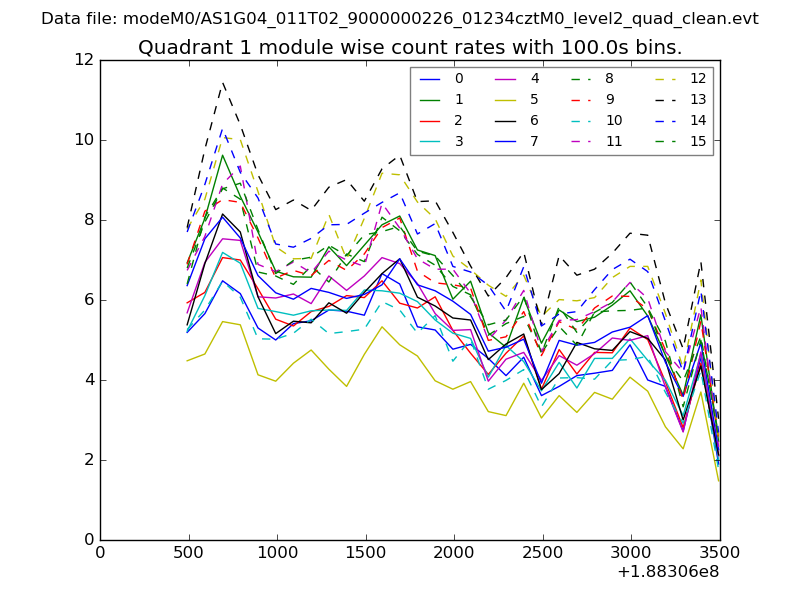
| Module-wise count rates for Quadrant A Data is divided into 100 sec bins |
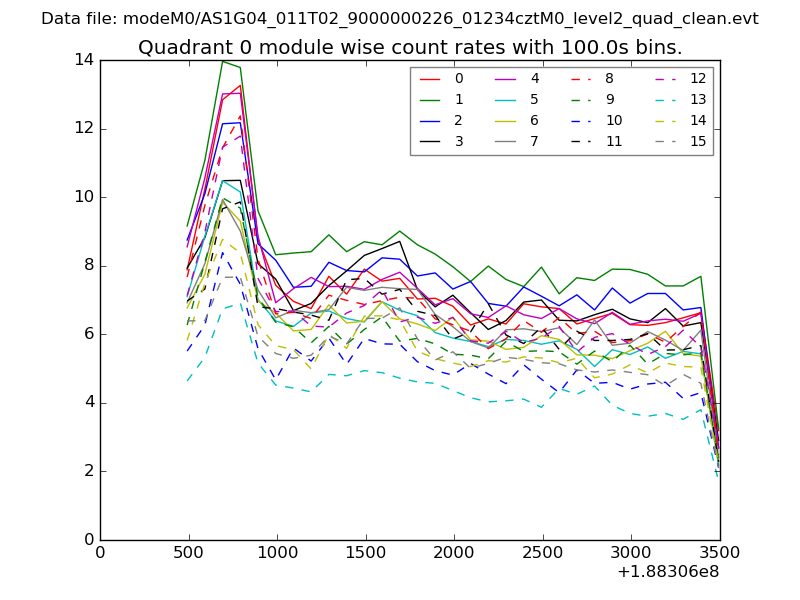 |
 |
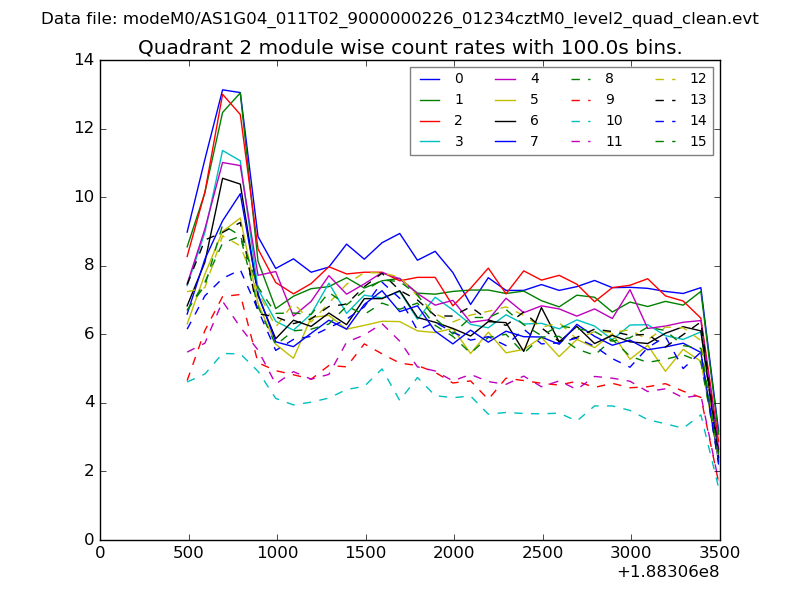
| Module-wise count rates for Quadrant B Data is divided into 100 sec bins |
 |
 |
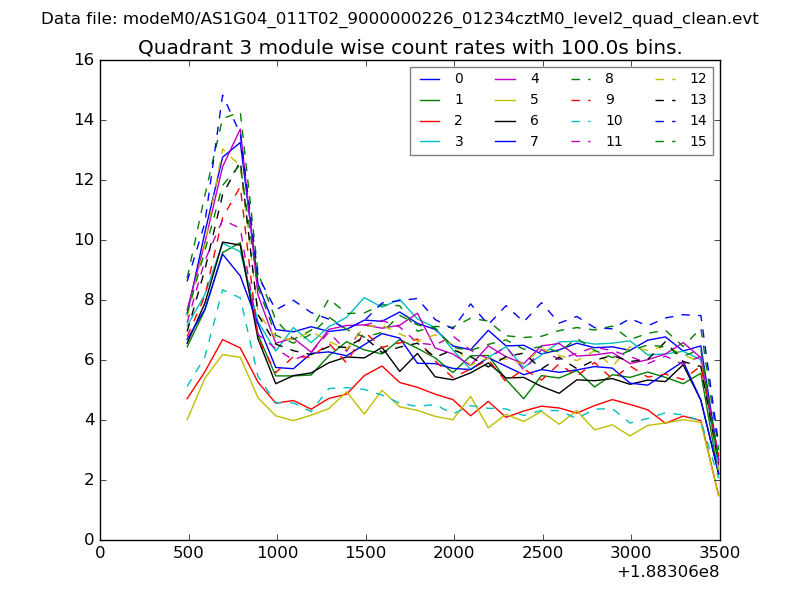
| Module-wise count rates for Quadrant C Data is divided into 100 sec bins |
 |
 |
| Module-wise count rates for Quadrant D Data is divided into 100 sec bins |
 |
 |
| Parameter | Plot |
|---|---|
| CZT HV Monitor | 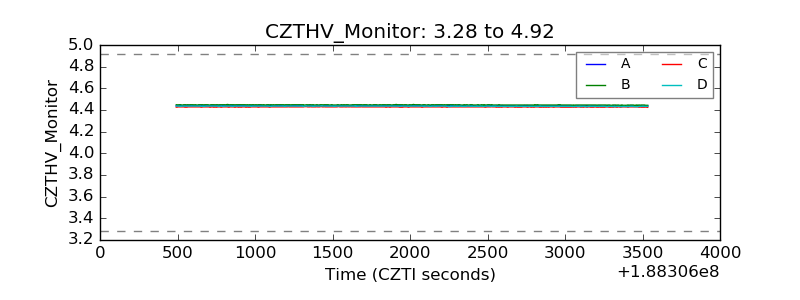 |
| D_VDD | 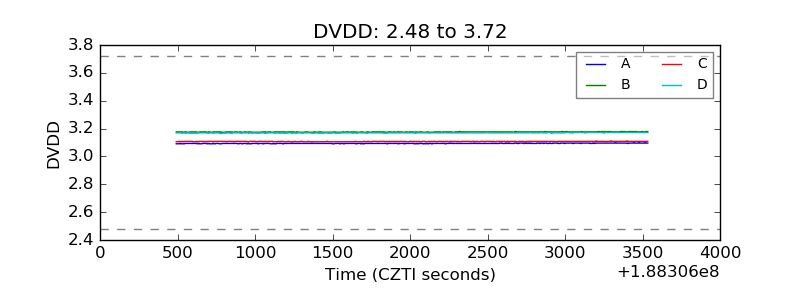 |
| Temperature 1 | 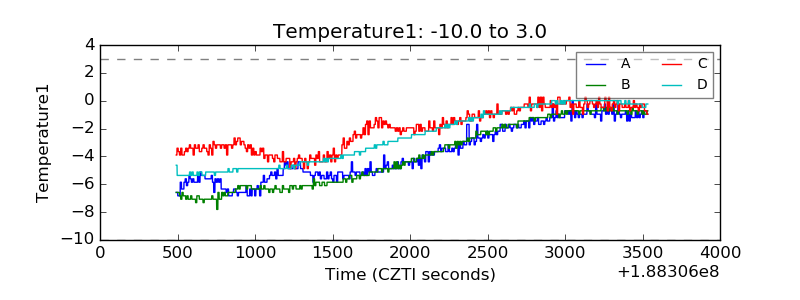 |
| Veto HV Monitor | 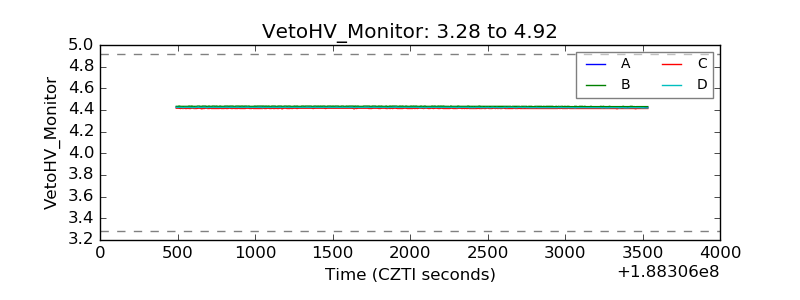 |
| Veto LLD | 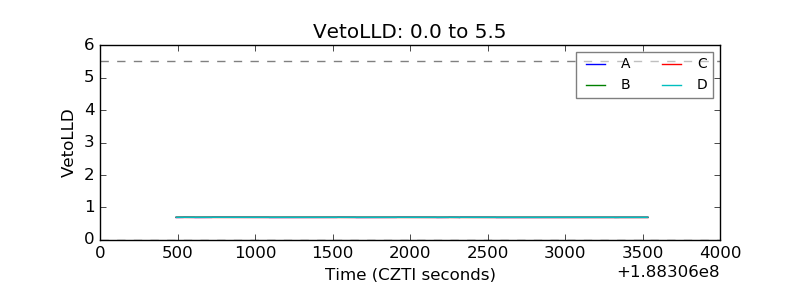 |
| Alpha Counter | 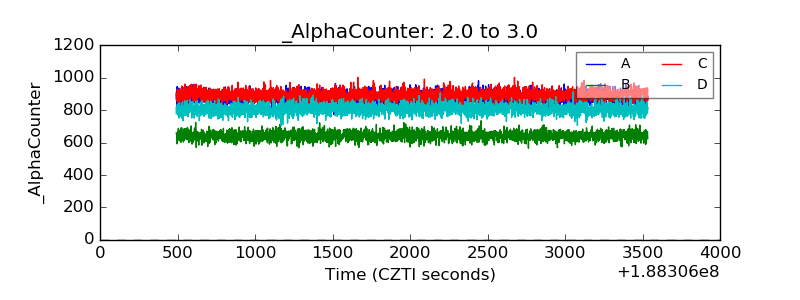 |
| _CPM_Rate | 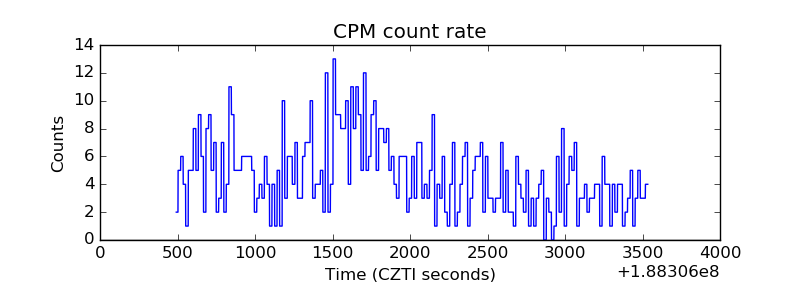 |
| CZT Counter | 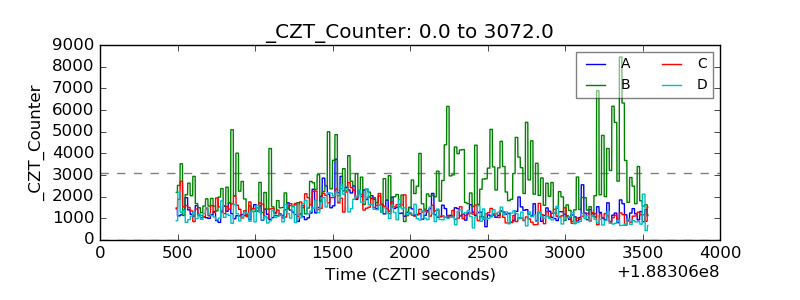 |
| +2.5 Volts monitor |  |
| +5 Volts monitor | 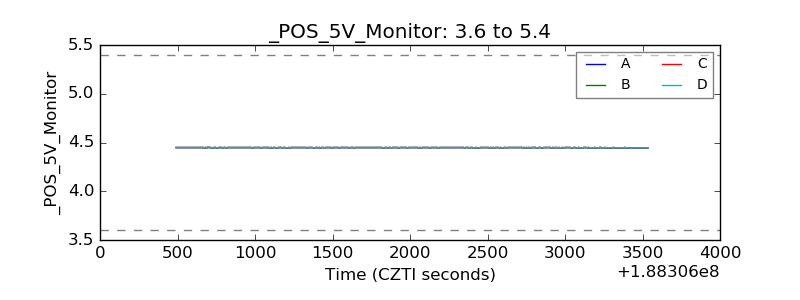 |
| _ROLL_ROT | 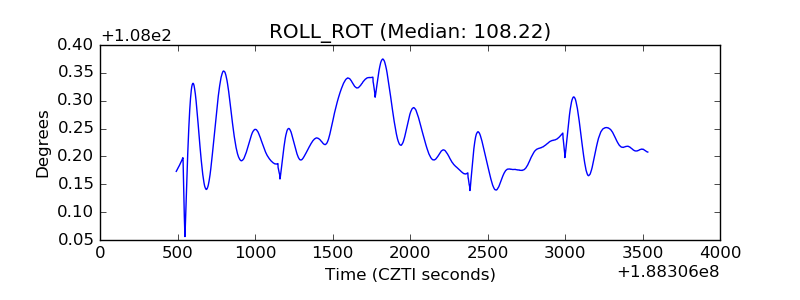 |
| _Roll_DEC | 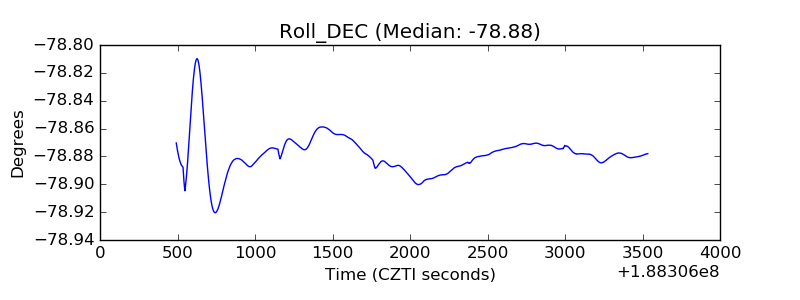 |
| _Roll_RA | 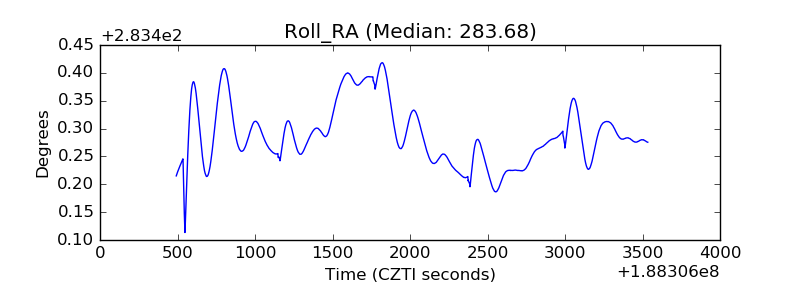 |
| Veto Counter | 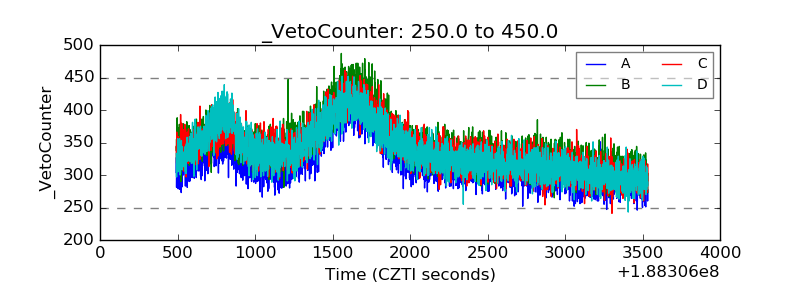 |