| Param | Original file | Final file |
|---|---|---|
| Filename | modeM0/AS1G04_011T02_9000000226_01235cztM0_level2.evt | modeM0/AS1G04_011T02_9000000226_01235cztM0_level2_quad_clean.evt |
| Size (bytes) | 1,403,951,040 | 103,345,920 |
| Size | 1.3 GB | 98.6 MB |
| Events in quadrant A | 8,356,592 | 727,234 |
| Events in quadrant B | 17,507,690 | 516,988 |
| Events in quadrant C | 8,465,317 | 698,628 |
| Events in quadrant D | 7,736,263 | 706,974 |
| Mode SS | |||
|---|---|---|---|
| Quadrant | BADHDUFLAG | Total packets | Discarded packets |
| A | 0 | 138 | 0 |
| B | 0 | 138 | 0 |
| C | 0 | 138 | 0 |
| D | 0 | 138 | 0 |
| Mode M0 | |||
|---|---|---|---|
| Quadrant | BADHDUFLAG | Total packets | Discarded packets |
| A | 0 | 29644 | 1 |
| B | 0 | 57335 | 0 |
| C | 0 | 29998 | 0 |
| D | 0 | 27911 | 0 |
| Quadrant | Total seconds | Saturated seconds | Saturation percentage |
|---|---|---|---|
| A | 6866 | 4 | 0.058258% |
| B | 6866 | 3345 | 48.718322% |
| C | 6866 | 40 | 0.582581% |
| D | 6866 | 42 | 0.611710% |
Noise dominated data is calculated using 1-second bins in cleaned event files. If a bin has >2000 counts, and if more than 50% of those come from <1% of pixels, then it is considered to be noise-dominated and hence unusable.
| Quadrant | # 1 sec bins | Bins with >0 counts | Bins with >2000 counts | High rate bins dominated by noise | Noise dominated (total time) | Noise dominated (detector-on time) | Marked lightcurve |
|---|---|---|---|---|---|---|---|
| A | 6866 | 6866 | 280 | 280 | 4.08% | 4.08% | 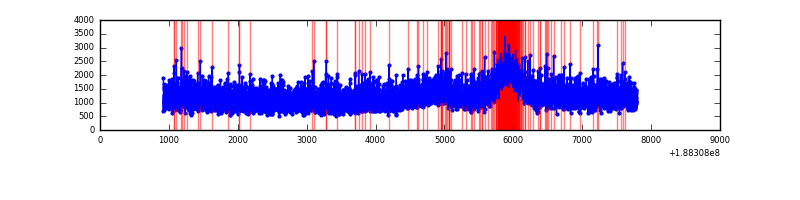 |
| B | 6865 | 6865 | 5155 | 5155 | 75.09% | 75.09% | 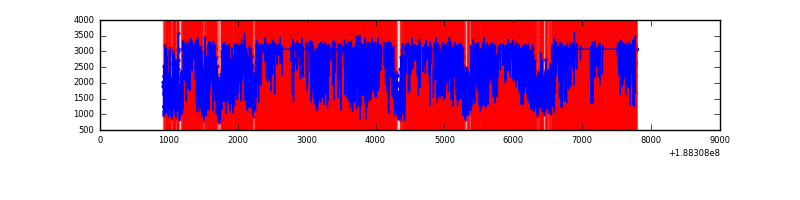 |
| C | 6866 | 6866 | 298 | 298 | 4.34% | 4.34% |  |
| D | 6866 | 6866 | 262 | 262 | 3.82% | 3.82% | 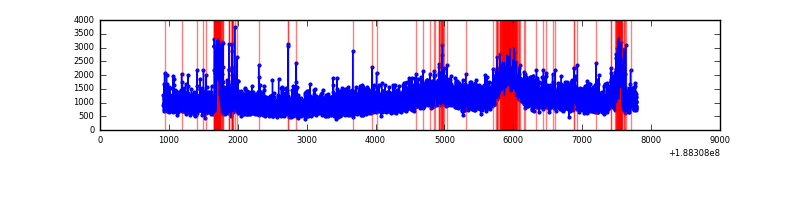 |
Top three noisy pixels from each quadrant. If the there are fewer than three noisy pixels in the level2.evt file, extra rows are filled as -1
| Pixel properties | Quadrant properties | ||||||
|---|---|---|---|---|---|---|---|
| Quadrant | DetID | PixID | Counts | Sigma | Mean | Median | Sigma |
| A | 12 | 243 | 43060 | 78.31 | 2154 | 2172 | 522.1 |
| A | 3 | 80 | 27848 | 49.18 | 2154 | 2172 | 522.1 |
| A | 11 | 79 | 9656 | 14.33 | 2154 | 2172 | 522.1 |
| B | 2 | 32 | 9959279 | 23186.6 | 1818 | 1822 | 429.4 |
| B | 8 | 4 | 286018 | 661.77 | 1818 | 1822 | 429.4 |
| B | 5 | 200 | 95878 | 219.01 | 1818 | 1822 | 429.4 |
| C | 15 | 241 | 374212 | 667.93 | 1998 | 2066 | 557.2 |
| C | 9 | 52 | 94304 | 165.55 | 1998 | 2066 | 557.2 |
| C | 10 | 19 | 72283 | 126.03 | 1998 | 2066 | 557.2 |
| D | 10 | 84 | 230452 | 375.93 | 1952 | 2024 | 607.6 |
| D | 13 | 70 | 145549 | 236.2 | 1952 | 2024 | 607.6 |
| D | 1 | 255 | 28159 | 43.01 | 1952 | 2024 | 607.6 |
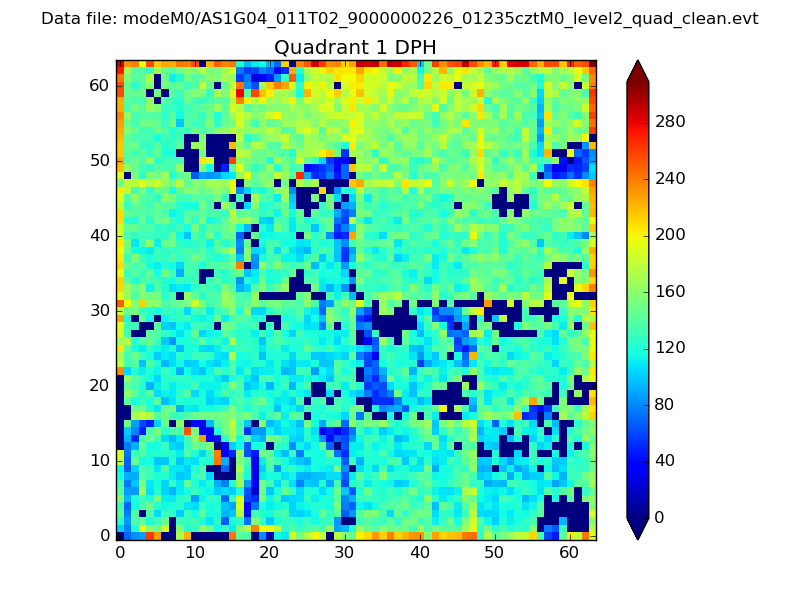
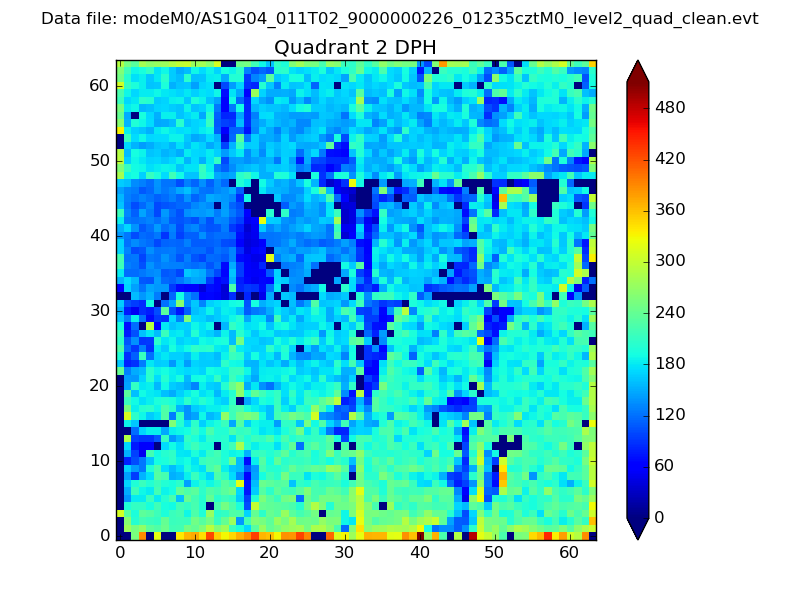
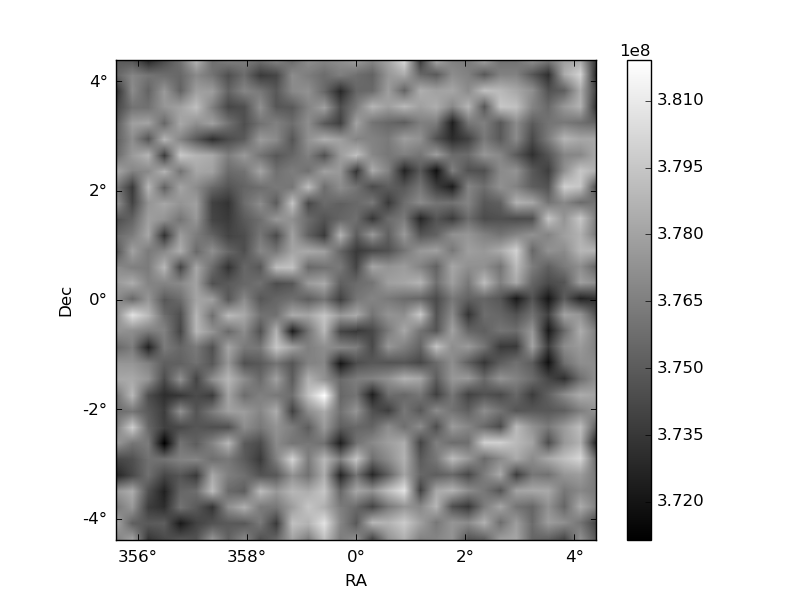
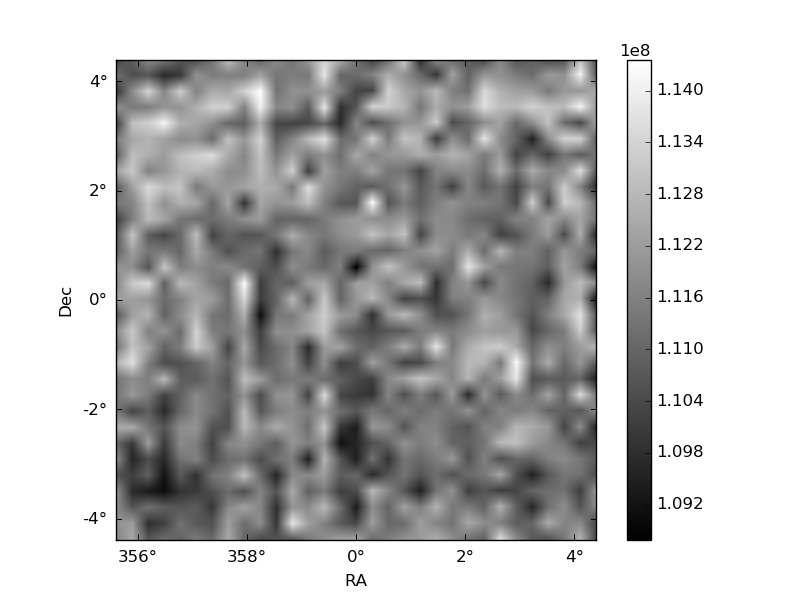
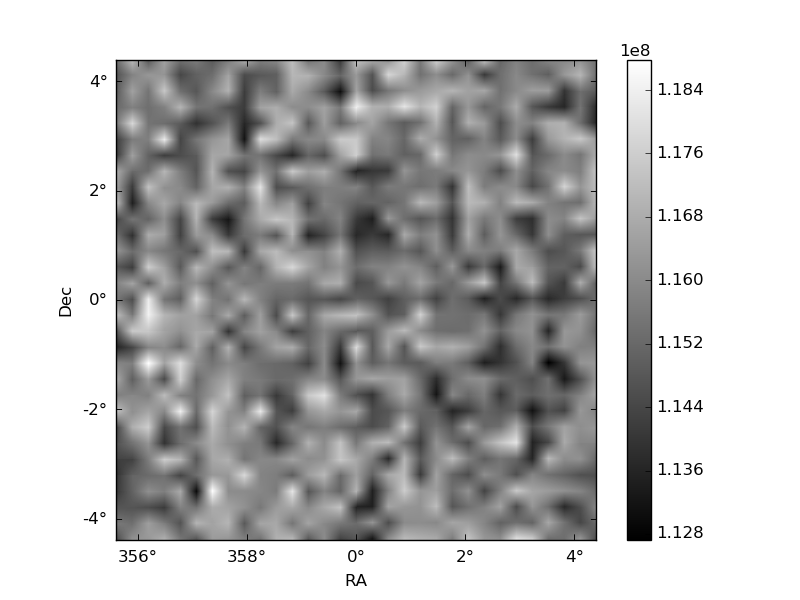
Histogram calculated using DETX and DETY for each event in the final _common_clean file
| Quadrant A | 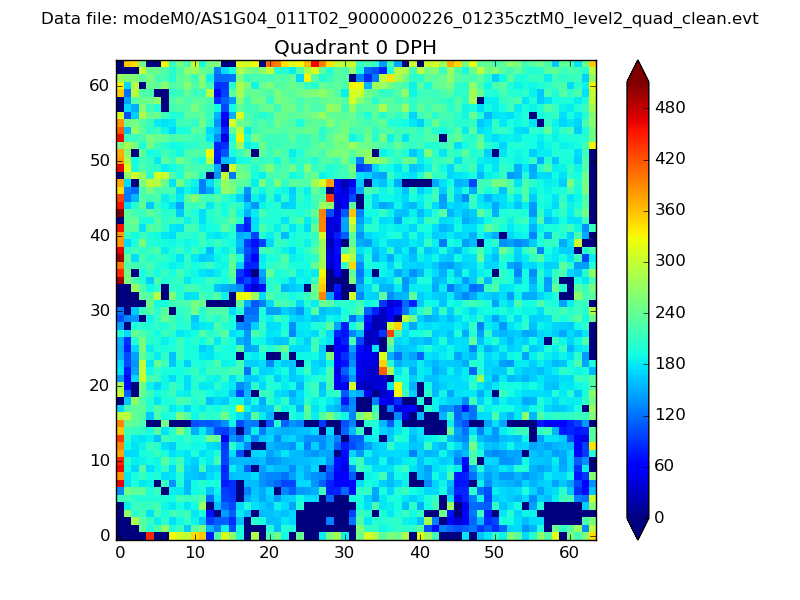 |
 |
Quadrant B |
|---|---|---|---|
| Quadrant D | 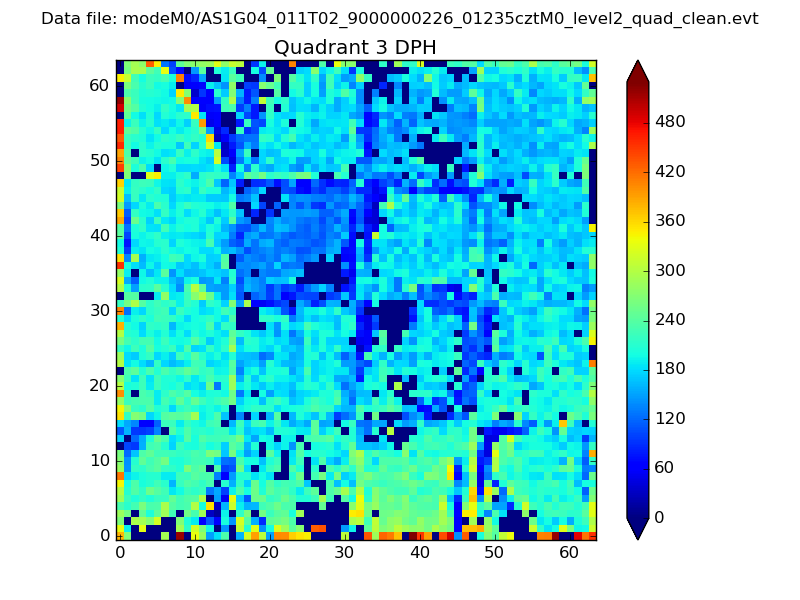 |
 |
Quadrant C |
| Plot type | Count rate plots | Images |
|---|---|---|
| Comparison with Poisson distribution Blue bars denote a histogram of data divided into 1 sec bins. Red curve is a Poisson curve with rate = median count rate of data. |
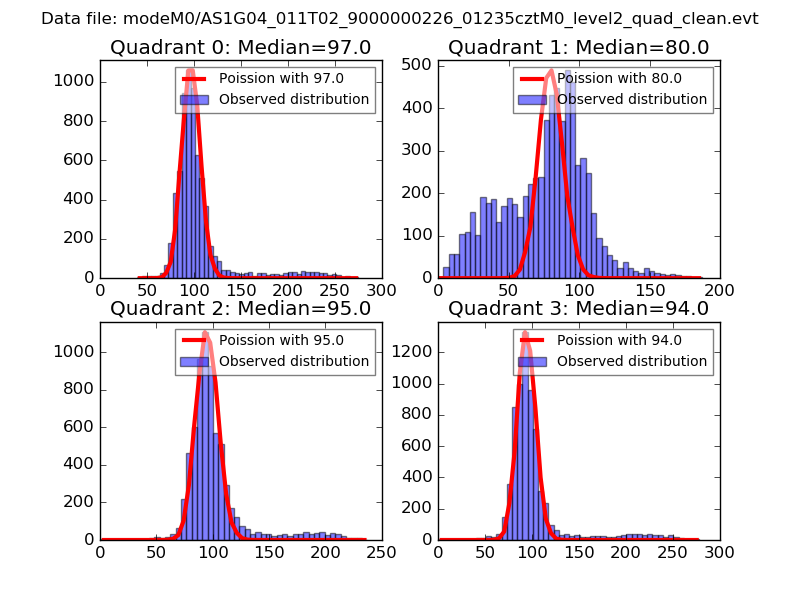 |
 |
| Quadrant-wise count rates Data is divided into 100 sec bins |
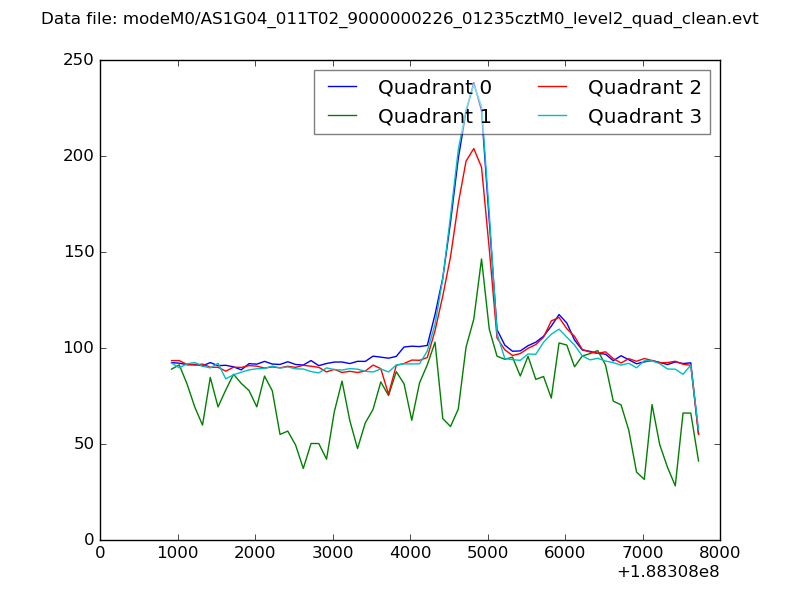 |
|
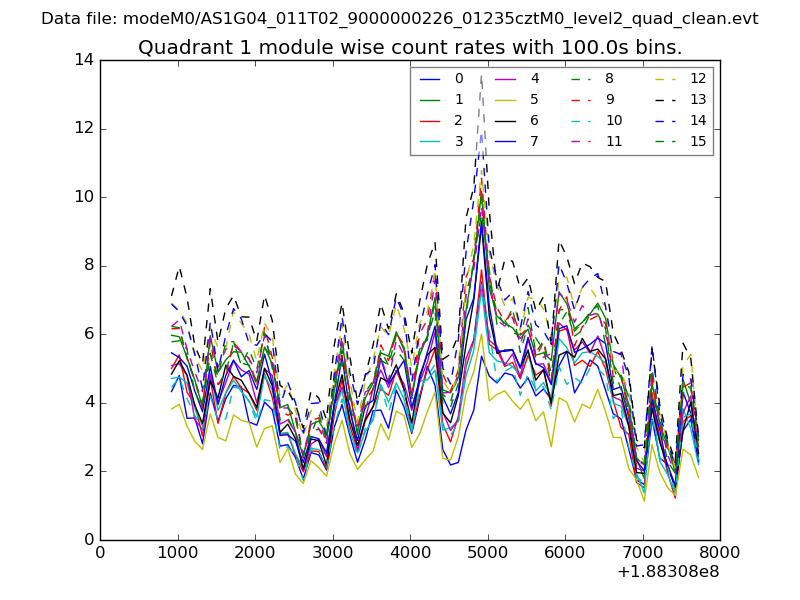
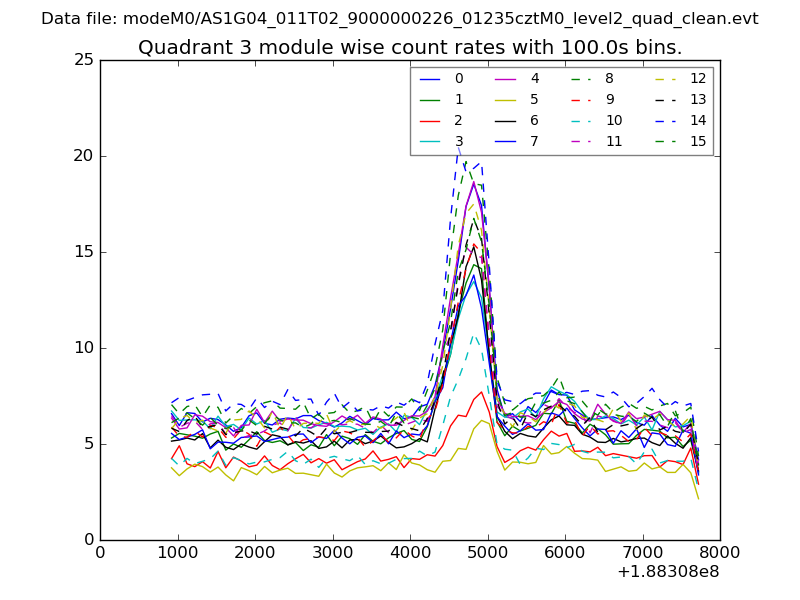
| Module-wise count rates for Quadrant A Data is divided into 100 sec bins |
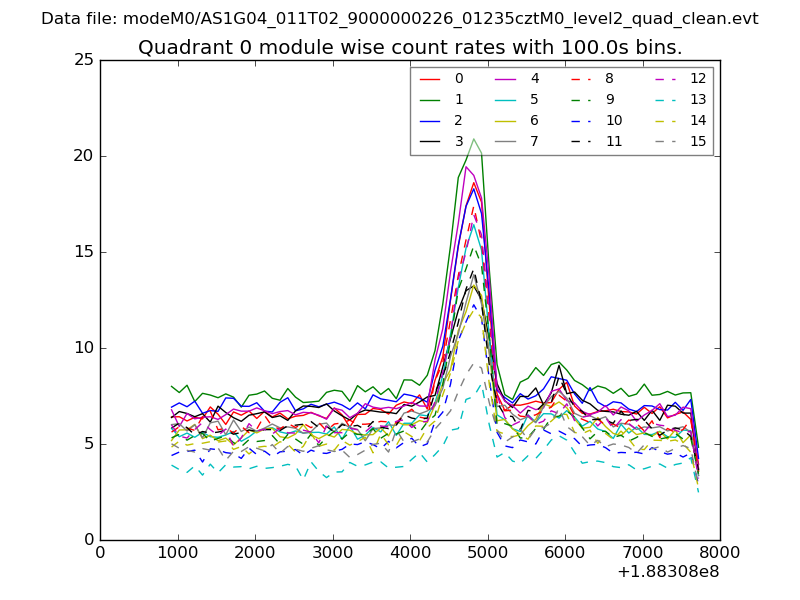 |
 |
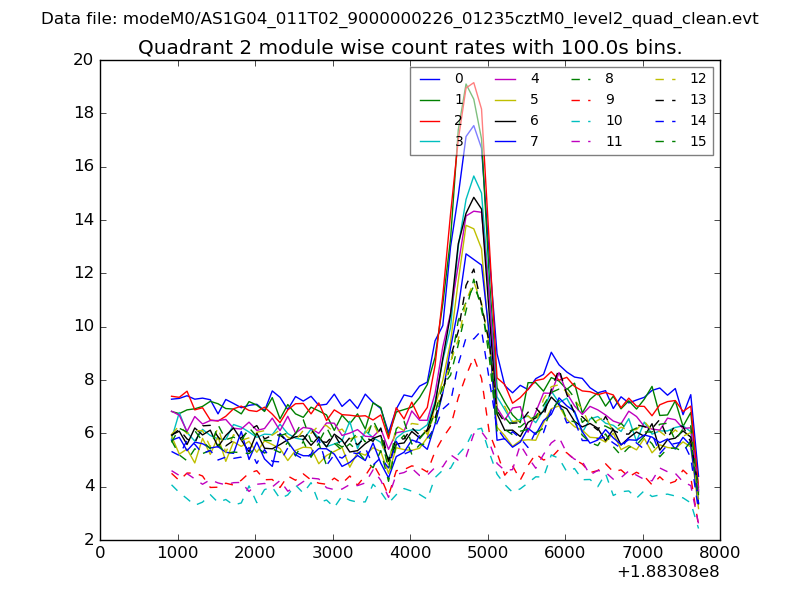
| Module-wise count rates for Quadrant B Data is divided into 100 sec bins |
 |
 |
| Module-wise count rates for Quadrant C Data is divided into 100 sec bins |
 |
 |
| Module-wise count rates for Quadrant D Data is divided into 100 sec bins |
 |
 |
| Parameter | Plot |
|---|---|
| CZT HV Monitor | 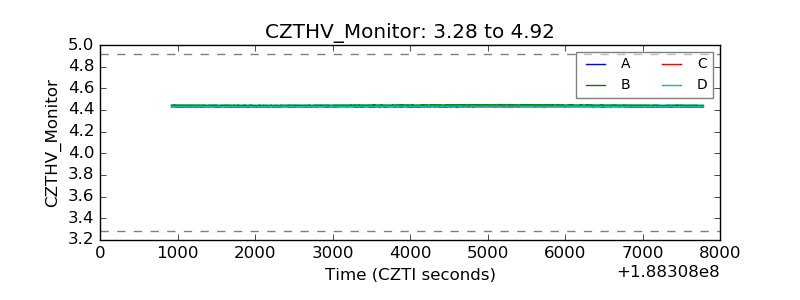 |
| D_VDD | 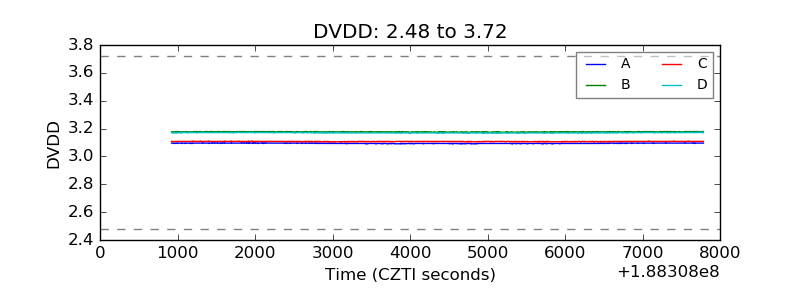 |
| Temperature 1 | 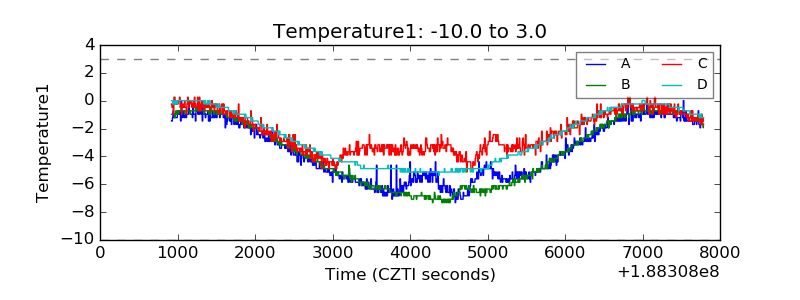 |
| Veto HV Monitor | 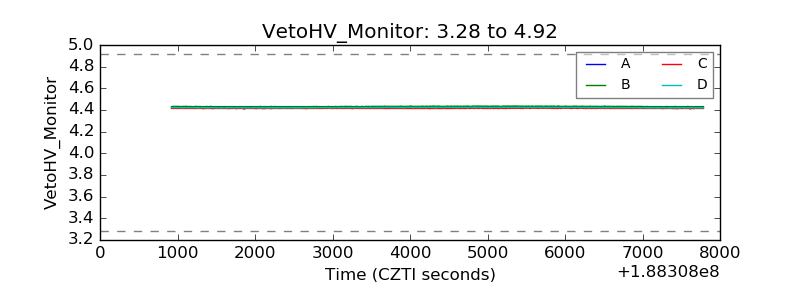 |
| Veto LLD | 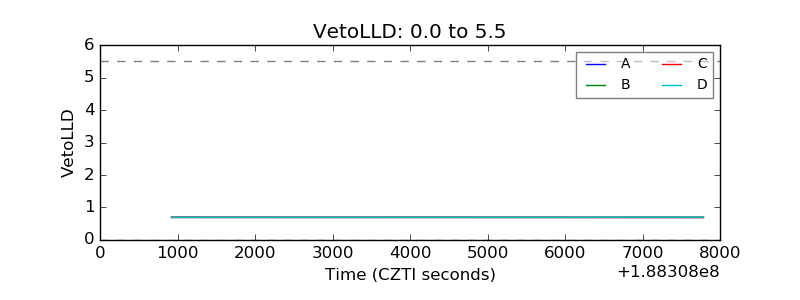 |
| Alpha Counter | 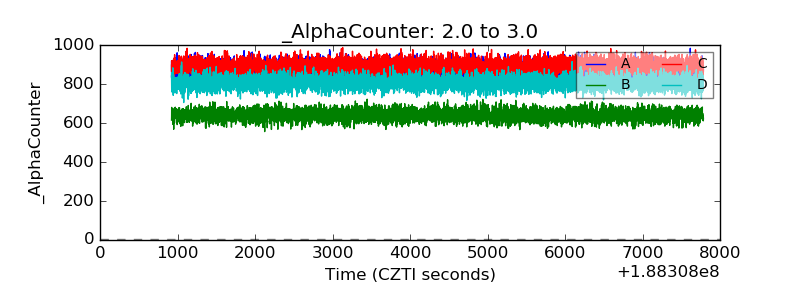 |
| _CPM_Rate | 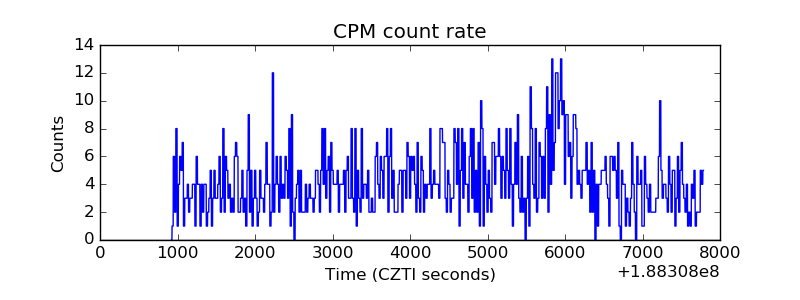 |
| CZT Counter | 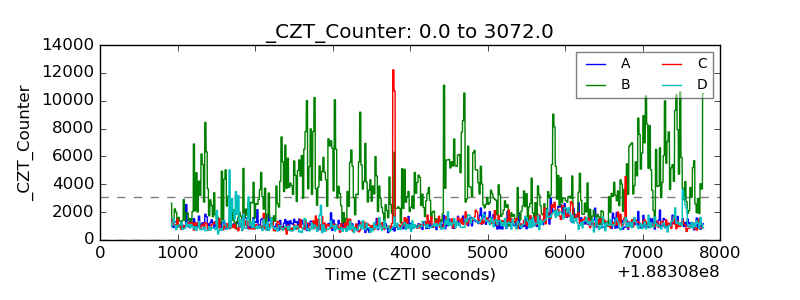 |
| +2.5 Volts monitor |  |
| +5 Volts monitor |  |
| _ROLL_ROT | 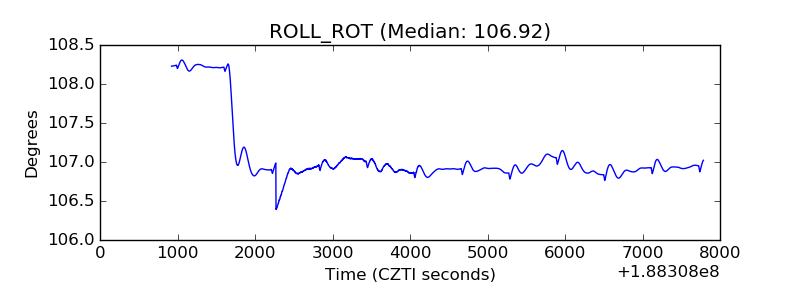 |
| _Roll_DEC | 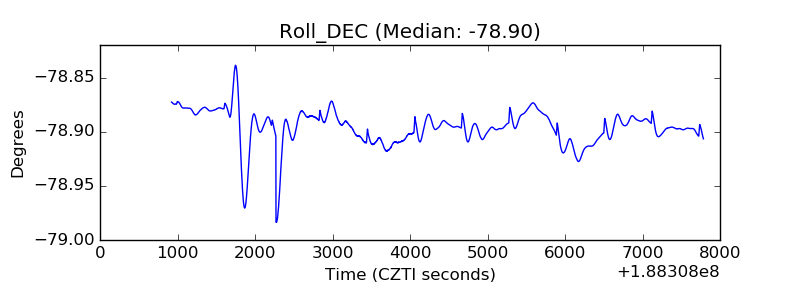 |
| _Roll_RA | 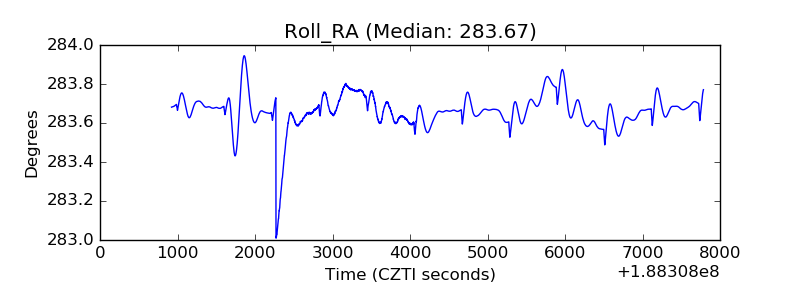 |
| Veto Counter | 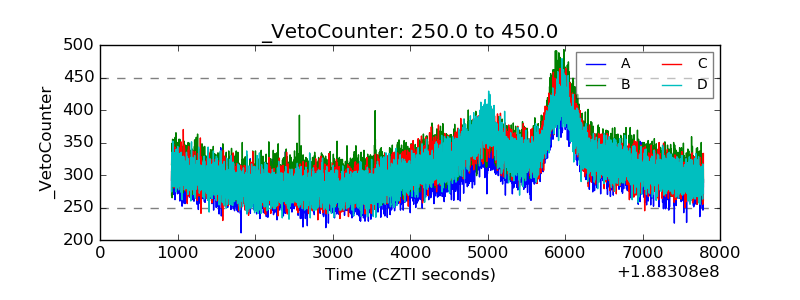 |