| Param | Original file | Final file |
|---|---|---|
| Filename | modeM0/AS1G04_011T02_9000000226_01236cztM0_level2.evt | modeM0/AS1G04_011T02_9000000226_01236cztM0_level2_quad_clean.evt |
| Size (bytes) | 1,453,291,200 | 89,400,960 |
| Size | 1.4 GB | 85.3 MB |
| Events in quadrant A | 8,247,582 | 650,692 |
| Events in quadrant B | 19,194,675 | 329,014 |
| Events in quadrant C | 8,081,920 | 634,957 |
| Events in quadrant D | 8,045,712 | 622,422 |
| Mode SS | |||
|---|---|---|---|
| Quadrant | BADHDUFLAG | Total packets | Discarded packets |
| A | 0 | 136 | 0 |
| B | 0 | 136 | 0 |
| C | 0 | 136 | 0 |
| D | 0 | 136 | 0 |
| Mode M9 | |||
|---|---|---|---|
| Quadrant | BADHDUFLAG | Total packets | Discarded packets |
| A | 0 | 2 | 0 |
| B | 0 | 2 | 0 |
| C | 0 | 2 | 0 |
| D | 0 | 2 | 0 |
| Mode M0 | |||
|---|---|---|---|
| Quadrant | BADHDUFLAG | Total packets | Discarded packets |
| A | 0 | 29272 | 2 |
| B | 0 | 62632 | 1 |
| C | 0 | 28758 | 1 |
| D | 0 | 28710 | 1 |
| Quadrant | Total seconds | Saturated seconds | Saturation percentage |
|---|---|---|---|
| A | 6711 | 50 | 0.745045% |
| B | 6711 | 5301 | 78.989718% |
| C | 6711 | 10 | 0.149009% |
| D | 6711 | 124 | 1.847713% |
Noise dominated data is calculated using 1-second bins in cleaned event files. If a bin has >2000 counts, and if more than 50% of those come from <1% of pixels, then it is considered to be noise-dominated and hence unusable.
| Quadrant | # 1 sec bins | Bins with >0 counts | Bins with >2000 counts | High rate bins dominated by noise | Noise dominated (total time) | Noise dominated (detector-on time) | Marked lightcurve |
|---|---|---|---|---|---|---|---|
| A | 6916 | 6712 | 342 | 342 | 4.95% | 5.10% | 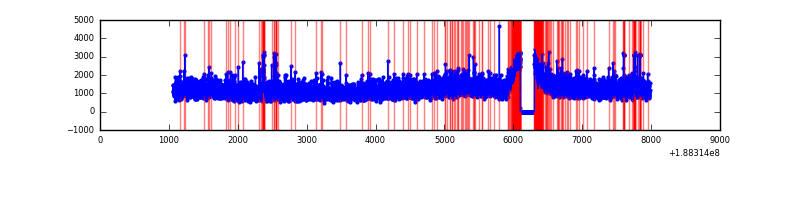 |
| B | 6916 | 6712 | 6055 | 6055 | 87.55% | 90.21% | 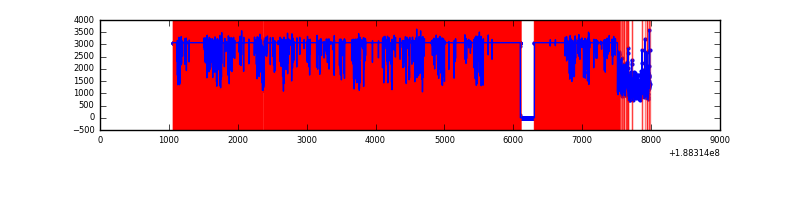 |
| C | 6916 | 6712 | 238 | 238 | 3.44% | 3.55% |  |
| D | 6916 | 6712 | 424 | 424 | 6.13% | 6.32% | 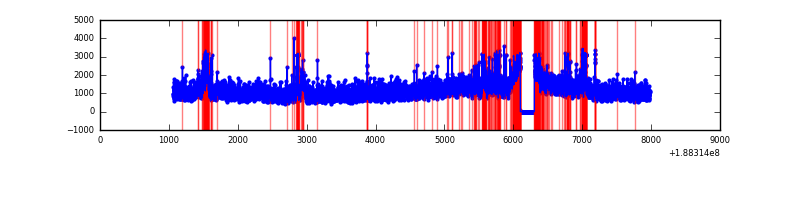 |
Top three noisy pixels from each quadrant. If the there are fewer than three noisy pixels in the level2.evt file, extra rows are filled as -1
| Pixel properties | Quadrant properties | ||||||
|---|---|---|---|---|---|---|---|
| Quadrant | DetID | PixID | Counts | Sigma | Mean | Median | Sigma |
| A | 12 | 133 | 71162 | 137.93 | 2087 | 2103 | 500.7 |
| A | 0 | 51 | 62477 | 120.58 | 2087 | 2103 | 500.7 |
| A | 12 | 243 | 47001 | 89.67 | 2087 | 2103 | 500.7 |
| B | 2 | 32 | 13501632 | 43807.15 | 1293 | 1299 | 308.2 |
| B | 8 | 4 | 402682 | 1302.45 | 1293 | 1299 | 308.2 |
| B | 0 | 244 | 174551 | 562.18 | 1293 | 1299 | 308.2 |
| C | 15 | 241 | 366130 | 667.39 | 1947 | 2013 | 545.6 |
| C | 3 | 79 | 40510 | 70.56 | 1947 | 2013 | 545.6 |
| C | 3 | 111 | 30862 | 52.88 | 1947 | 2013 | 545.6 |
| D | 10 | 84 | 891814 | 1509.91 | 1890 | 1956 | 589.3 |
| D | 13 | 70 | 52521 | 85.8 | 1890 | 1956 | 589.3 |
| D | 1 | 239 | 27678 | 43.64 | 1890 | 1956 | 589.3 |
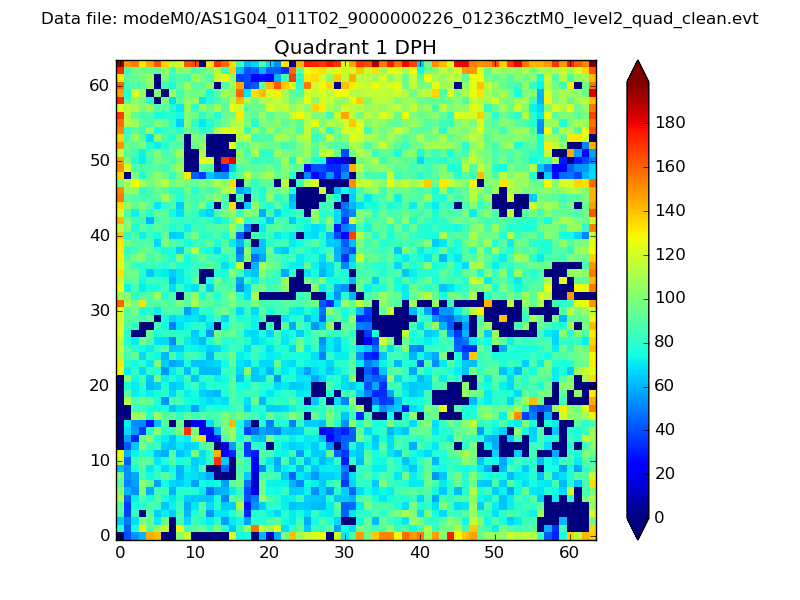
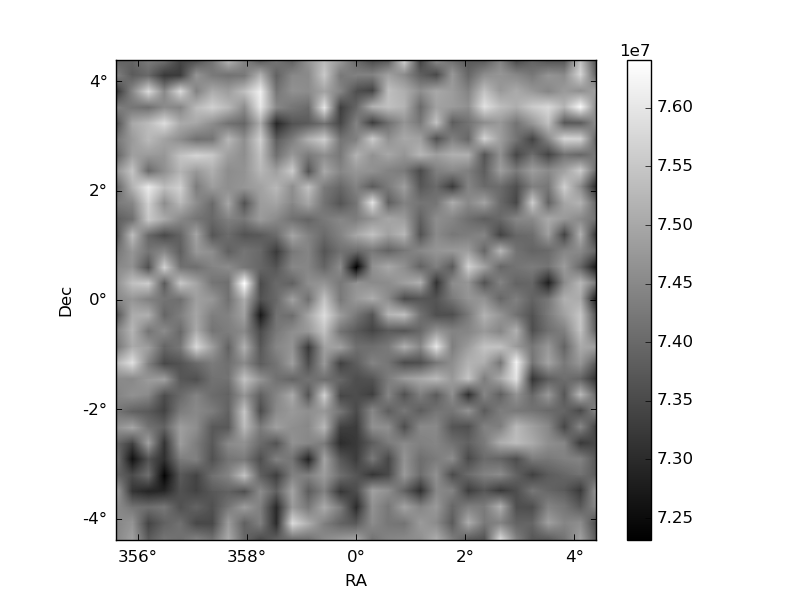
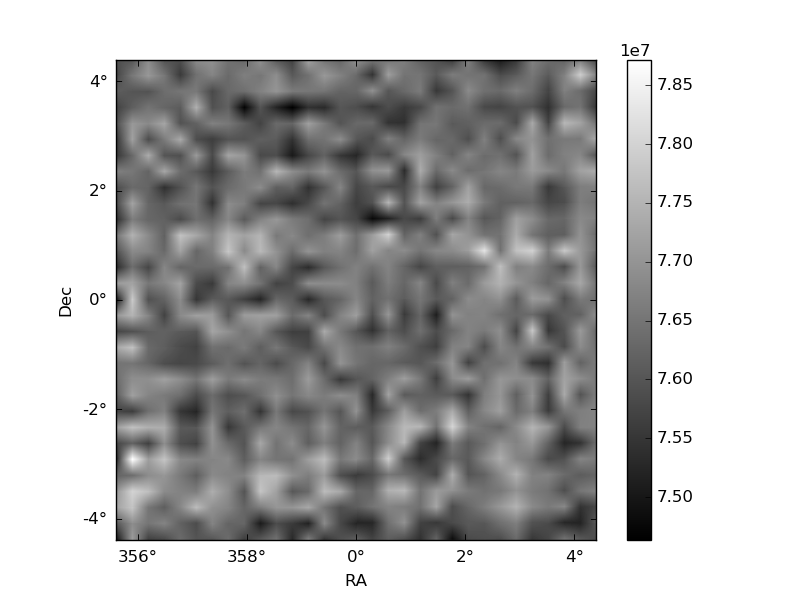
Histogram calculated using DETX and DETY for each event in the final _common_clean file
| Quadrant A |  |
 |
Quadrant B |
|---|---|---|---|
| Quadrant D |  |
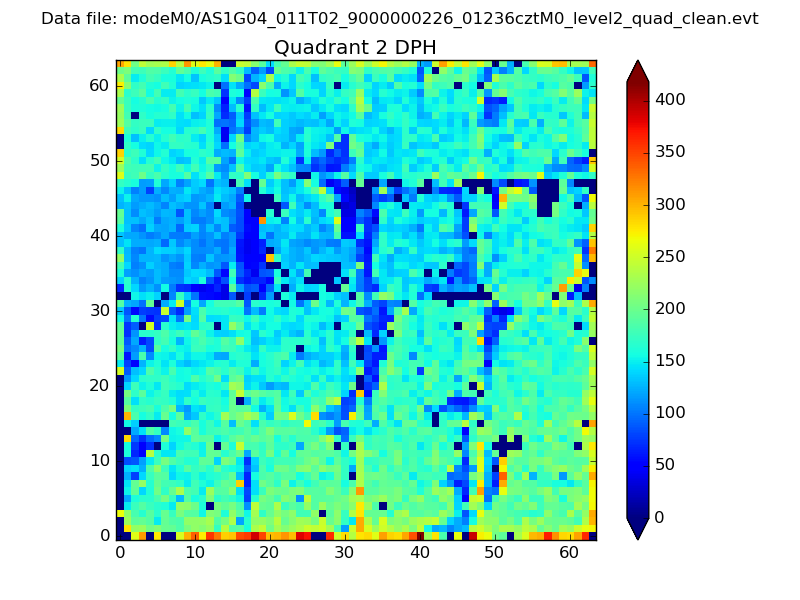 |
Quadrant C |
| Plot type | Count rate plots | Images |
|---|---|---|
| Comparison with Poisson distribution Blue bars denote a histogram of data divided into 1 sec bins. Red curve is a Poisson curve with rate = median count rate of data. |
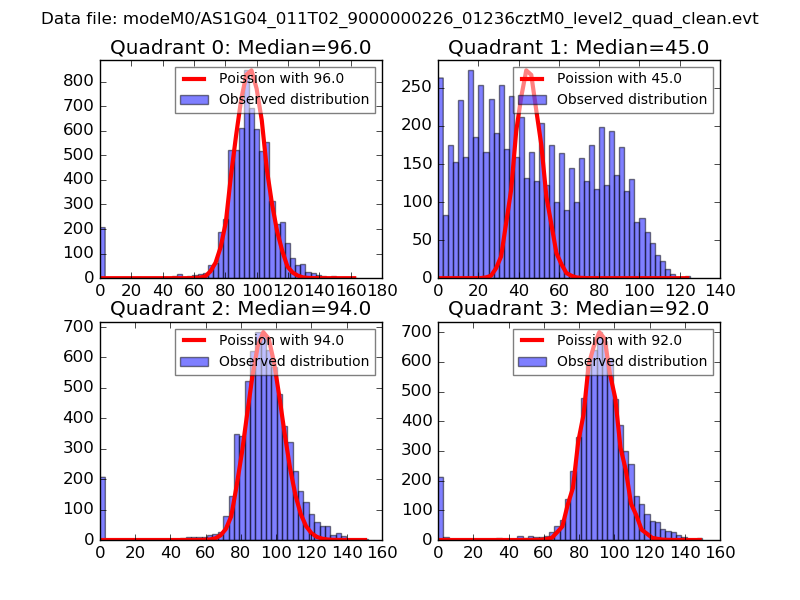 |
 |
| Quadrant-wise count rates Data is divided into 100 sec bins |
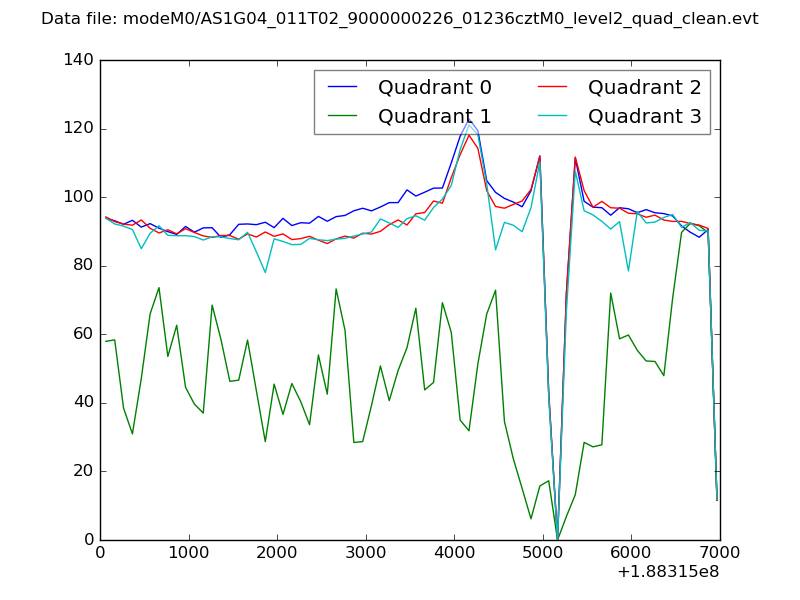 |
|
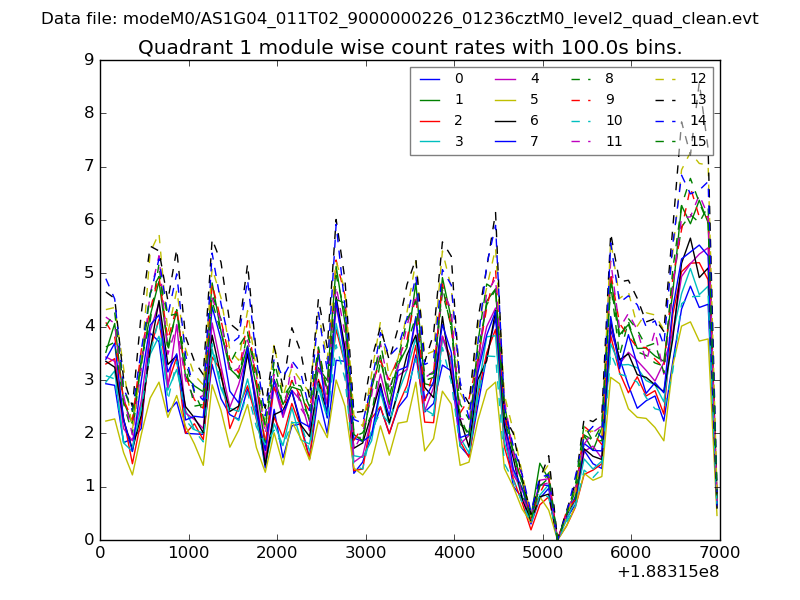
| Module-wise count rates for Quadrant A Data is divided into 100 sec bins |
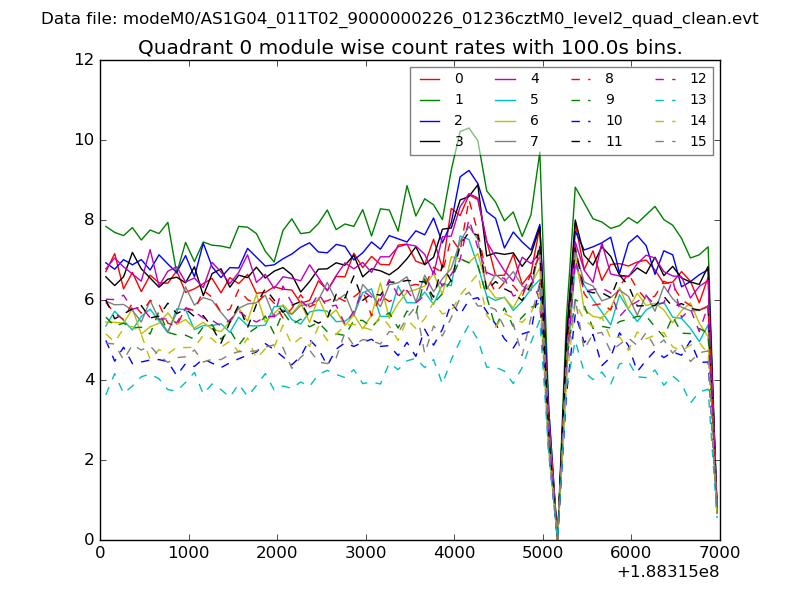 |
 |
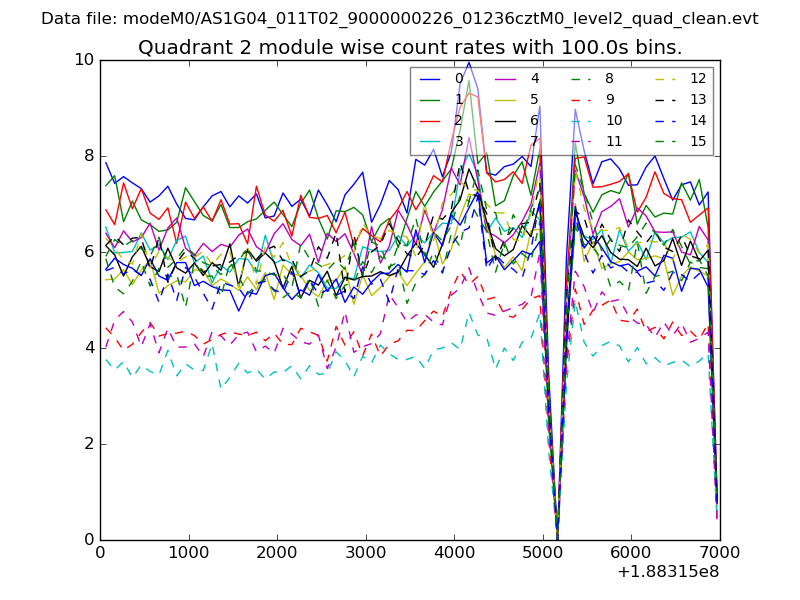
| Module-wise count rates for Quadrant B Data is divided into 100 sec bins |
 |
 |
| Module-wise count rates for Quadrant C Data is divided into 100 sec bins |
 |
 |
| Module-wise count rates for Quadrant D Data is divided into 100 sec bins |
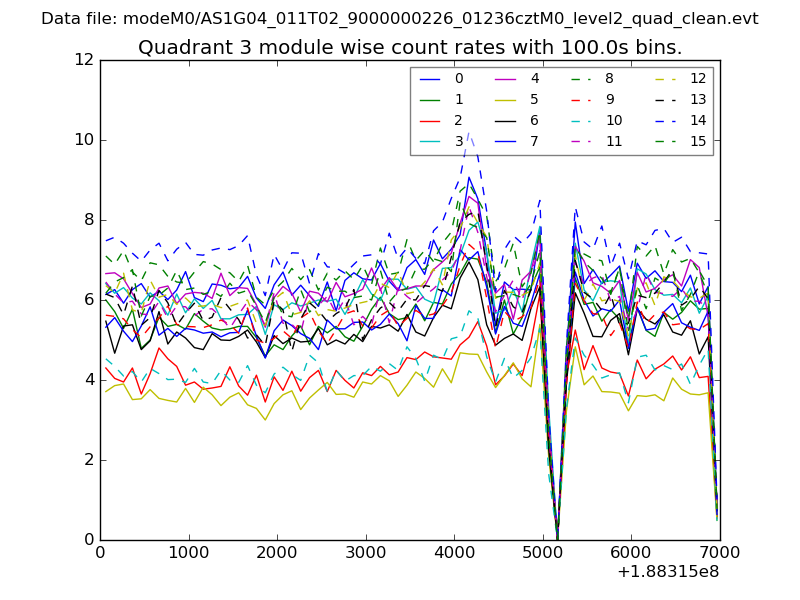 |
 |
| Parameter | Plot |
|---|---|
| CZT HV Monitor | 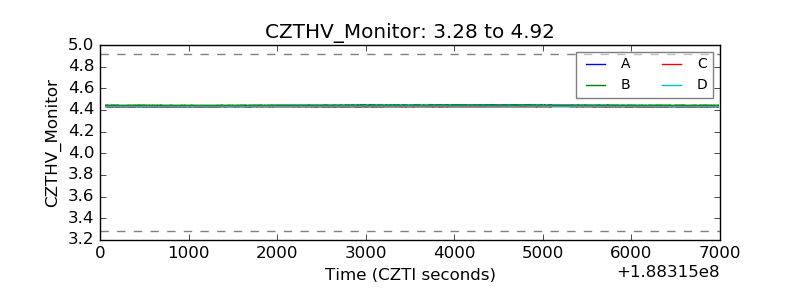 |
| D_VDD | 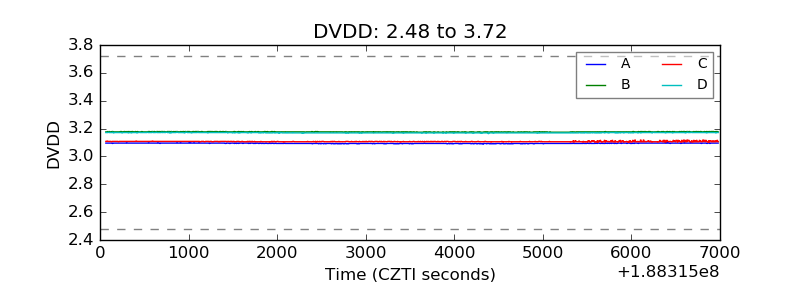 |
| Temperature 1 | 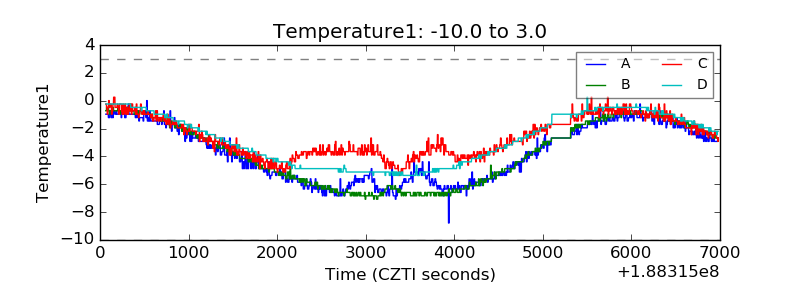 |
| Veto HV Monitor | 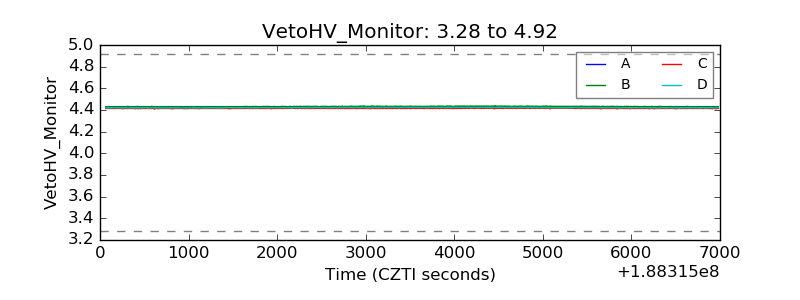 |
| Veto LLD | 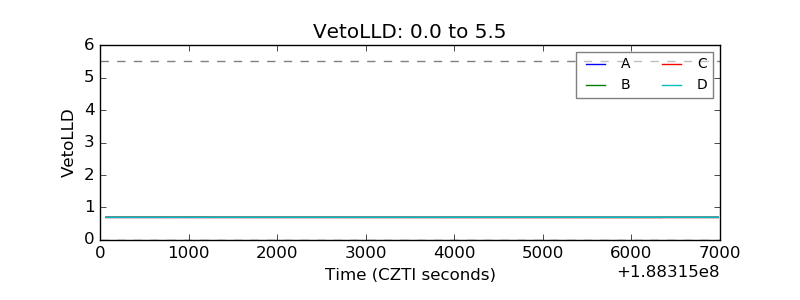 |
| Alpha Counter | 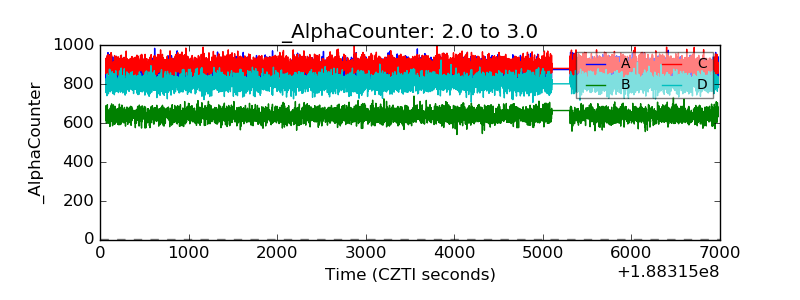 |
| _CPM_Rate | 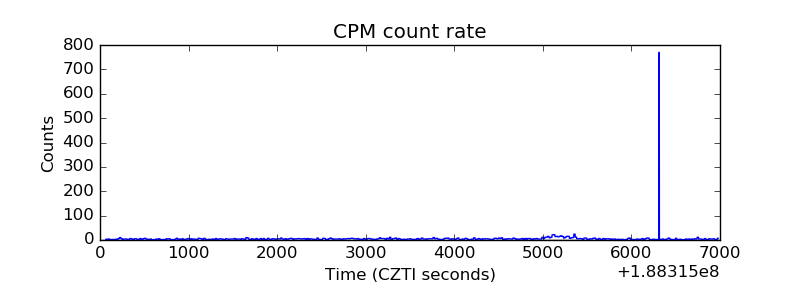 |
| CZT Counter | 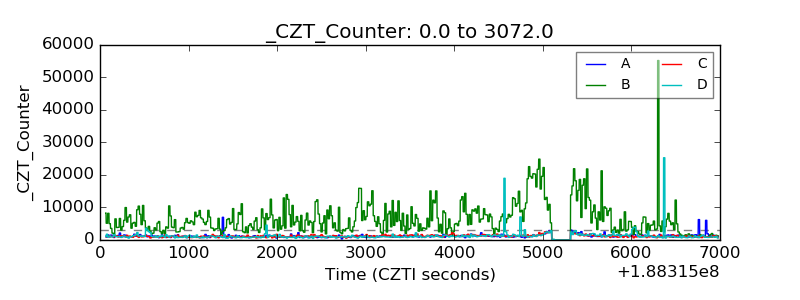 |
| +2.5 Volts monitor |  |
| +5 Volts monitor |  |
| _ROLL_ROT | 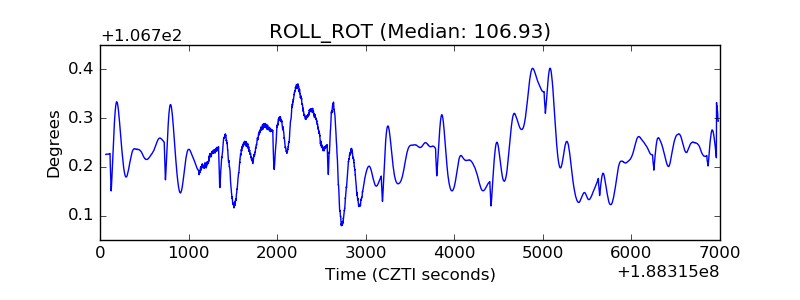 |
| _Roll_DEC | 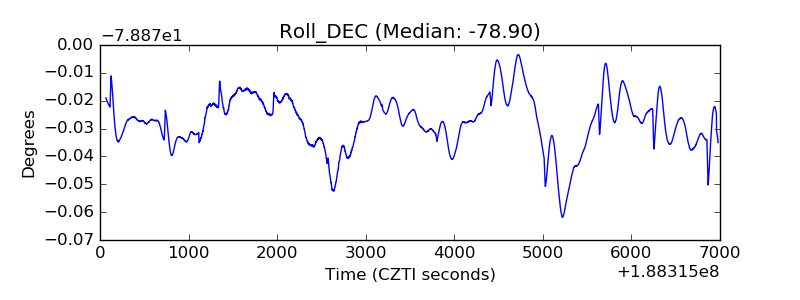 |
| _Roll_RA |  |
| Veto Counter | 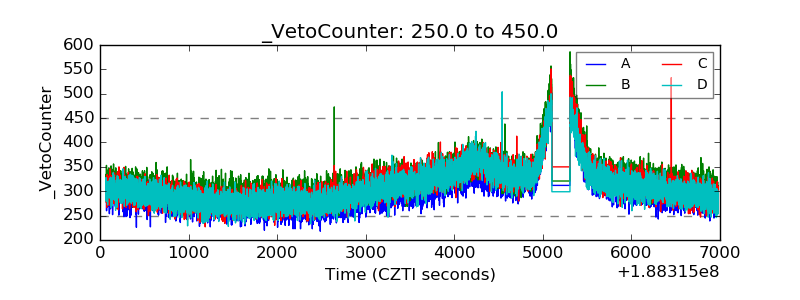 |