| Param | Original file | Final file |
|---|---|---|
| Filename | modeM0/AS1G04_011T02_9000000226_01238cztM0_level2.evt | modeM0/AS1G04_011T02_9000000226_01238cztM0_level2_quad_clean.evt |
| Size (bytes) | 1,439,853,120 | 92,934,720 |
| Size | 1.3 GB | 88.6 MB |
| Events in quadrant A | 8,536,900 | 670,155 |
| Events in quadrant B | 19,034,477 | 376,246 |
| Events in quadrant C | 8,369,574 | 643,804 |
| Events in quadrant D | 7,214,062 | 646,159 |
| Mode SS | |||
|---|---|---|---|
| Quadrant | BADHDUFLAG | Total packets | Discarded packets |
| A | 0 | 138 | 0 |
| B | 0 | 138 | 0 |
| C | 0 | 138 | 0 |
| D | 0 | 138 | 0 |
| Mode M9 | |||
|---|---|---|---|
| Quadrant | BADHDUFLAG | Total packets | Discarded packets |
| A | 0 | 7 | 0 |
| B | 0 | 7 | 0 |
| C | 0 | 7 | 0 |
| D | 0 | 7 | 0 |
| Mode M0 | |||
|---|---|---|---|
| Quadrant | BADHDUFLAG | Total packets | Discarded packets |
| A | 0 | 30216 | 2 |
| B | 0 | 62146 | 1 |
| C | 0 | 29749 | 1 |
| D | 0 | 26305 | 1 |
| Quadrant | Total seconds | Saturated seconds | Saturation percentage |
|---|---|---|---|
| A | 6831 | 34 | 0.497731% |
| B | 6831 | 4842 | 70.882740% |
| C | 6831 | 6 | 0.087835% |
| D | 6831 | 17 | 0.248865% |
Noise dominated data is calculated using 1-second bins in cleaned event files. If a bin has >2000 counts, and if more than 50% of those come from <1% of pixels, then it is considered to be noise-dominated and hence unusable.
| Quadrant | # 1 sec bins | Bins with >0 counts | Bins with >2000 counts | High rate bins dominated by noise | Noise dominated (total time) | Noise dominated (detector-on time) | Marked lightcurve |
|---|---|---|---|---|---|---|---|
| A | 7521 | 6832 | 330 | 330 | 4.39% | 4.83% |  |
| B | 7521 | 6832 | 5917 | 5917 | 78.67% | 86.61% | 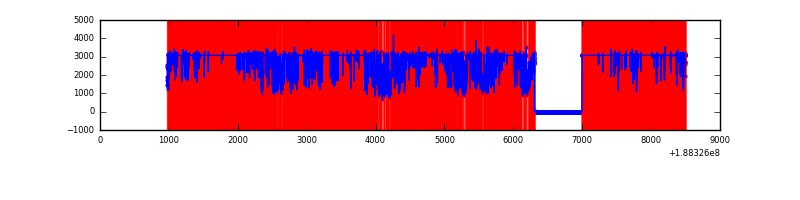 |
| C | 7521 | 6832 | 340 | 340 | 4.52% | 4.98% | 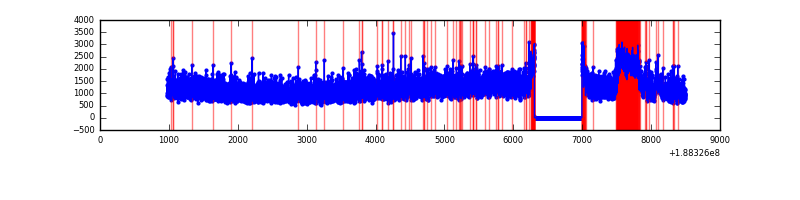 |
| D | 7521 | 6832 | 115 | 115 | 1.53% | 1.68% | 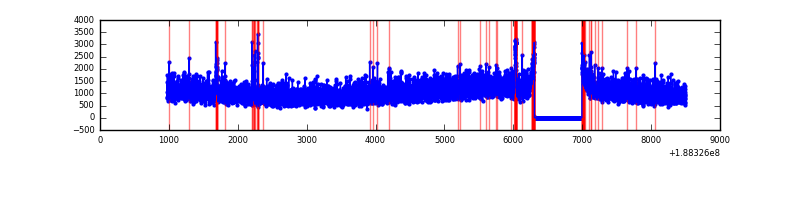 |
Top three noisy pixels from each quadrant. If the there are fewer than three noisy pixels in the level2.evt file, extra rows are filled as -1
| Pixel properties | Quadrant properties | ||||||
|---|---|---|---|---|---|---|---|
| Quadrant | DetID | PixID | Counts | Sigma | Mean | Median | Sigma |
| A | 15 | 127 | 230932 | 453.65 | 2084 | 2102 | 504.4 |
| A | 3 | 80 | 225410 | 442.7 | 2084 | 2102 | 504.4 |
| A | 12 | 243 | 73655 | 141.85 | 2084 | 2102 | 504.4 |
| B | 2 | 32 | 12941141 | 38542.58 | 1420 | 1425 | 335.7 |
| B | 8 | 4 | 300908 | 892.05 | 1420 | 1425 | 335.7 |
| B | 5 | 191 | 288249 | 854.34 | 1420 | 1425 | 335.7 |
| C | 9 | 52 | 413780 | 766.82 | 1928 | 1992 | 537.0 |
| C | 15 | 241 | 364837 | 675.68 | 1928 | 1992 | 537.0 |
| C | 3 | 111 | 25556 | 43.88 | 1928 | 1992 | 537.0 |
| D | 10 | 84 | 98473 | 166.33 | 1874 | 1939 | 580.4 |
| D | 10 | 85 | 61876 | 103.27 | 1874 | 1939 | 580.4 |
| D | 12 | 22 | 29536 | 47.55 | 1874 | 1939 | 580.4 |
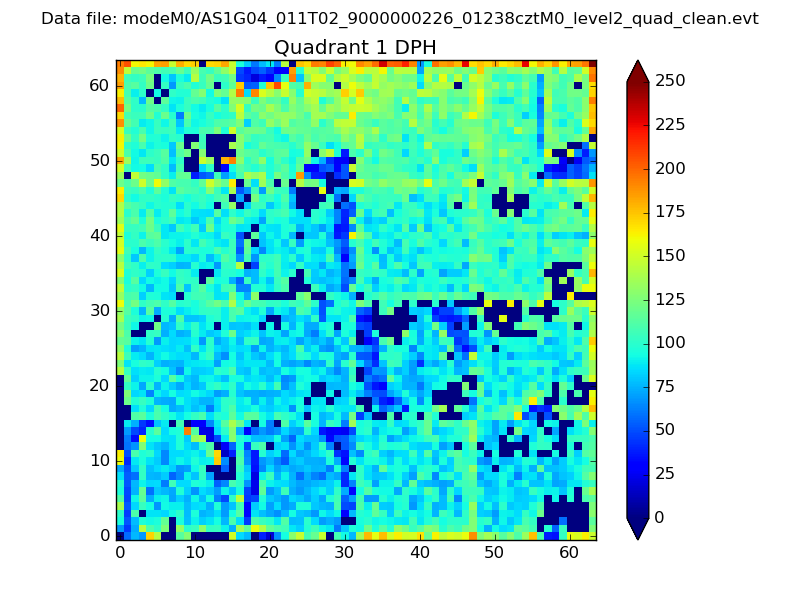
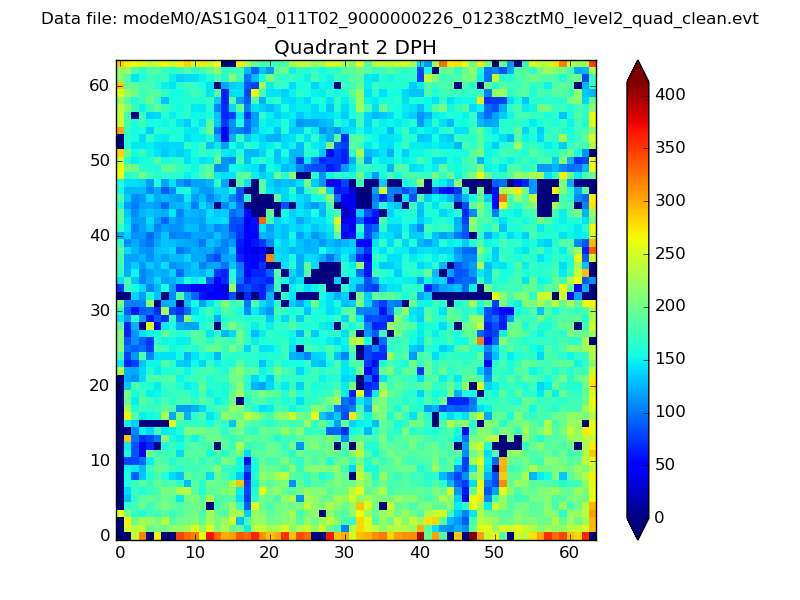
Histogram calculated using DETX and DETY for each event in the final _common_clean file
| Quadrant A | 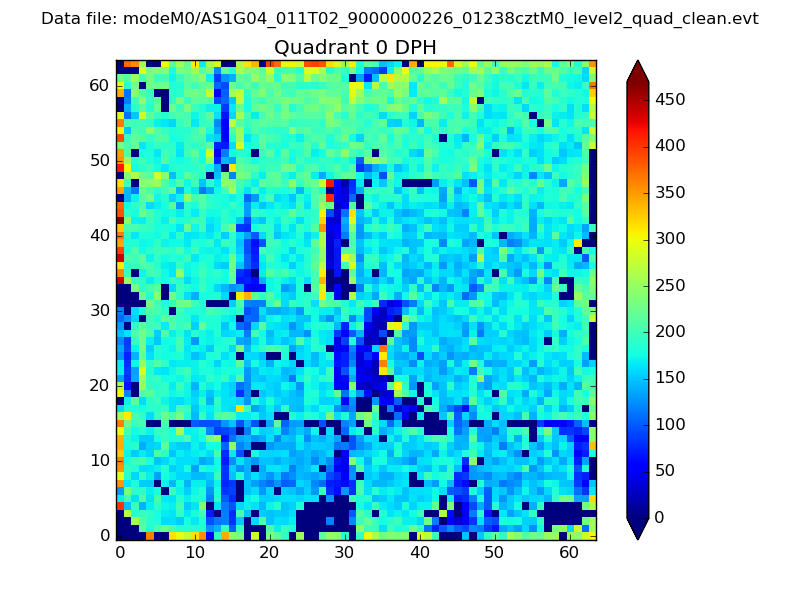 |
 |
Quadrant B |
|---|---|---|---|
| Quadrant D | 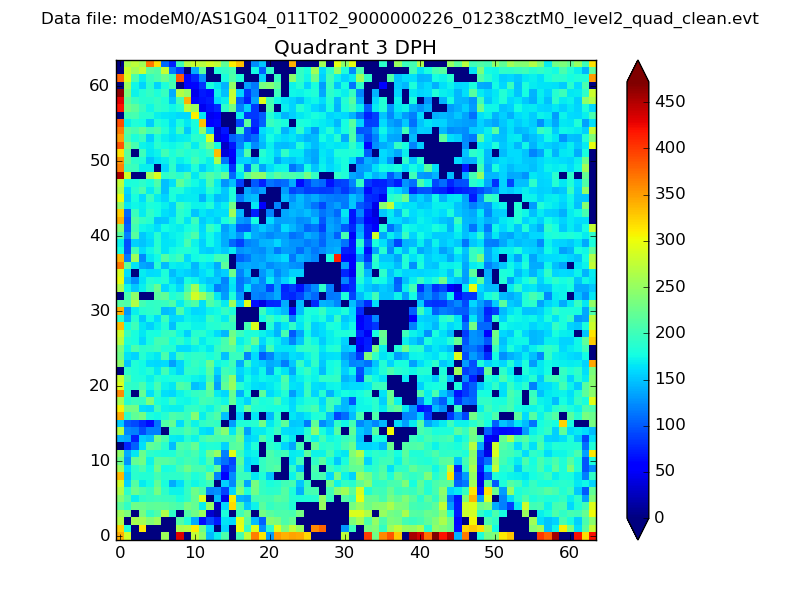 |
 |
Quadrant C |
| Plot type | Count rate plots | Images |
|---|---|---|
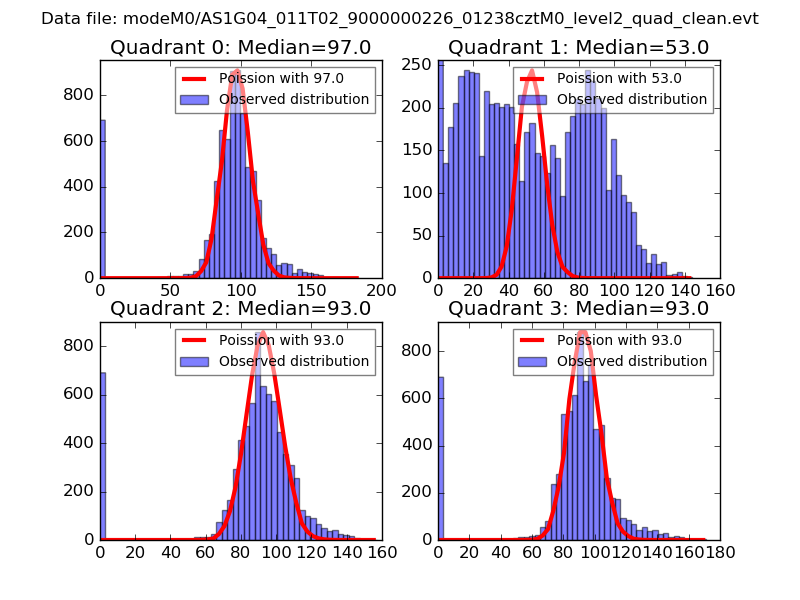
| Comparison with Poisson distribution Blue bars denote a histogram of data divided into 1 sec bins. Red curve is a Poisson curve with rate = median count rate of data. |
 |
 |
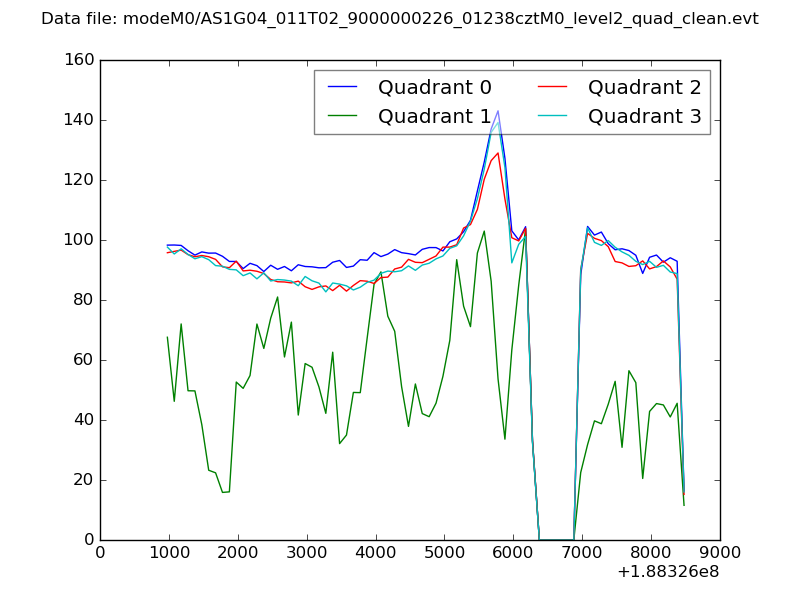
| Quadrant-wise count rates Data is divided into 100 sec bins |
 |
|
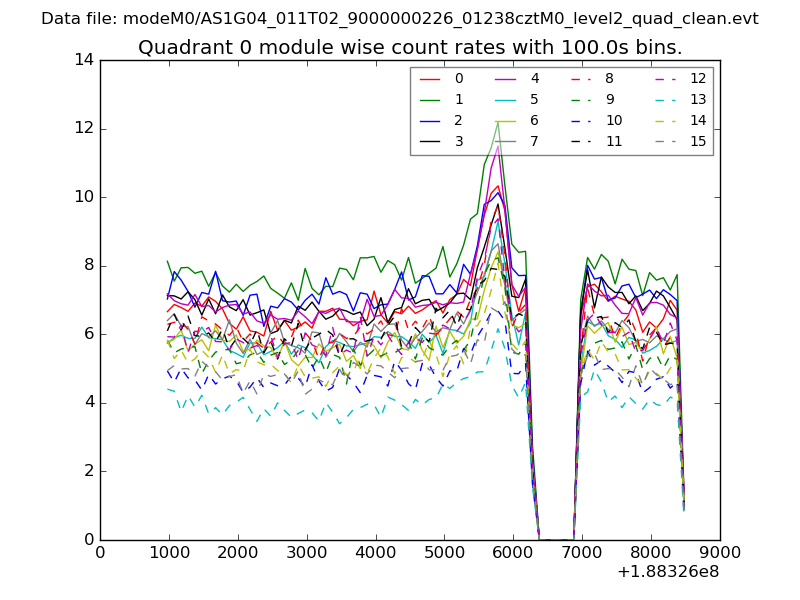
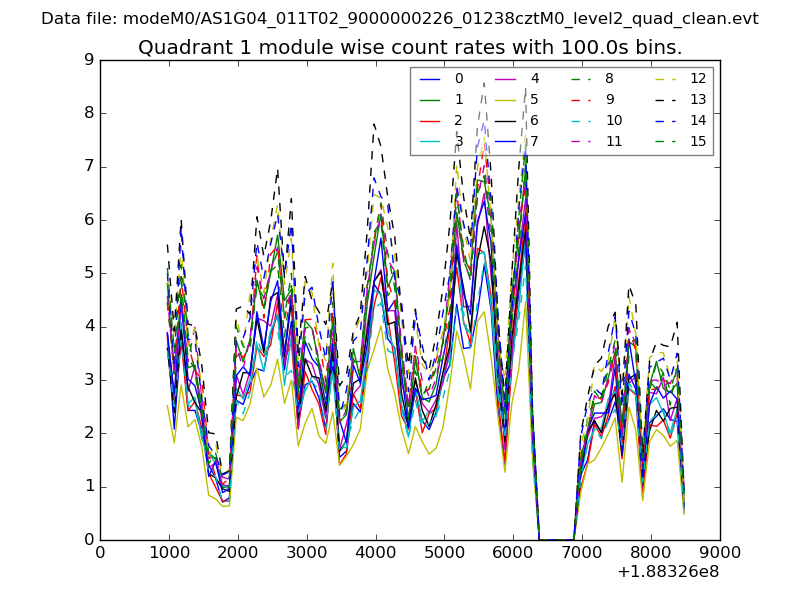
| Module-wise count rates for Quadrant A Data is divided into 100 sec bins |
 |
 |
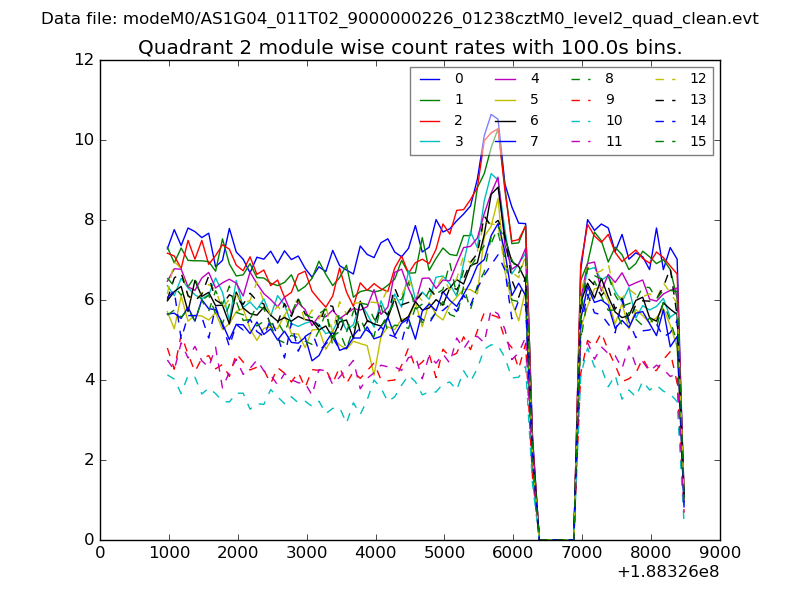
| Module-wise count rates for Quadrant B Data is divided into 100 sec bins |
 |
 |
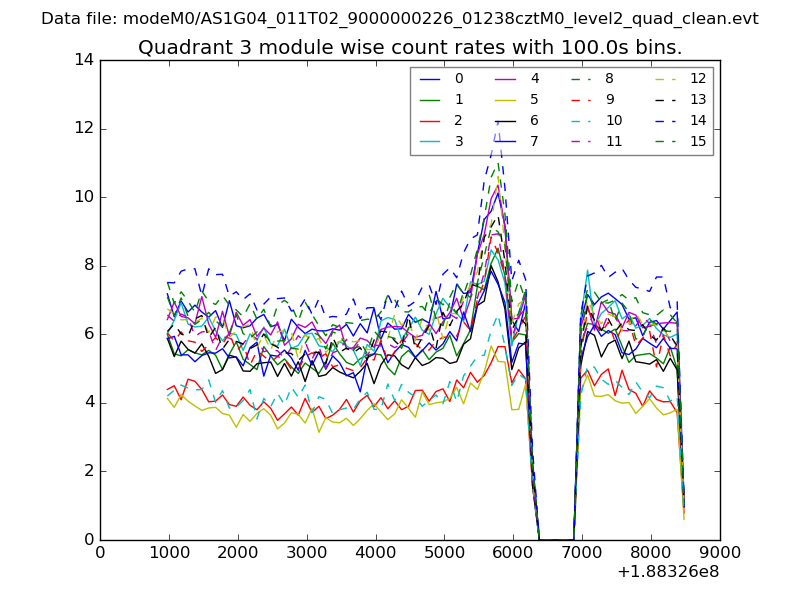
| Module-wise count rates for Quadrant C Data is divided into 100 sec bins |
 |
 |
| Module-wise count rates for Quadrant D Data is divided into 100 sec bins |
 |
 |
| Parameter | Plot |
|---|---|
| CZT HV Monitor | 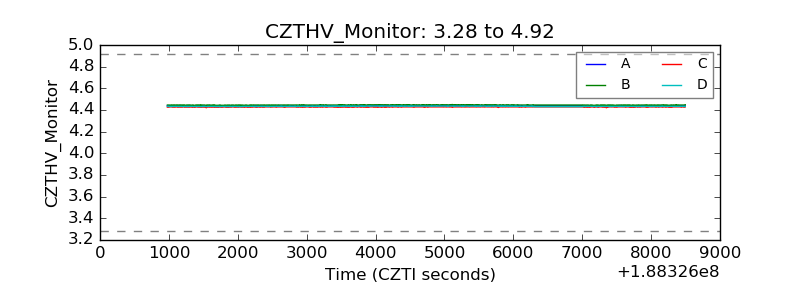 |
| D_VDD |  |
| Temperature 1 | 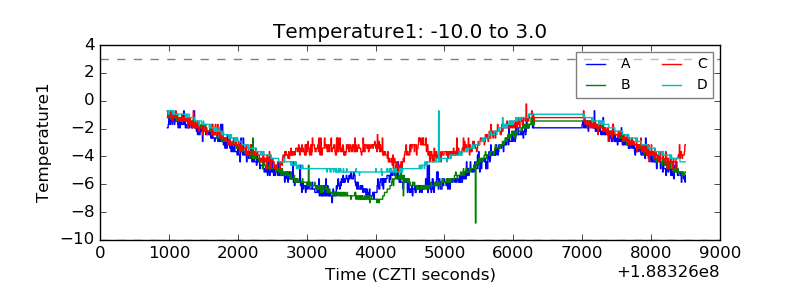 |
| Veto HV Monitor | 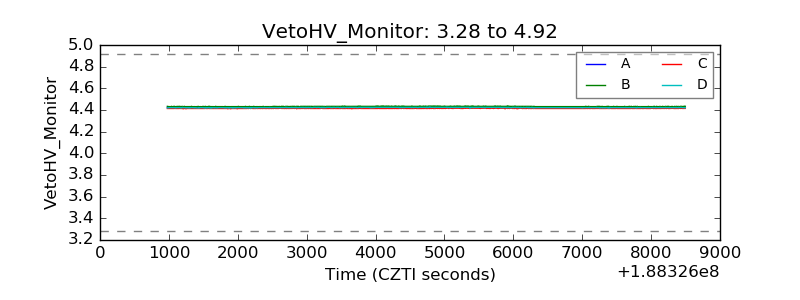 |
| Veto LLD | 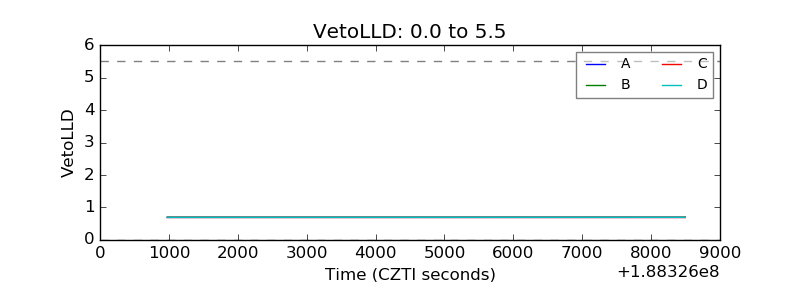 |
| Alpha Counter | 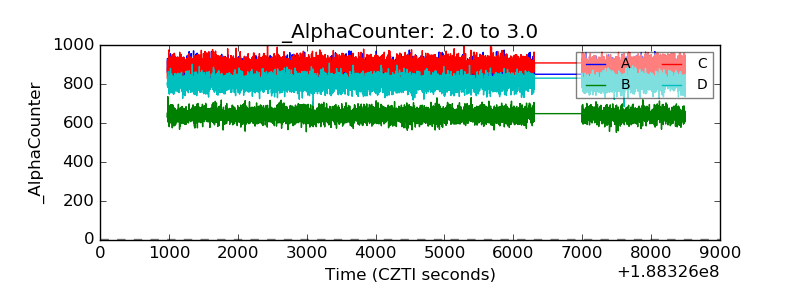 |
| _CPM_Rate | 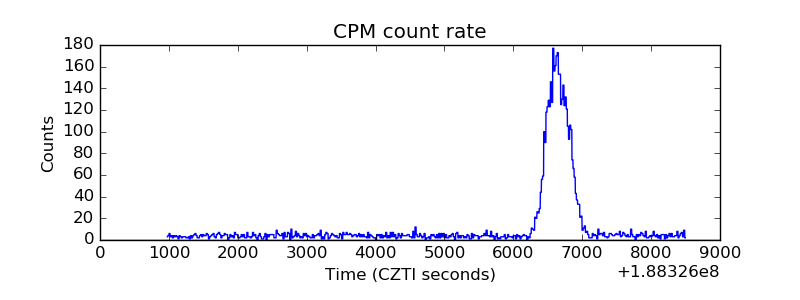 |
| CZT Counter | 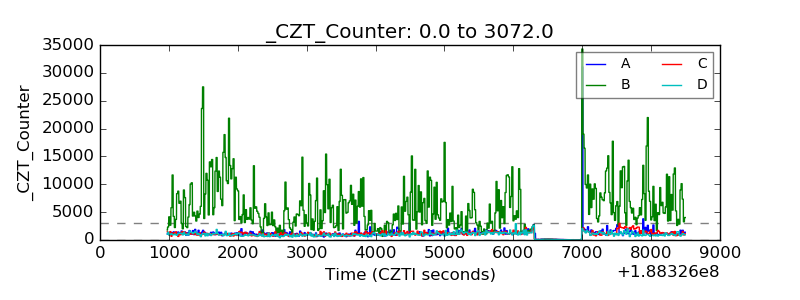 |
| +2.5 Volts monitor |  |
| +5 Volts monitor |  |
| _ROLL_ROT | 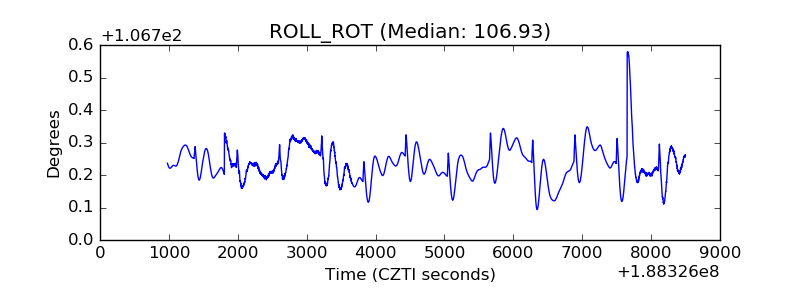 |
| _Roll_DEC | 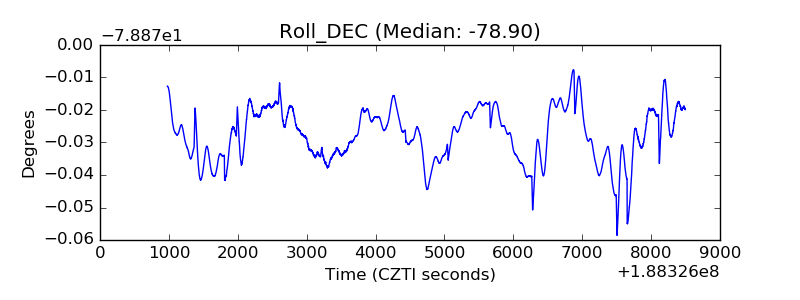 |
| _Roll_RA | 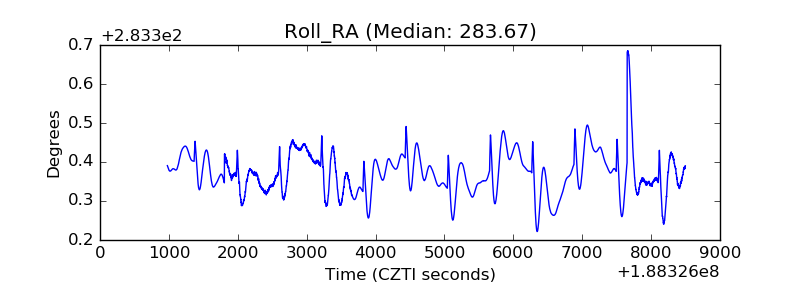 |
| Veto Counter | 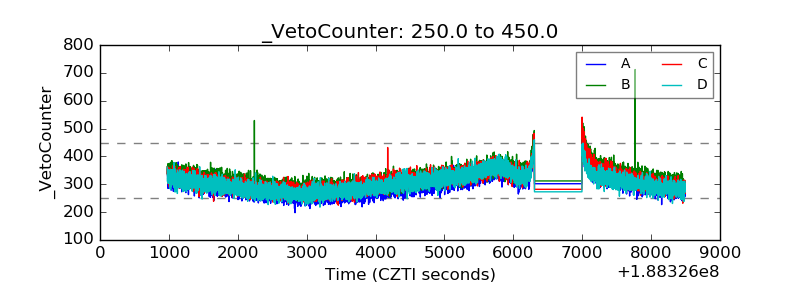 |