| Param | Original file | Final file |
|---|---|---|
| Filename | modeM0/AS1G04_011T02_9000000226_01239cztM0_level2.evt | modeM0/AS1G04_011T02_9000000226_01239cztM0_level2_quad_clean.evt |
| Size (bytes) | 1,452,450,240 | 95,492,160 |
| Size | 1.4 GB | 91.1 MB |
| Events in quadrant A | 9,318,650 | 692,074 |
| Events in quadrant B | 17,163,001 | 427,545 |
| Events in quadrant C | 8,071,079 | 688,388 |
| Events in quadrant D | 9,015,026 | 636,670 |
| Mode SS | |||
|---|---|---|---|
| Quadrant | BADHDUFLAG | Total packets | Discarded packets |
| A | 0 | 130 | 0 |
| B | 0 | 130 | 0 |
| C | 0 | 130 | 0 |
| D | 0 | 130 | 0 |
| Mode M9 | |||
|---|---|---|---|
| Quadrant | BADHDUFLAG | Total packets | Discarded packets |
| A | 0 | 9 | 0 |
| B | 0 | 9 | 0 |
| C | 0 | 9 | 0 |
| D | 0 | 9 | 0 |
| Mode M0 | |||
|---|---|---|---|
| Quadrant | BADHDUFLAG | Total packets | Discarded packets |
| A | 0 | 32181 | 2 |
| B | 0 | 56181 | 1 |
| C | 0 | 28525 | 1 |
| D | 0 | 31440 | 1 |
| Quadrant | Total seconds | Saturated seconds | Saturation percentage |
|---|---|---|---|
| A | 6375 | 66 | 1.035294% |
| B | 6375 | 4213 | 66.086275% |
| C | 6375 | 18 | 0.282353% |
| D | 6375 | 731 | 11.466667% |
Noise dominated data is calculated using 1-second bins in cleaned event files. If a bin has >2000 counts, and if more than 50% of those come from <1% of pixels, then it is considered to be noise-dominated and hence unusable.
| Quadrant | # 1 sec bins | Bins with >0 counts | Bins with >2000 counts | High rate bins dominated by noise | Noise dominated (total time) | Noise dominated (detector-on time) | Marked lightcurve |
|---|---|---|---|---|---|---|---|
| A | 7245 | 6375 | 809 | 809 | 11.17% | 12.69% | 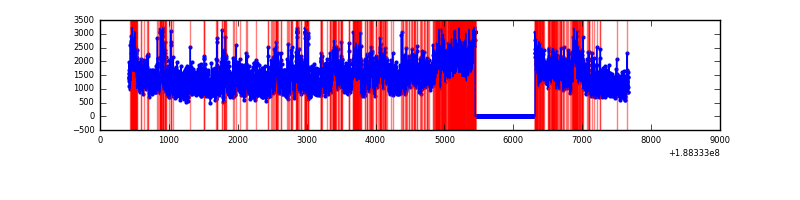 |
| B | 7245 | 6375 | 5156 | 5156 | 71.17% | 80.88% | 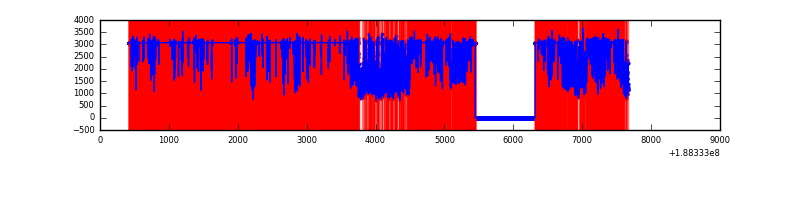 |
| C | 7245 | 6376 | 383 | 383 | 5.29% | 6.01% | 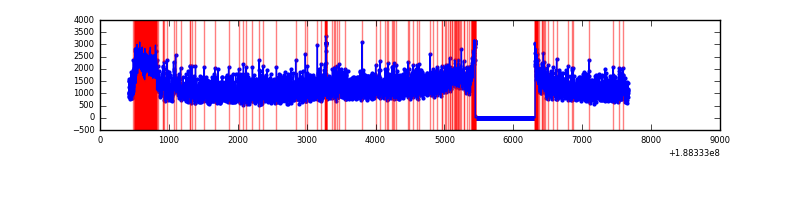 |
| D | 7245 | 6376 | 1174 | 1174 | 16.20% | 18.41% | 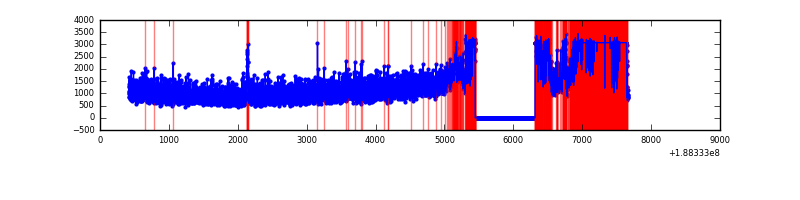 |
Top three noisy pixels from each quadrant. If the there are fewer than three noisy pixels in the level2.evt file, extra rows are filled as -1
| Pixel properties | Quadrant properties | ||||||
|---|---|---|---|---|---|---|---|
| Quadrant | DetID | PixID | Counts | Sigma | Mean | Median | Sigma |
| A | 3 | 80 | 1529777 | 3269.37 | 1986 | 2005 | 467.3 |
| A | 15 | 127 | 134530 | 283.6 | 1986 | 2005 | 467.3 |
| A | 12 | 243 | 27718 | 55.02 | 1986 | 2005 | 467.3 |
| B | 2 | 32 | 11328966 | 35182.7 | 1379 | 1386 | 322.0 |
| B | 8 | 4 | 460682 | 1426.54 | 1379 | 1386 | 322.0 |
| B | 15 | 22 | 40381 | 121.12 | 1379 | 1386 | 322.0 |
| C | 9 | 52 | 418702 | 812.01 | 1861 | 1932 | 513.3 |
| C | 15 | 241 | 333456 | 645.92 | 1861 | 1932 | 513.3 |
| C | 3 | 111 | 22838 | 40.73 | 1861 | 1932 | 513.3 |
| D | 10 | 84 | 2429424 | 4628.12 | 1729 | 1795 | 524.5 |
| D | 2 | 88 | 44222 | 80.88 | 1729 | 1795 | 524.5 |
| D | 10 | 85 | 43708 | 79.9 | 1729 | 1795 | 524.5 |
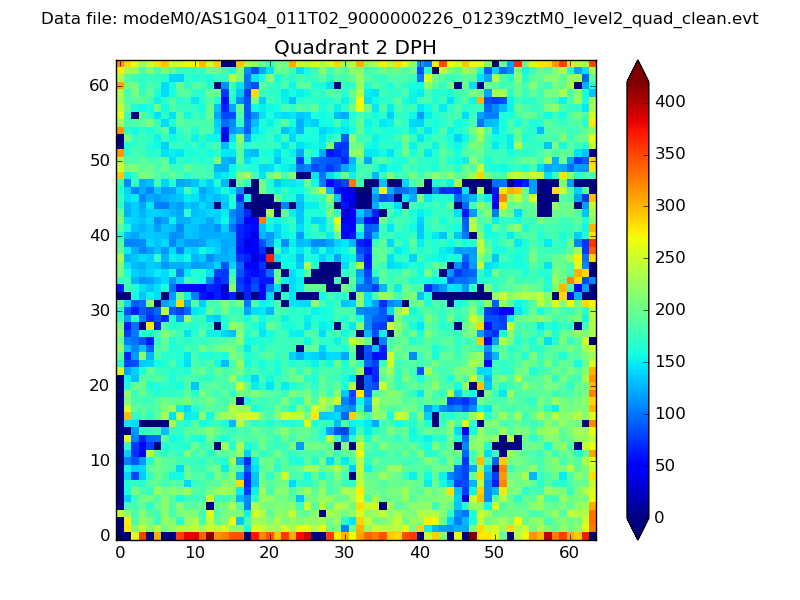
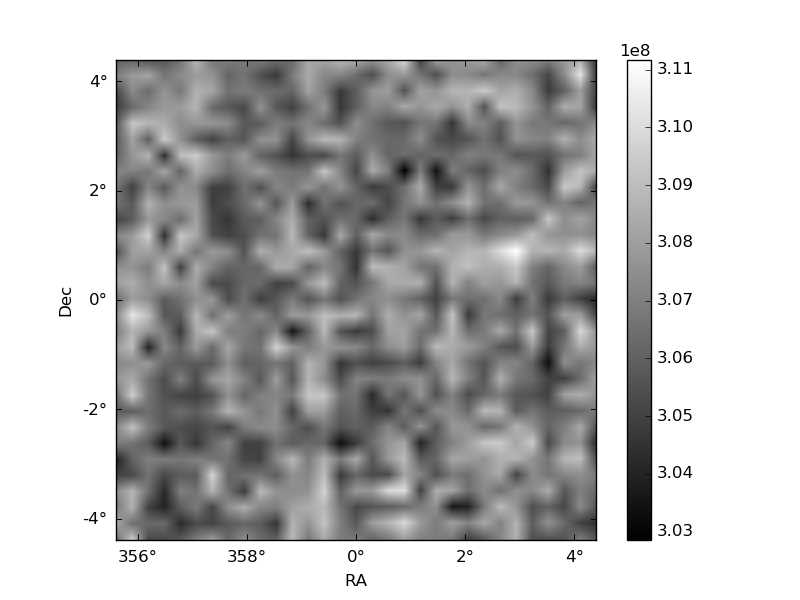
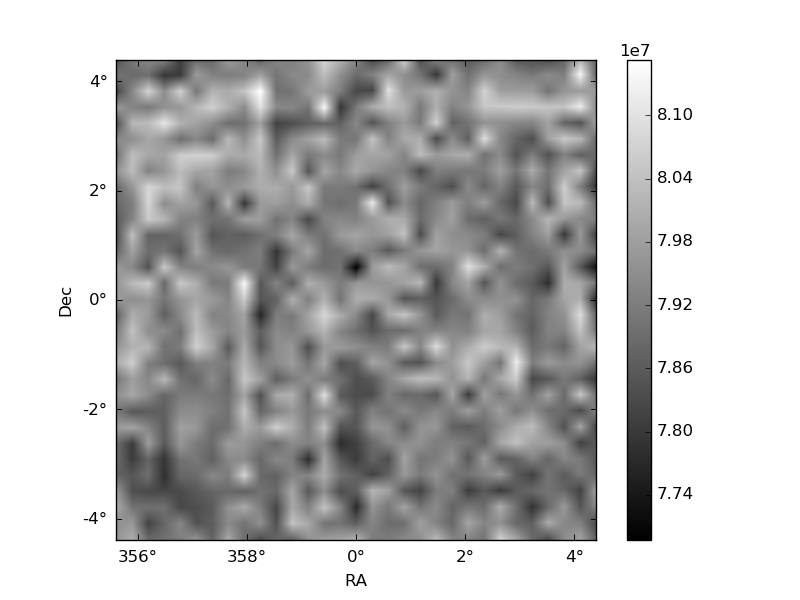
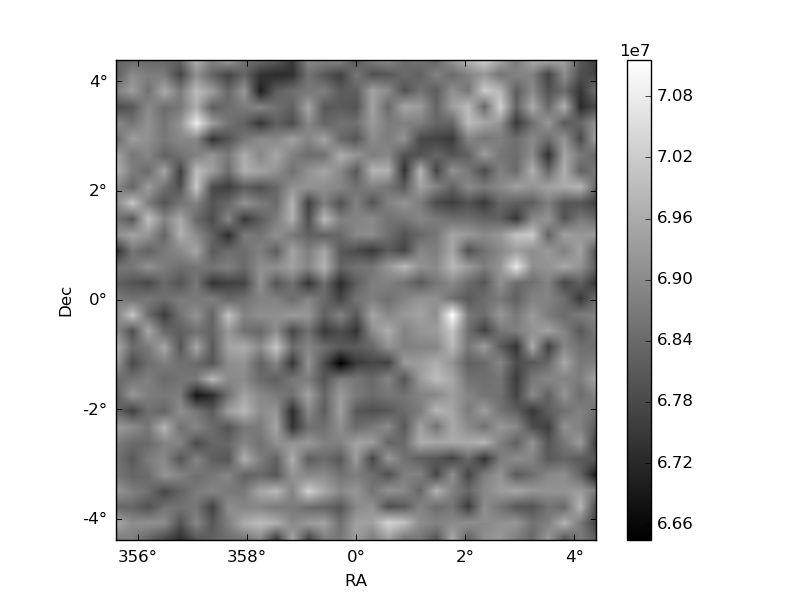
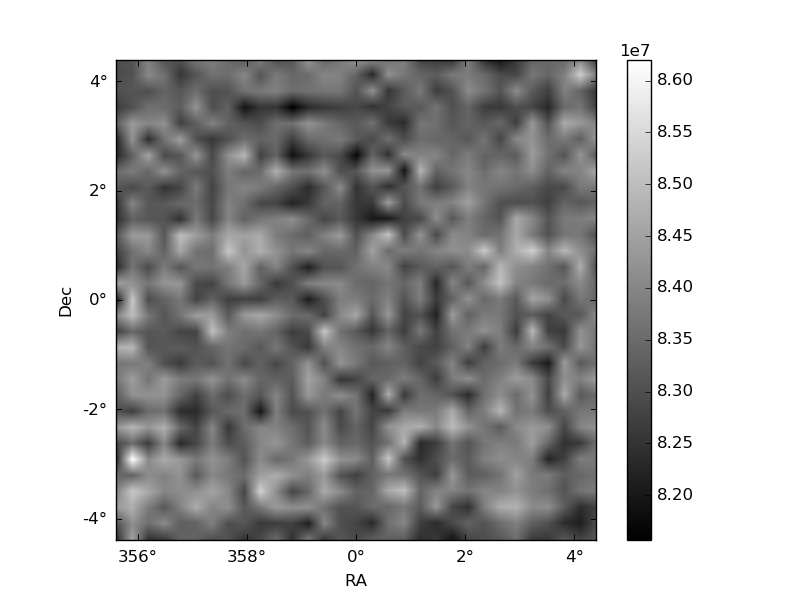
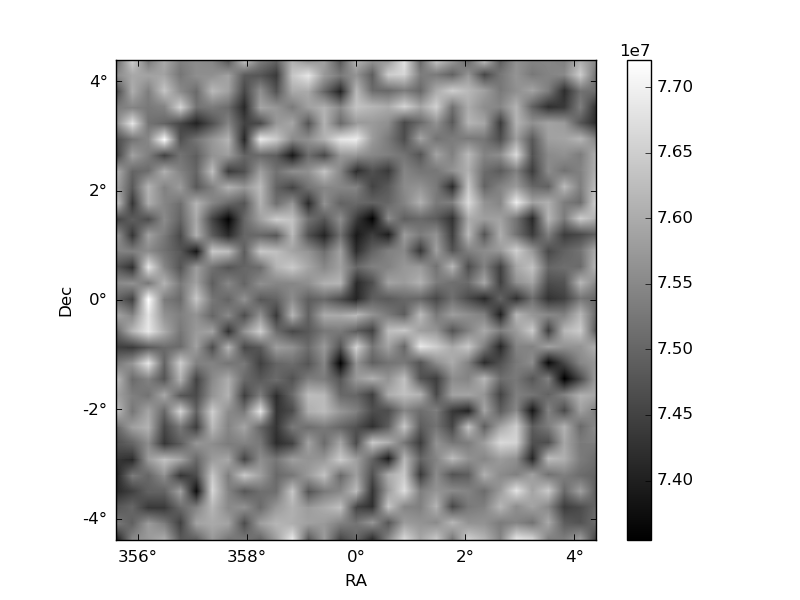
Histogram calculated using DETX and DETY for each event in the final _common_clean file
| Quadrant A | 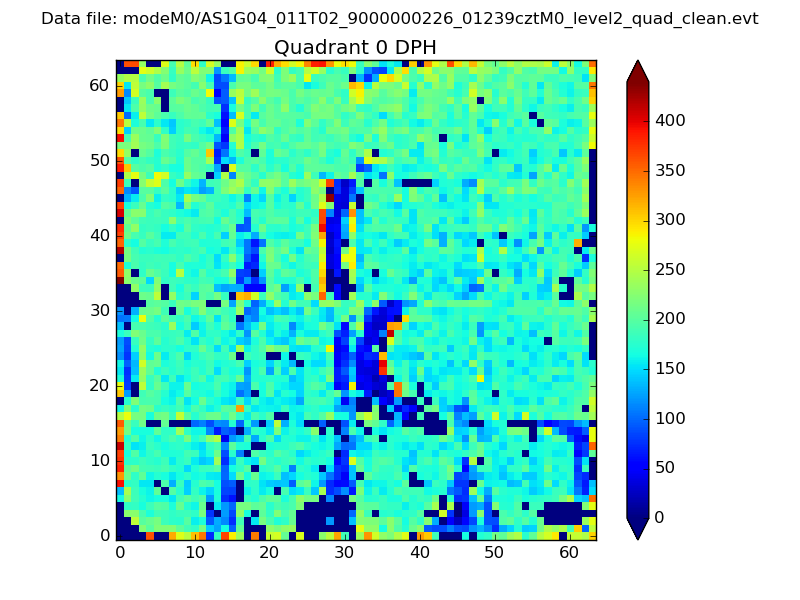 |
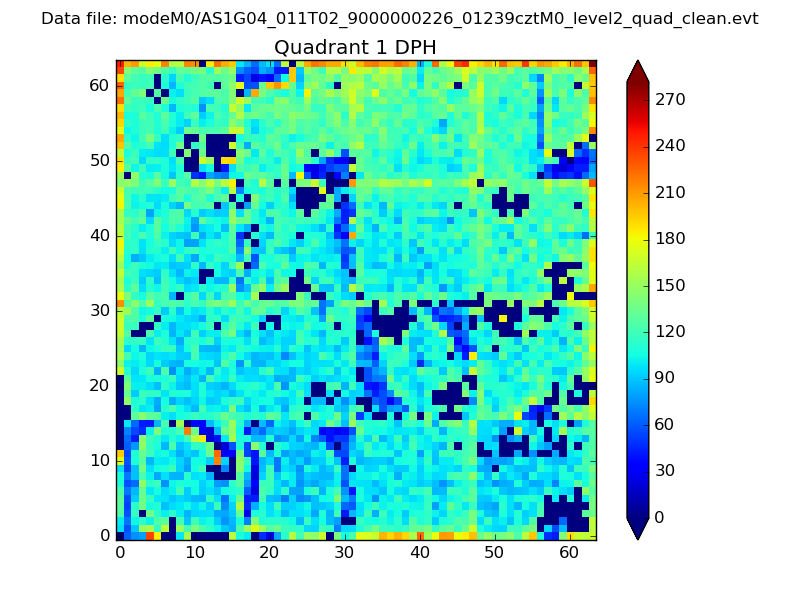 |
Quadrant B |
|---|---|---|---|
| Quadrant D | 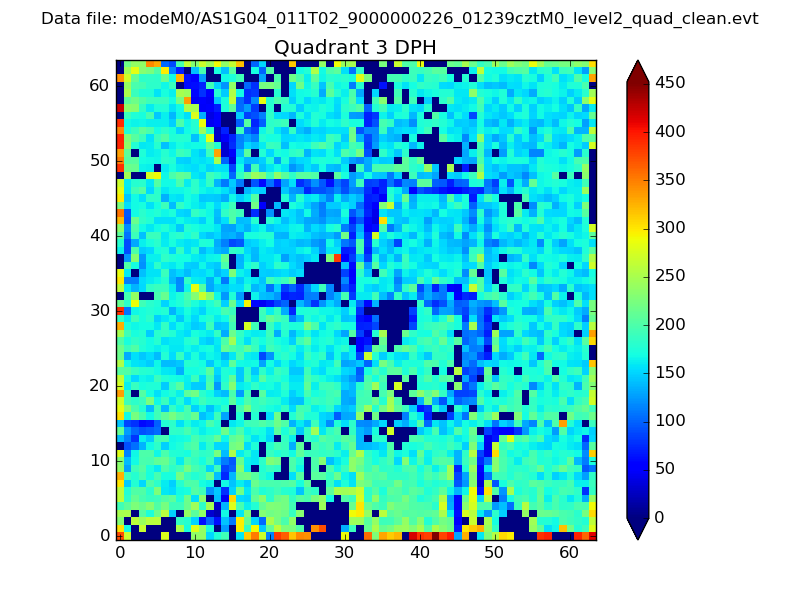 |
 |
Quadrant C |
| Plot type | Count rate plots | Images |
|---|---|---|
| Comparison with Poisson distribution Blue bars denote a histogram of data divided into 1 sec bins. Red curve is a Poisson curve with rate = median count rate of data. |
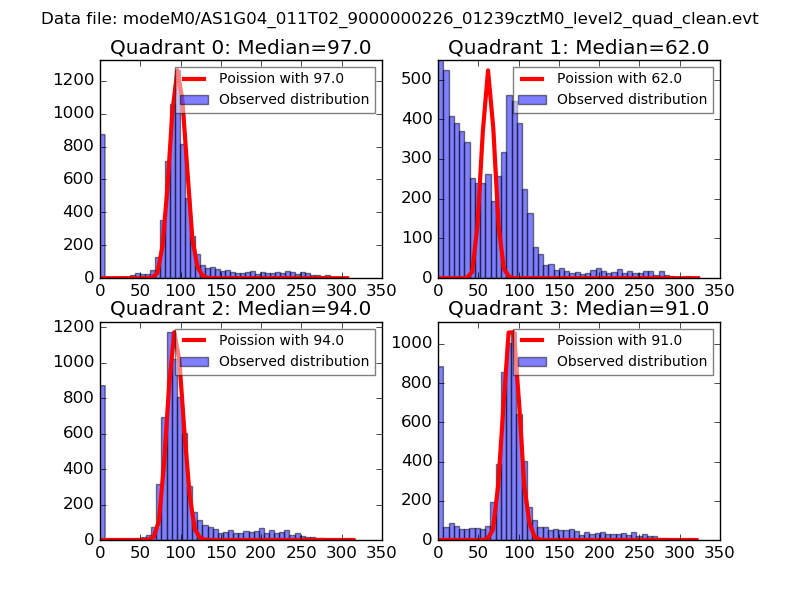 |
 |
| Quadrant-wise count rates Data is divided into 100 sec bins |
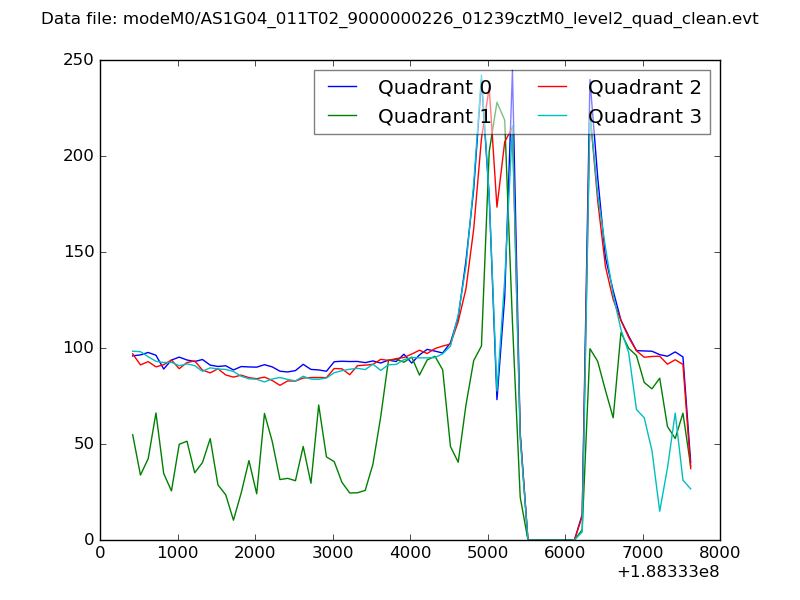 |
|
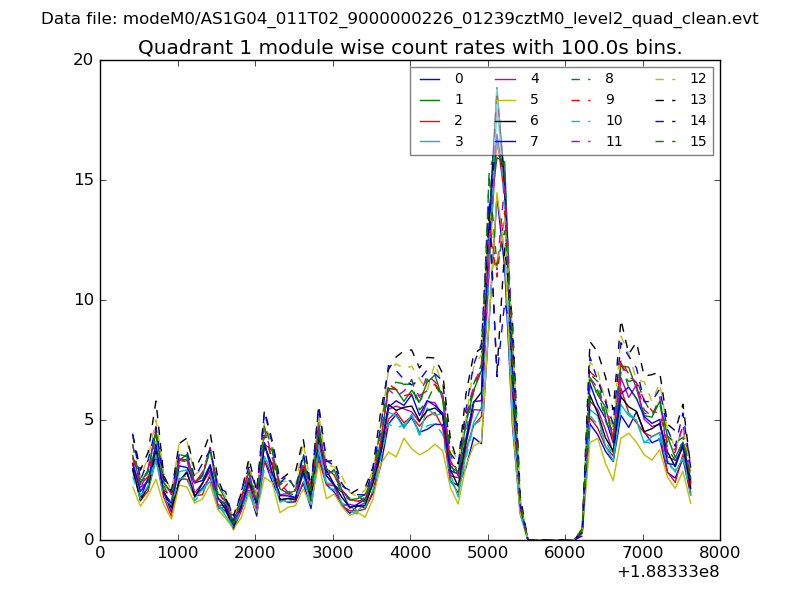
| Module-wise count rates for Quadrant A Data is divided into 100 sec bins |
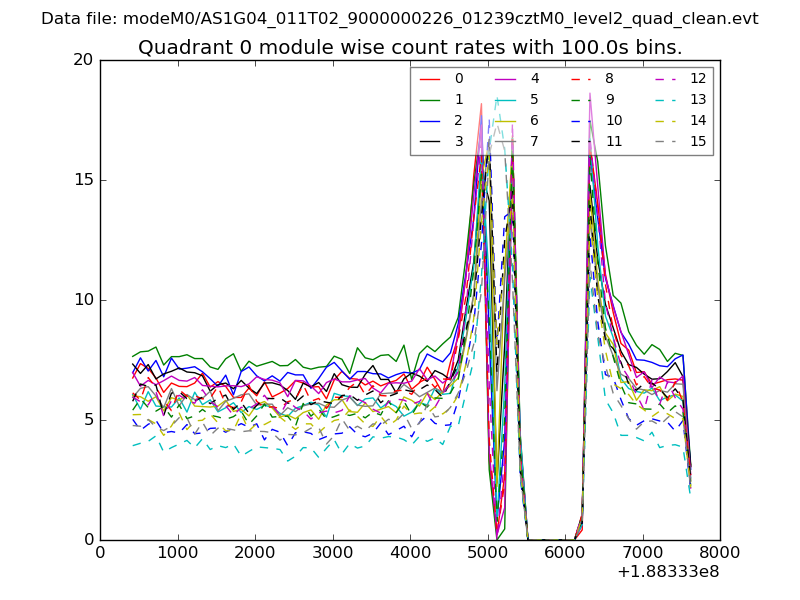 |
 |
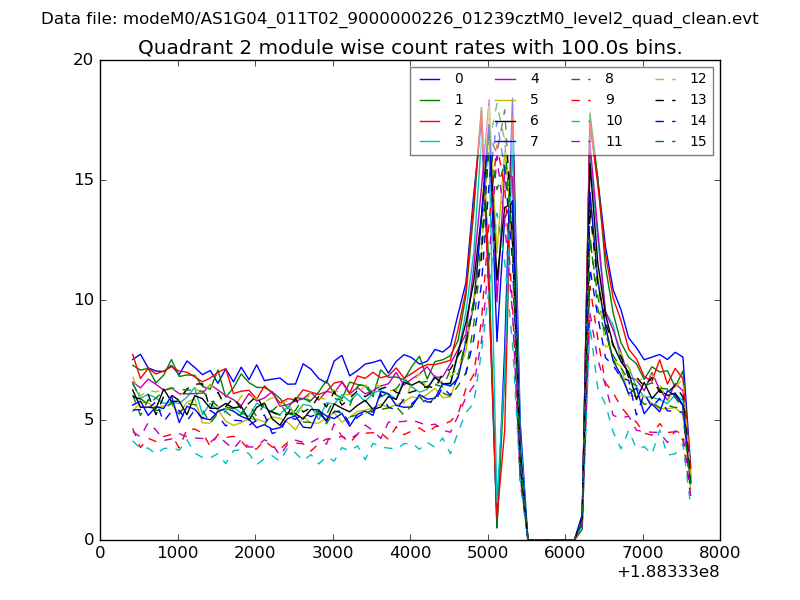
| Module-wise count rates for Quadrant B Data is divided into 100 sec bins |
 |
 |
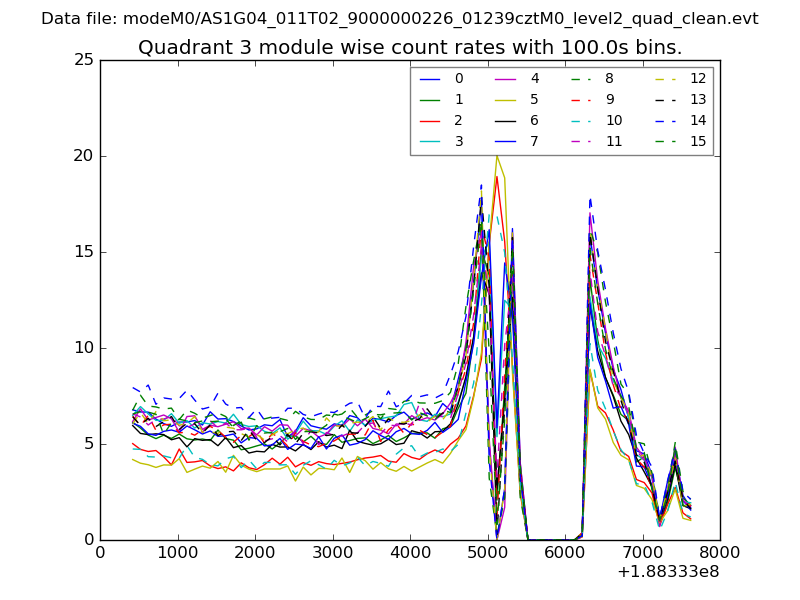
| Module-wise count rates for Quadrant C Data is divided into 100 sec bins |
 |
 |
| Module-wise count rates for Quadrant D Data is divided into 100 sec bins |
 |
 |
| Parameter | Plot |
|---|---|
| CZT HV Monitor | 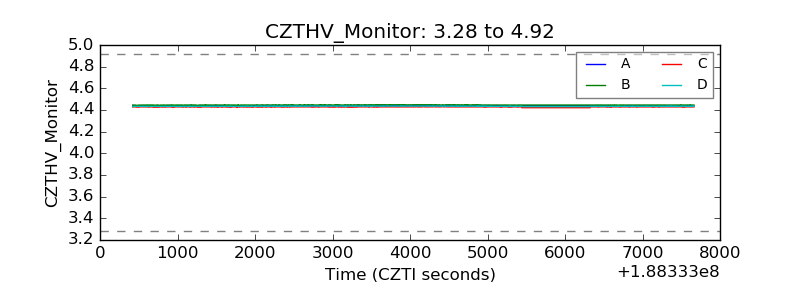 |
| D_VDD | 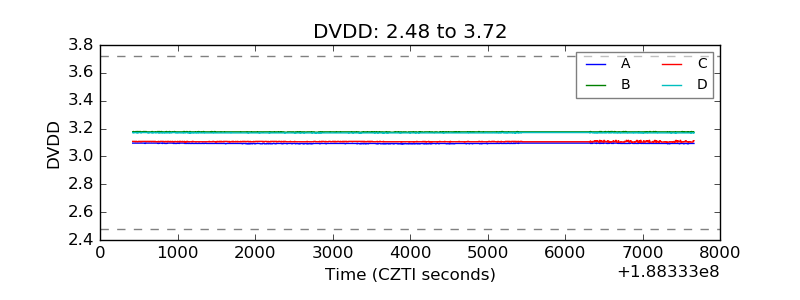 |
| Temperature 1 | 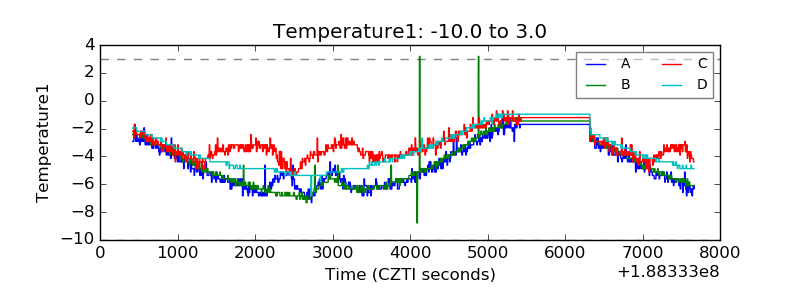 |
| Veto HV Monitor | 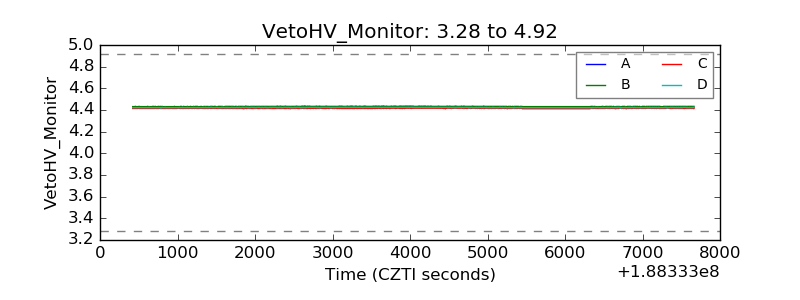 |
| Veto LLD | 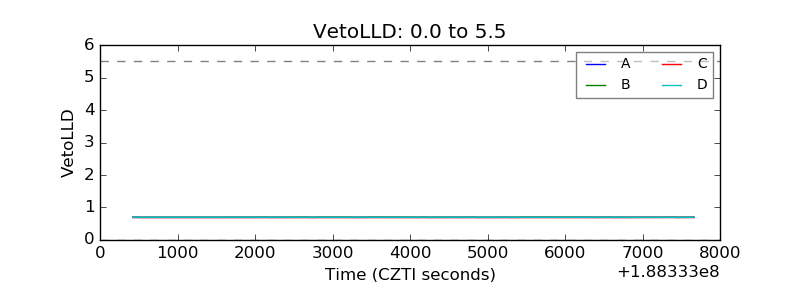 |
| Alpha Counter | 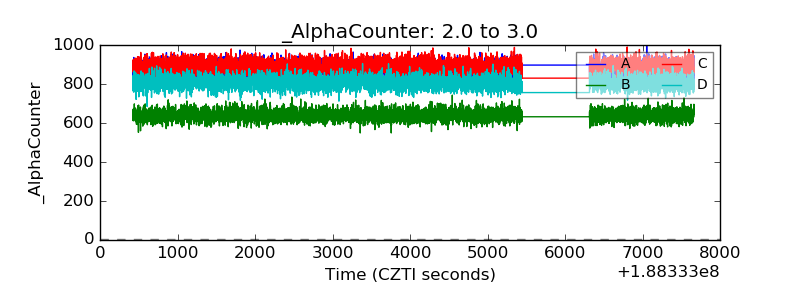 |
| _CPM_Rate | 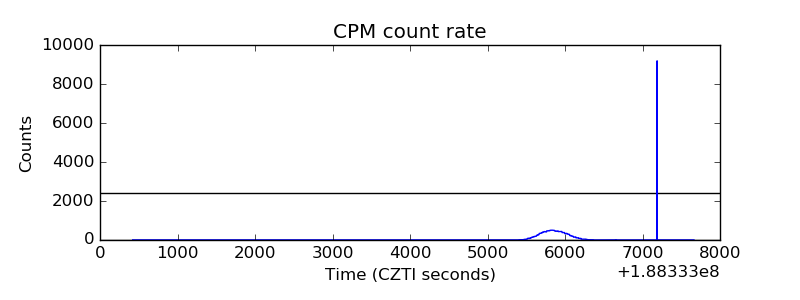 |
| CZT Counter |  |
| +2.5 Volts monitor |  |
| +5 Volts monitor |  |
| _ROLL_ROT | 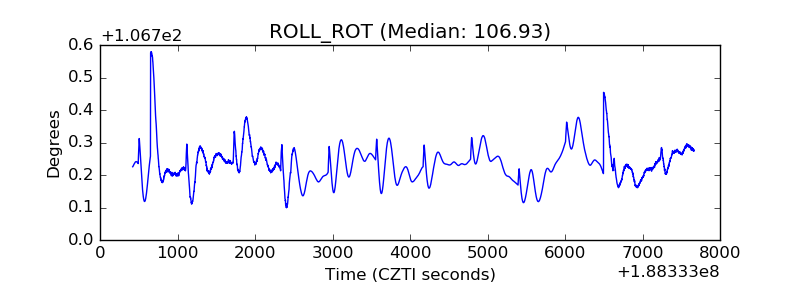 |
| _Roll_DEC | 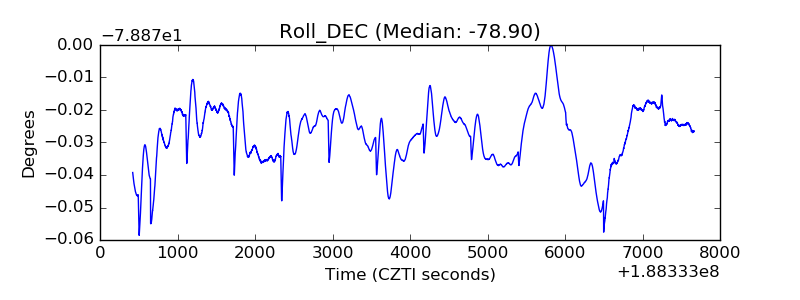 |
| _Roll_RA | 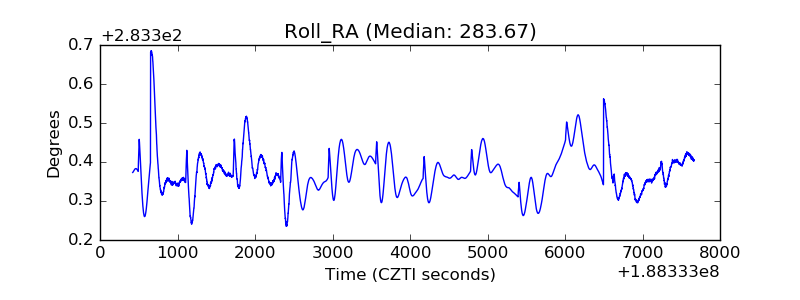 |
| Veto Counter | 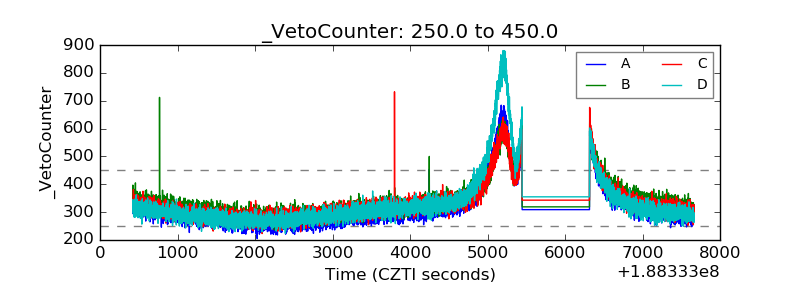 |