| Param | Original file | Final file |
|---|---|---|
| Filename | modeM0/AS1G04_011T02_9000000226_01240cztM0_level2.evt | modeM0/AS1G04_011T02_9000000226_01240cztM0_level2_quad_clean.evt |
| Size (bytes) | 1,455,779,520 | 101,966,400 |
| Size | 1.4 GB | 97.2 MB |
| Events in quadrant A | 9,402,280 | 711,024 |
| Events in quadrant B | 15,422,672 | 571,098 |
| Events in quadrant C | 8,228,369 | 697,239 |
| Events in quadrant D | 10,600,215 | 645,575 |
| Mode SS | |||
|---|---|---|---|
| Quadrant | BADHDUFLAG | Total packets | Discarded packets |
| A | 0 | 136 | 0 |
| B | 0 | 136 | 0 |
| C | 0 | 136 | 0 |
| D | 0 | 136 | 0 |
| Mode M9 | |||
|---|---|---|---|
| Quadrant | BADHDUFLAG | Total packets | Discarded packets |
| A | 0 | 10 | 0 |
| B | 0 | 10 | 0 |
| C | 0 | 10 | 0 |
| D | 0 | 11 | 0 |
| Mode M0 | |||
|---|---|---|---|
| Quadrant | BADHDUFLAG | Total packets | Discarded packets |
| A | 0 | 32604 | 3 |
| B | 0 | 50864 | 2 |
| C | 0 | 29140 | 2 |
| D | 0 | 36378 | 2 |
| Quadrant | Total seconds | Saturated seconds | Saturation percentage |
|---|---|---|---|
| A | 6613 | 103 | 1.557538% |
| B | 6613 | 2566 | 38.802359% |
| C | 6613 | 77 | 1.164373% |
| D | 6613 | 901 | 13.624679% |
Noise dominated data is calculated using 1-second bins in cleaned event files. If a bin has >2000 counts, and if more than 50% of those come from <1% of pixels, then it is considered to be noise-dominated and hence unusable.
| Quadrant | # 1 sec bins | Bins with >0 counts | Bins with >2000 counts | High rate bins dominated by noise | Noise dominated (total time) | Noise dominated (detector-on time) | Marked lightcurve |
|---|---|---|---|---|---|---|---|
| A | 7638 | 6613 | 881 | 881 | 11.53% | 13.32% | 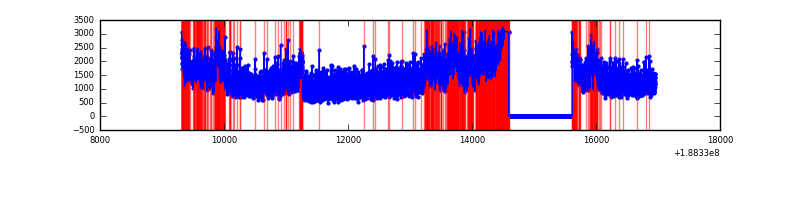 |
| B | 7637 | 6612 | 4216 | 4216 | 55.20% | 63.76% | 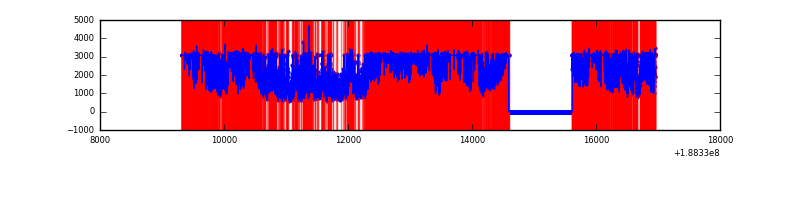 |
| C | 7638 | 6613 | 310 | 310 | 4.06% | 4.69% | 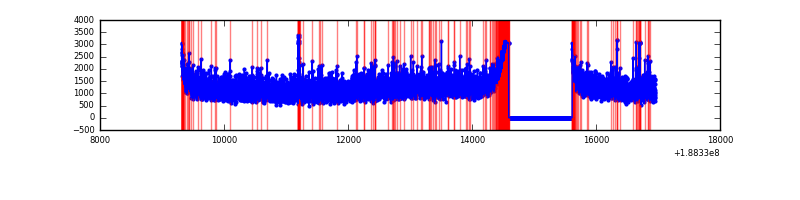 |
| D | 7638 | 6613 | 1558 | 1558 | 20.40% | 23.56% | 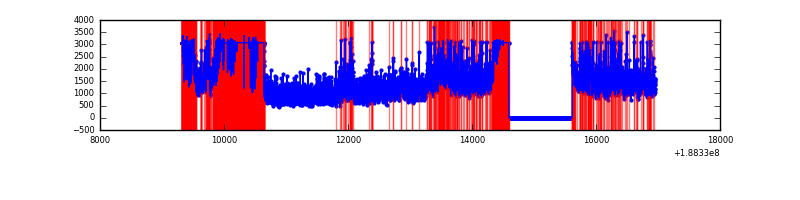 |
Top three noisy pixels from each quadrant. If the there are fewer than three noisy pixels in the level2.evt file, extra rows are filled as -1
| Pixel properties | Quadrant properties | ||||||
|---|---|---|---|---|---|---|---|
| Quadrant | DetID | PixID | Counts | Sigma | Mean | Median | Sigma |
| A | 3 | 80 | 1269667 | 2579.85 | 2111 | 2133 | 491.3 |
| A | 12 | 243 | 18079 | 32.46 | 2111 | 2133 | 491.3 |
| A | 13 | 9 | 9324 | 14.64 | 2111 | 2133 | 491.3 |
| B | 2 | 32 | 6950180 | 16015.4 | 1870 | 1878 | 433.9 |
| B | 5 | 191 | 773398 | 1778.3 | 1870 | 1878 | 433.9 |
| B | 8 | 4 | 500130 | 1148.44 | 1870 | 1878 | 433.9 |
| C | 15 | 241 | 339517 | 619.96 | 1984 | 2060 | 544.3 |
| C | 9 | 52 | 85849 | 153.93 | 1984 | 2060 | 544.3 |
| C | 3 | 111 | 26536 | 44.97 | 1984 | 2060 | 544.3 |
| D | 10 | 84 | 2503178 | 4547.35 | 1827 | 1898 | 550.1 |
| D | 1 | 239 | 651280 | 1180.58 | 1827 | 1898 | 550.1 |
| D | 12 | 22 | 362738 | 656.01 | 1827 | 1898 | 550.1 |
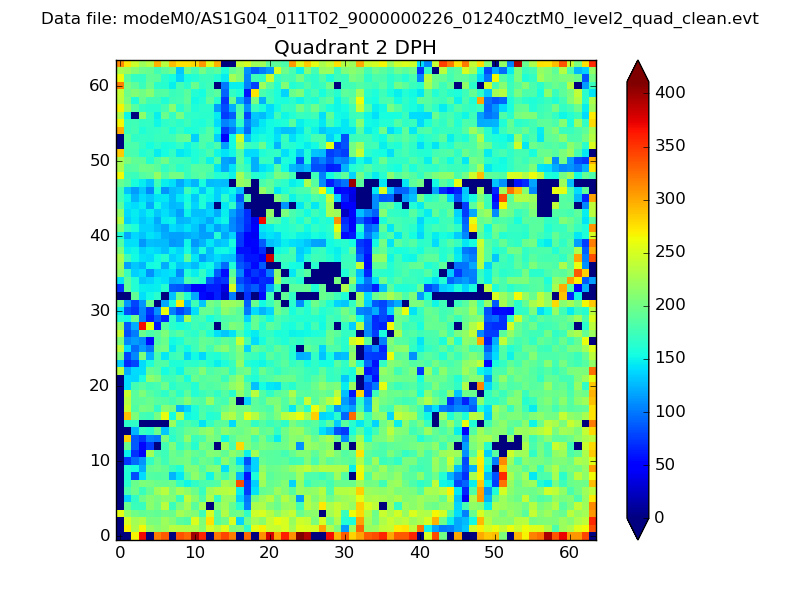
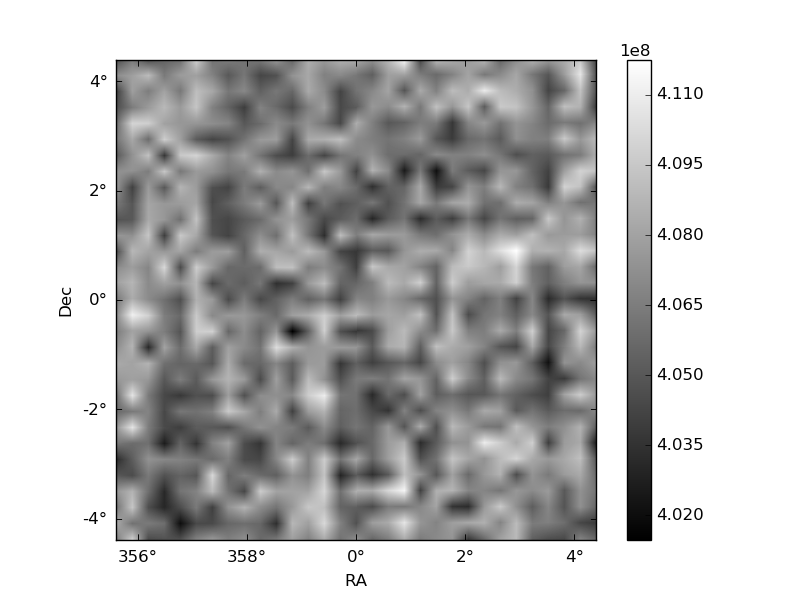
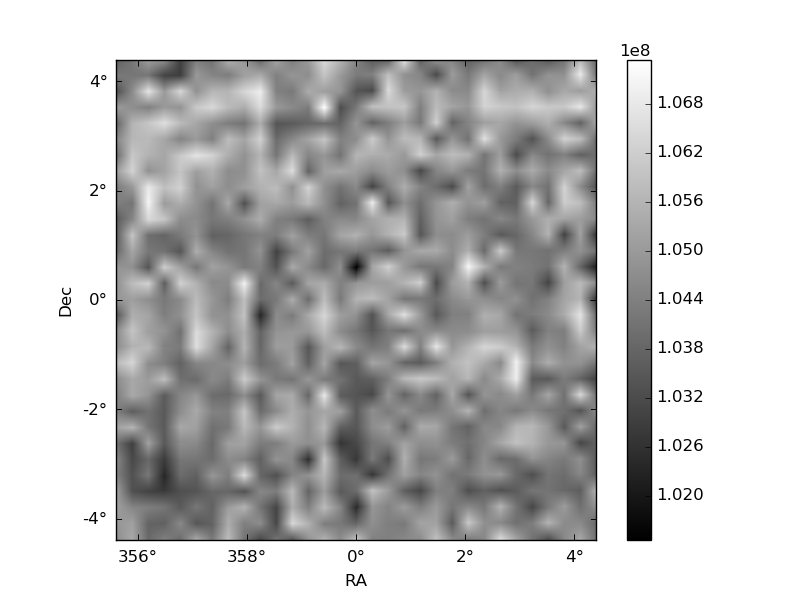
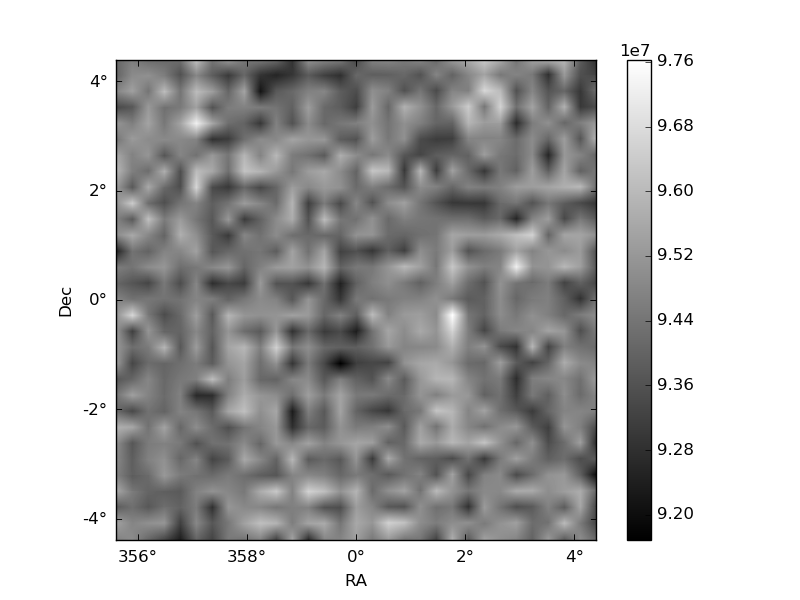
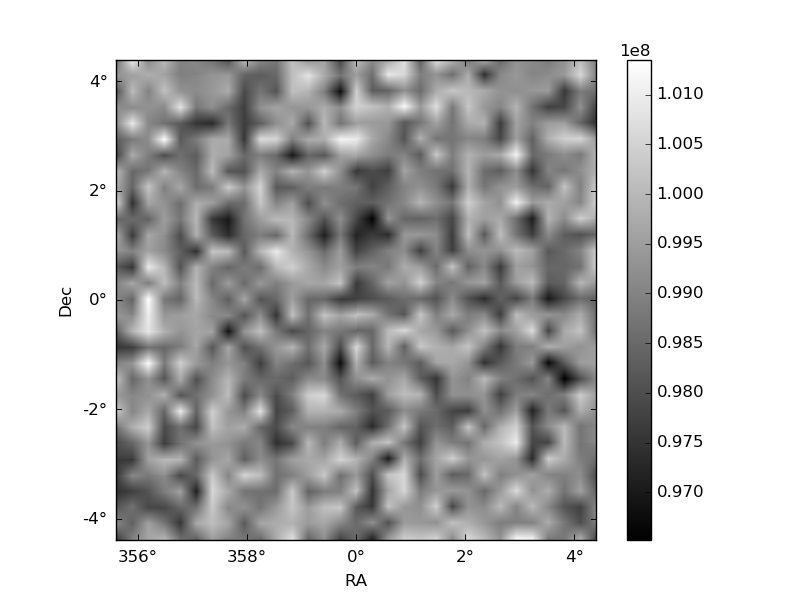
Histogram calculated using DETX and DETY for each event in the final _common_clean file
| Quadrant A | 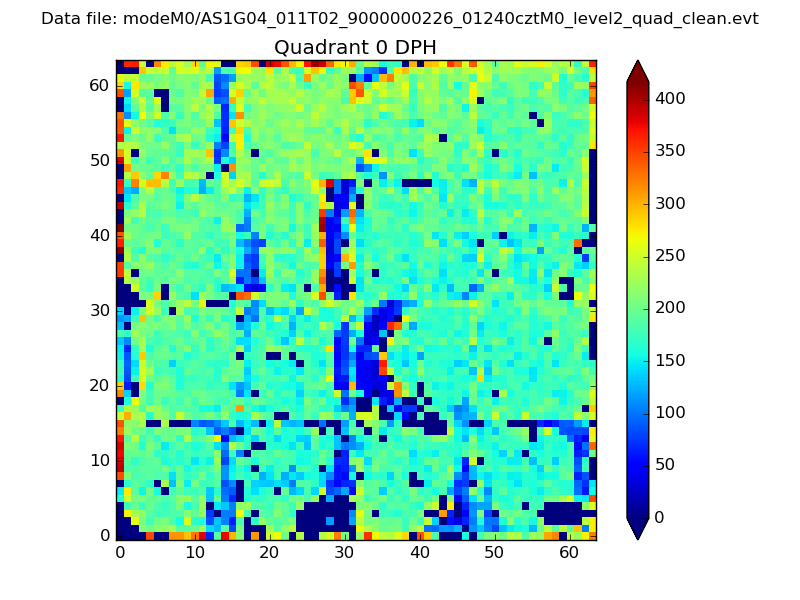 |
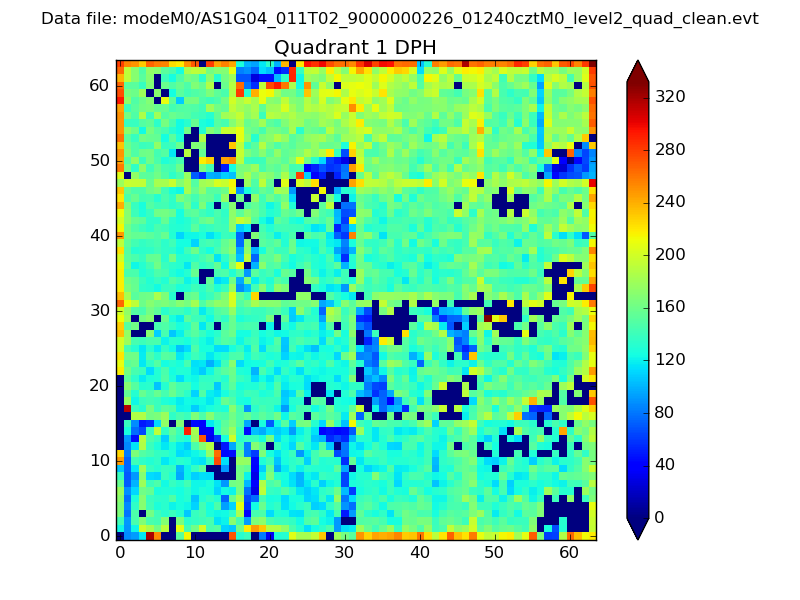 |
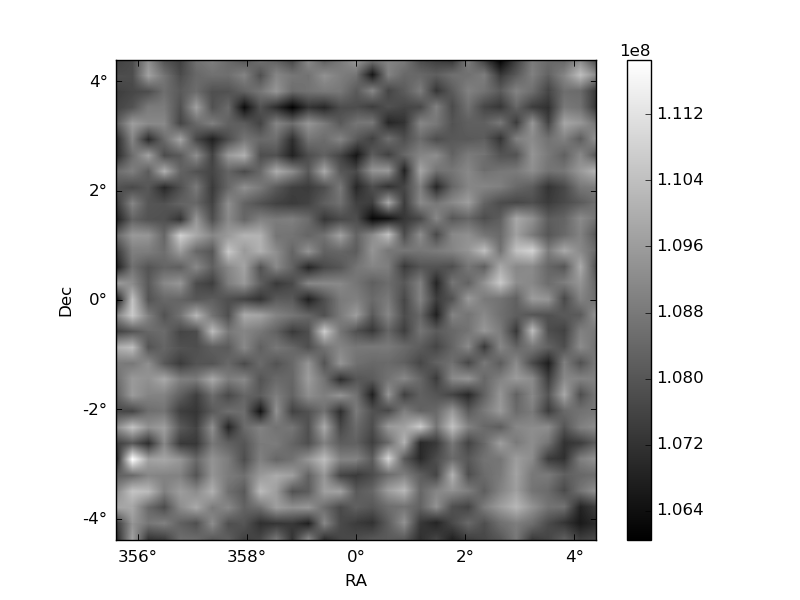
Quadrant B |
|---|---|---|---|
| Quadrant D | 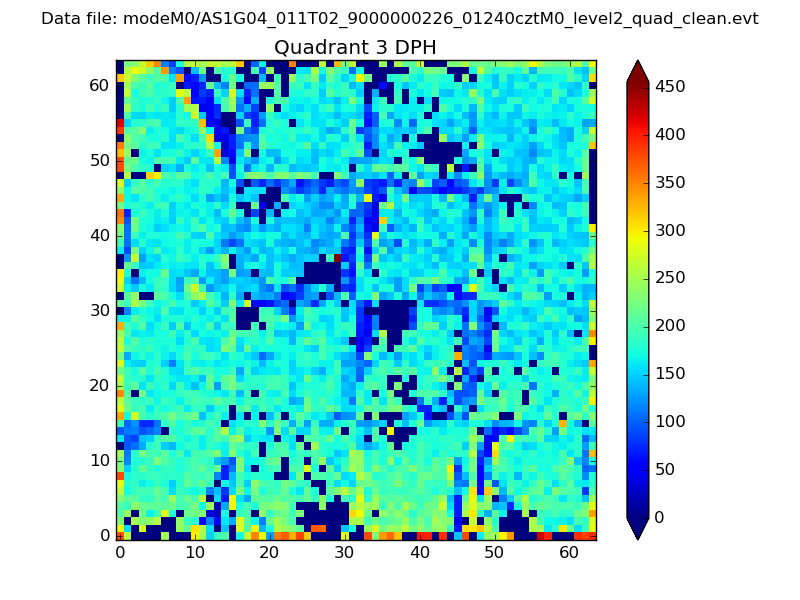 |
 |
Quadrant C |
| Plot type | Count rate plots | Images |
|---|---|---|
| Comparison with Poisson distribution Blue bars denote a histogram of data divided into 1 sec bins. Red curve is a Poisson curve with rate = median count rate of data. |
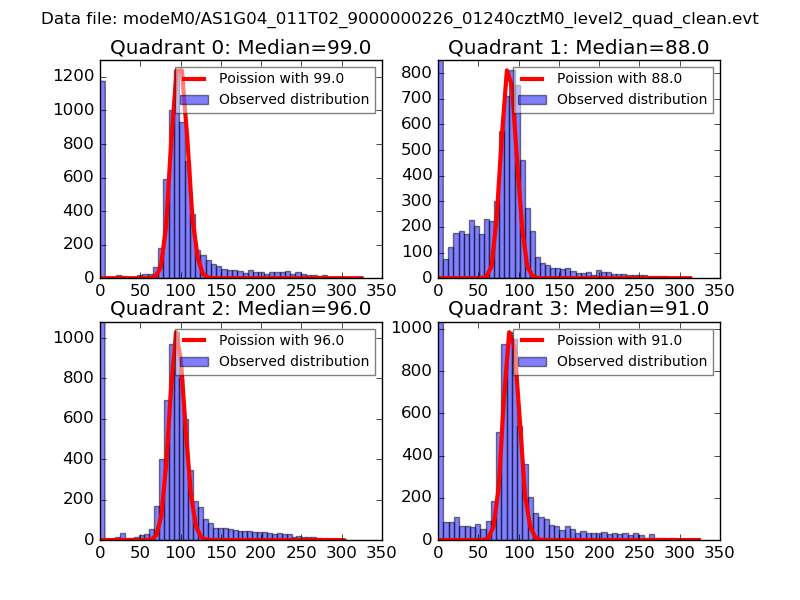 |
 |
| Quadrant-wise count rates Data is divided into 100 sec bins |
 |
|
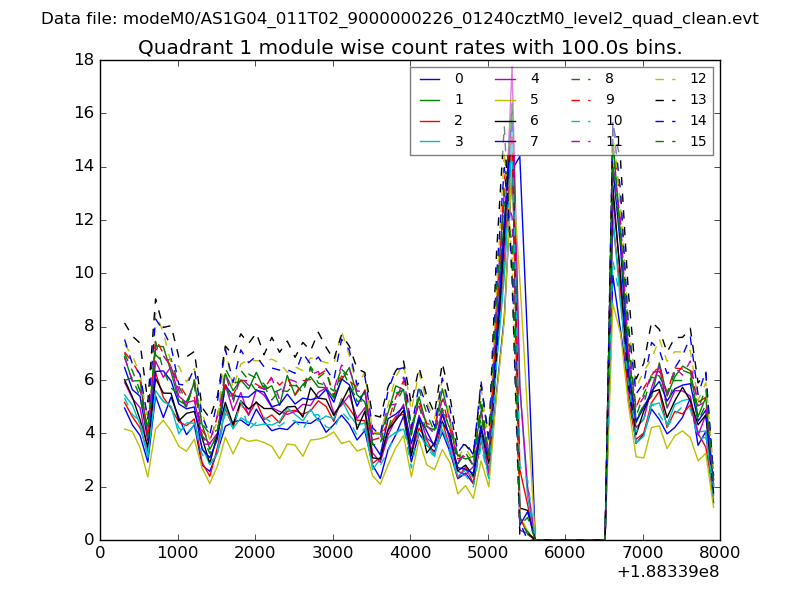
| Module-wise count rates for Quadrant A Data is divided into 100 sec bins |
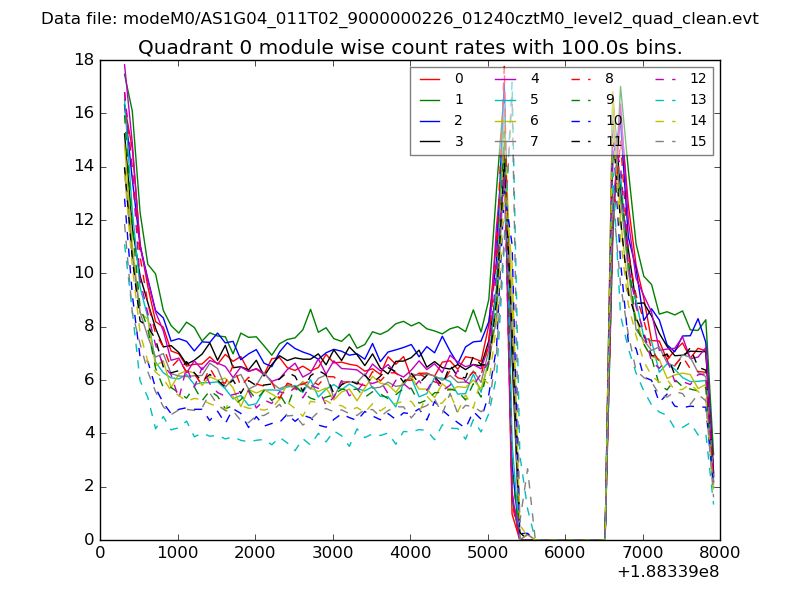 |
 |
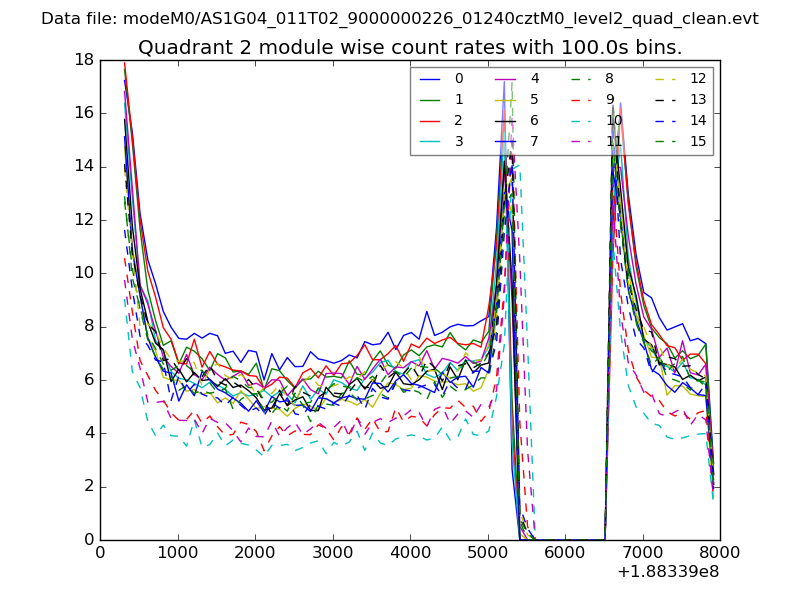
| Module-wise count rates for Quadrant B Data is divided into 100 sec bins |
 |
 |
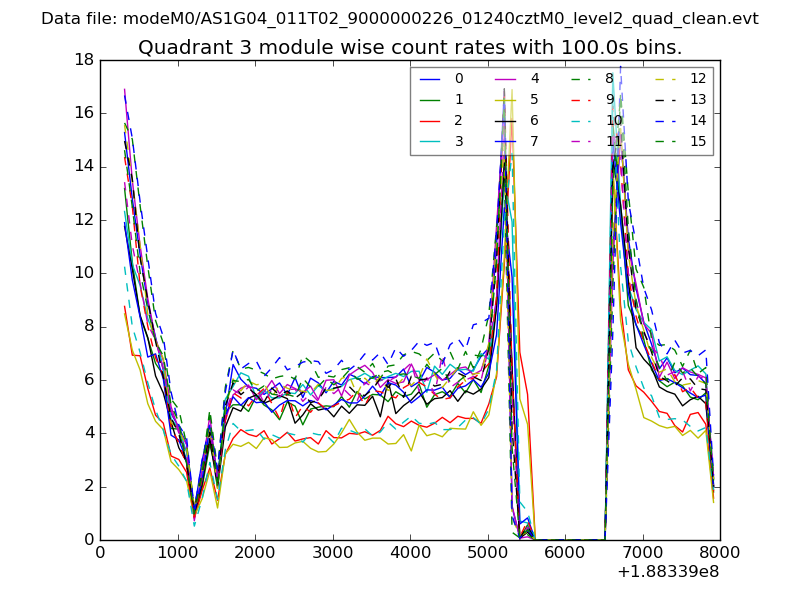
| Module-wise count rates for Quadrant C Data is divided into 100 sec bins |
 |
 |
| Module-wise count rates for Quadrant D Data is divided into 100 sec bins |
 |
 |
| Parameter | Plot |
|---|---|
| CZT HV Monitor | 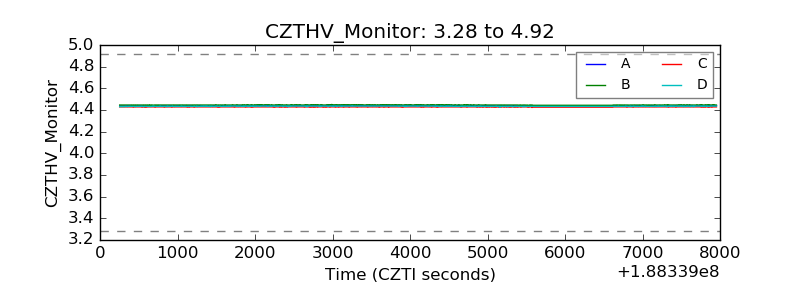 |
| D_VDD | 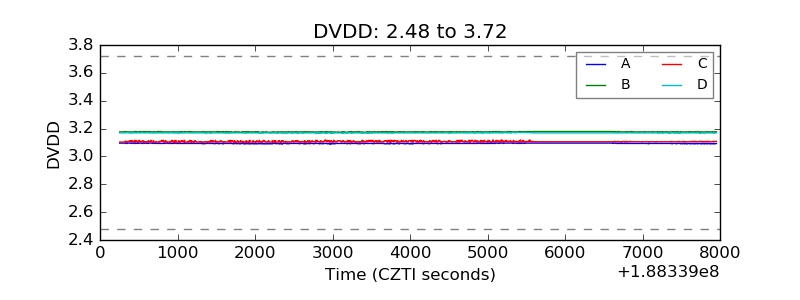 |
| Temperature 1 | 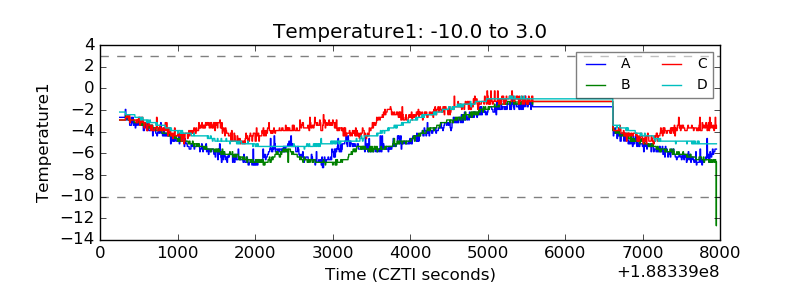 |
| Veto HV Monitor | 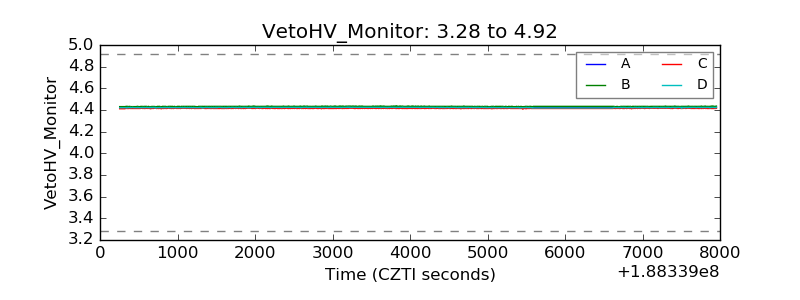 |
| Veto LLD | 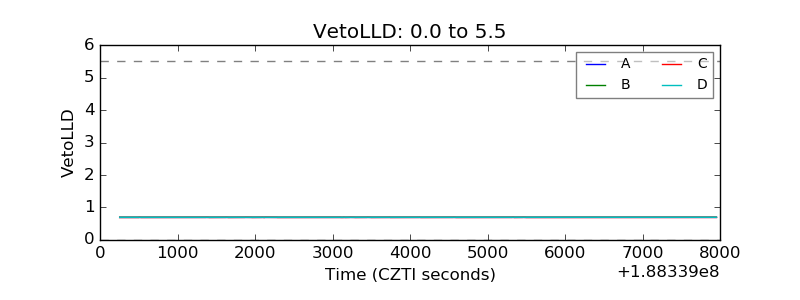 |
| Alpha Counter | 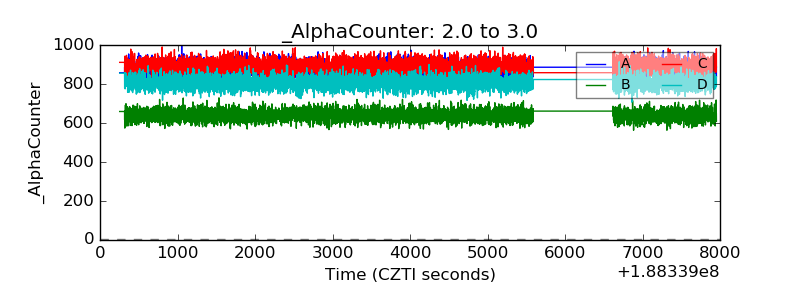 |
| _CPM_Rate | 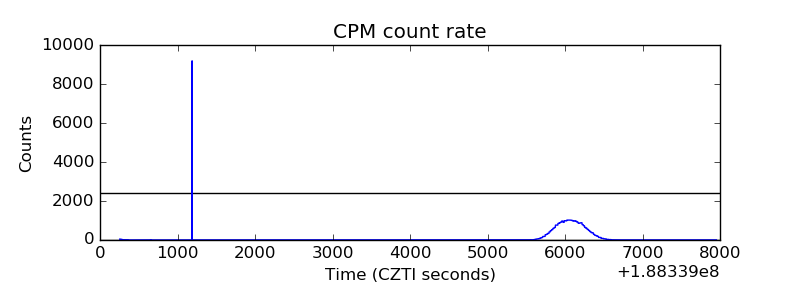 |
| CZT Counter | 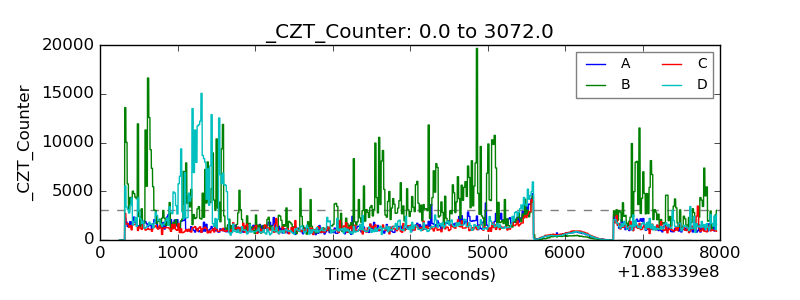 |
| +2.5 Volts monitor |  |
| +5 Volts monitor |  |
| _ROLL_ROT | 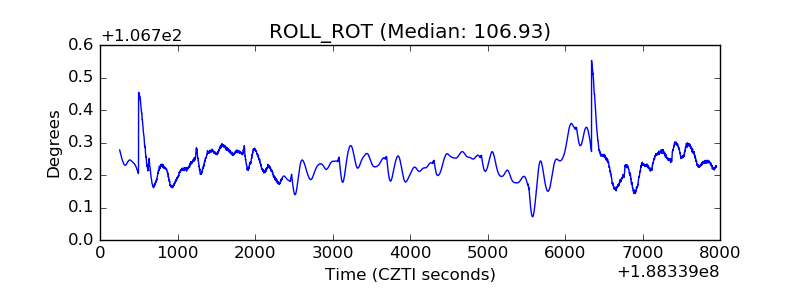 |
| _Roll_DEC | 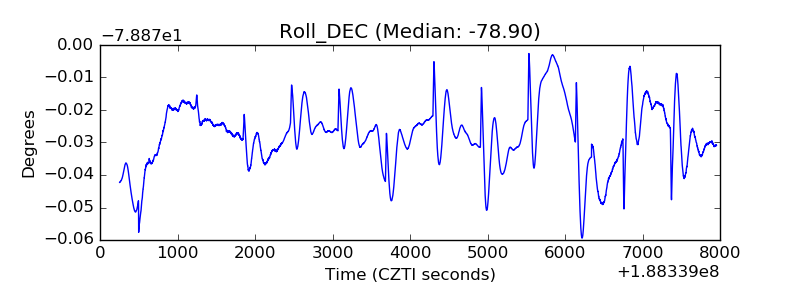 |
| _Roll_RA | 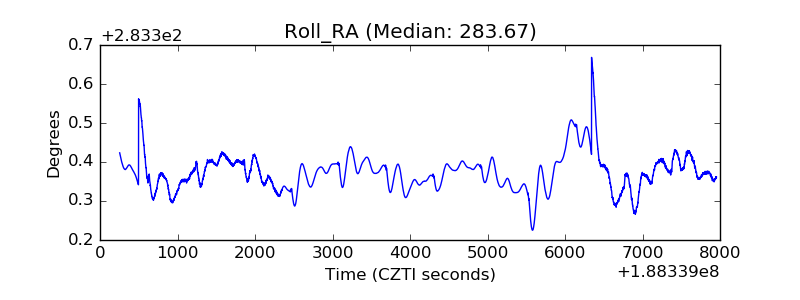 |
| Veto Counter | 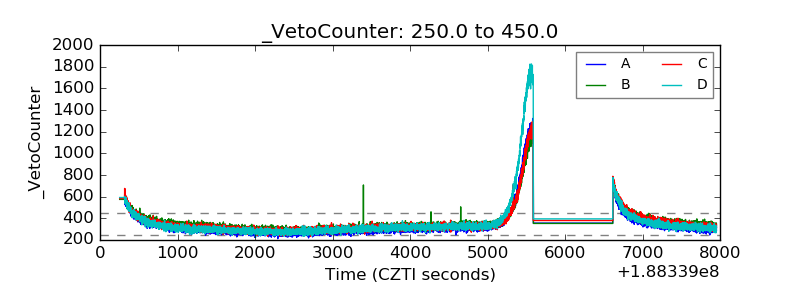 |