| Param | Original file | Final file |
|---|---|---|
| Filename | modeM0/AS1G04_011T02_9000000226_01241cztM0_level2.evt | modeM0/AS1G04_011T02_9000000226_01241cztM0_level2_quad_clean.evt |
| Size (bytes) | 1,441,540,800 | 93,188,160 |
| Size | 1.3 GB | 88.9 MB |
| Events in quadrant A | 8,683,442 | 690,592 |
| Events in quadrant B | 16,331,388 | 454,217 |
| Events in quadrant C | 8,293,838 | 668,810 |
| Events in quadrant D | 9,923,253 | 555,400 |
| Mode SS | |||
|---|---|---|---|
| Quadrant | BADHDUFLAG | Total packets | Discarded packets |
| A | 0 | 126 | 0 |
| B | 0 | 126 | 0 |
| C | 0 | 126 | 0 |
| D | 0 | 126 | 0 |
| Mode M9 | |||
|---|---|---|---|
| Quadrant | BADHDUFLAG | Total packets | Discarded packets |
| A | 0 | 1 | 0 |
| B | 1 | 1 | 0 |
| C | 1 | -1 | -1 |
| D | 1 | -1 | -1 |
| Mode M0 | |||
|---|---|---|---|
| Quadrant | BADHDUFLAG | Total packets | Discarded packets |
| A | 0 | 30413 | 0 |
| B | 0 | 53629 | 0 |
| C | 0 | 29204 | 0 |
| D | 0 | 34230 | 20 |
| Quadrant | Total seconds | Saturated seconds | Saturation percentage |
|---|---|---|---|
| A | 6476 | 51 | 0.787523% |
| B | 6476 | 3441 | 53.134651% |
| C | 6476 | 130 | 2.007412% |
| D | 6474 | 861 | 13.299351% |
Noise dominated data is calculated using 1-second bins in cleaned event files. If a bin has >2000 counts, and if more than 50% of those come from <1% of pixels, then it is considered to be noise-dominated and hence unusable.
| Quadrant | # 1 sec bins | Bins with >0 counts | Bins with >2000 counts | High rate bins dominated by noise | Noise dominated (total time) | Noise dominated (detector-on time) | Marked lightcurve |
|---|---|---|---|---|---|---|---|
| A | 7582 | 6476 | 459 | 459 | 6.05% | 7.09% | 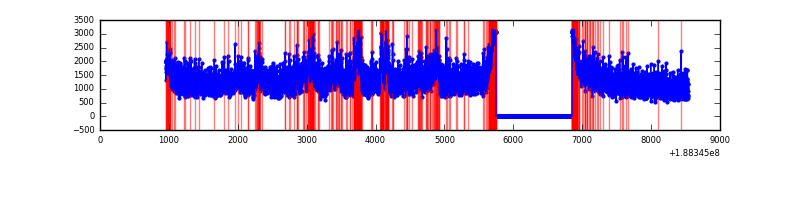 |
| B | 7582 | 6476 | 4665 | 4665 | 61.53% | 72.04% |  |
| C | 7582 | 6476 | 371 | 371 | 4.89% | 5.73% | 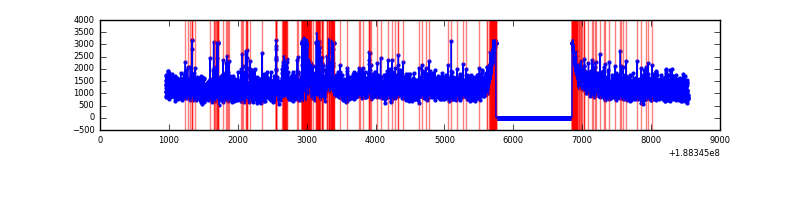 |
| D | 7582 | 6475 | 1140 | 1140 | 15.04% | 17.61% | 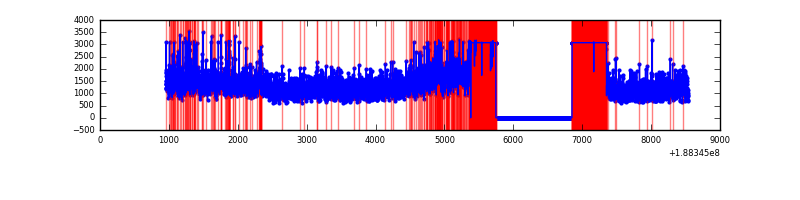 |
Top three noisy pixels from each quadrant. If the there are fewer than three noisy pixels in the level2.evt file, extra rows are filled as -1
| Pixel properties | Quadrant properties | ||||||
|---|---|---|---|---|---|---|---|
| Quadrant | DetID | PixID | Counts | Sigma | Mean | Median | Sigma |
| A | 3 | 80 | 1031689 | 2188.8 | 1988 | 2003 | 470.4 |
| A | 13 | 9 | 9512 | 15.96 | 1988 | 2003 | 470.4 |
| A | 11 | 79 | 8812 | 14.47 | 1988 | 2003 | 470.4 |
| B | 2 | 32 | 10282677 | 29895.66 | 1477 | 1482 | 343.9 |
| B | 8 | 4 | 231973 | 670.22 | 1477 | 1482 | 343.9 |
| B | 5 | 191 | 128435 | 369.15 | 1477 | 1482 | 343.9 |
| C | 9 | 52 | 506157 | 964.36 | 1901 | 1973 | 522.8 |
| C | 15 | 241 | 330855 | 629.06 | 1901 | 1973 | 522.8 |
| C | 3 | 111 | 22412 | 39.09 | 1901 | 1973 | 522.8 |
| D | 1 | 239 | 3188655 | 6483.93 | 1606 | 1663 | 491.5 |
| D | 12 | 22 | 519571 | 1053.68 | 1606 | 1663 | 491.5 |
| D | 12 | 79 | 135156 | 271.59 | 1606 | 1663 | 491.5 |
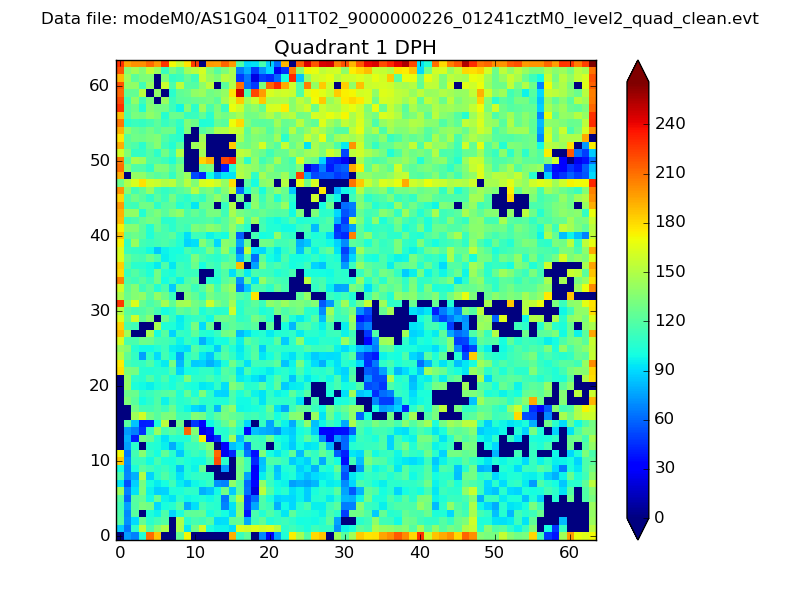
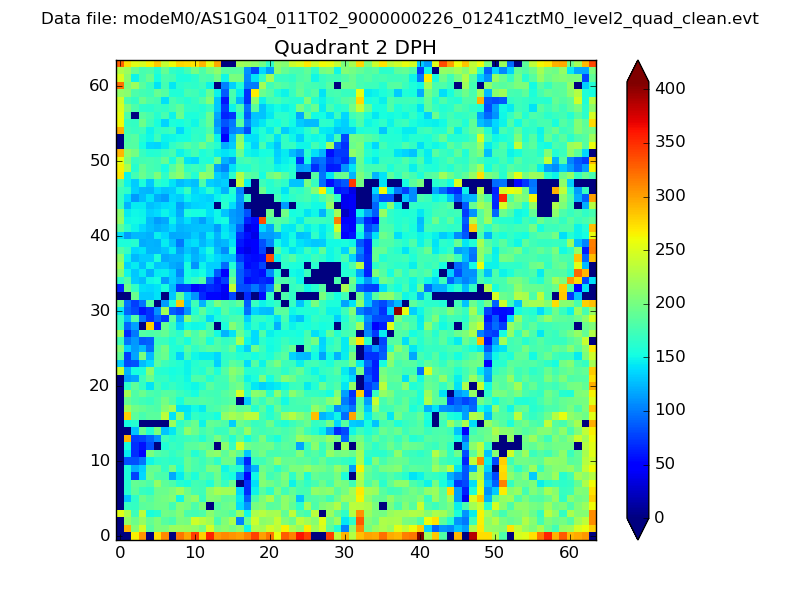
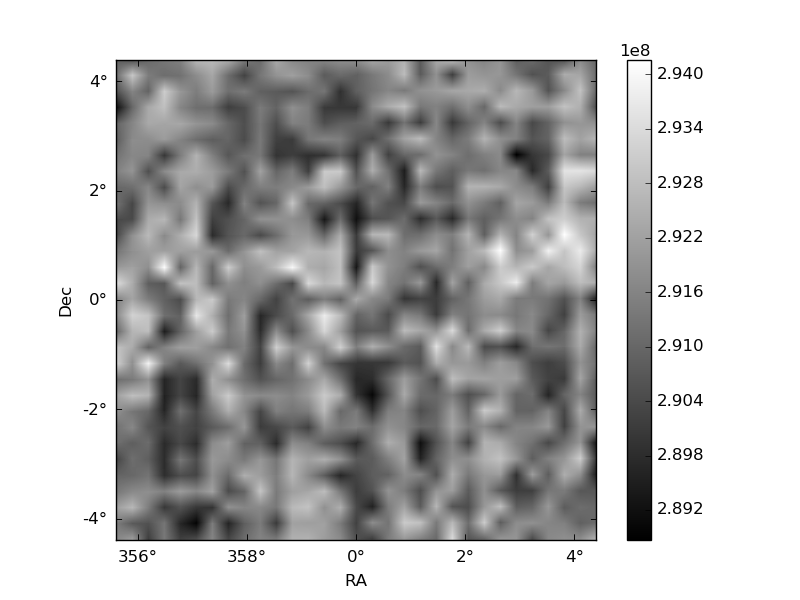
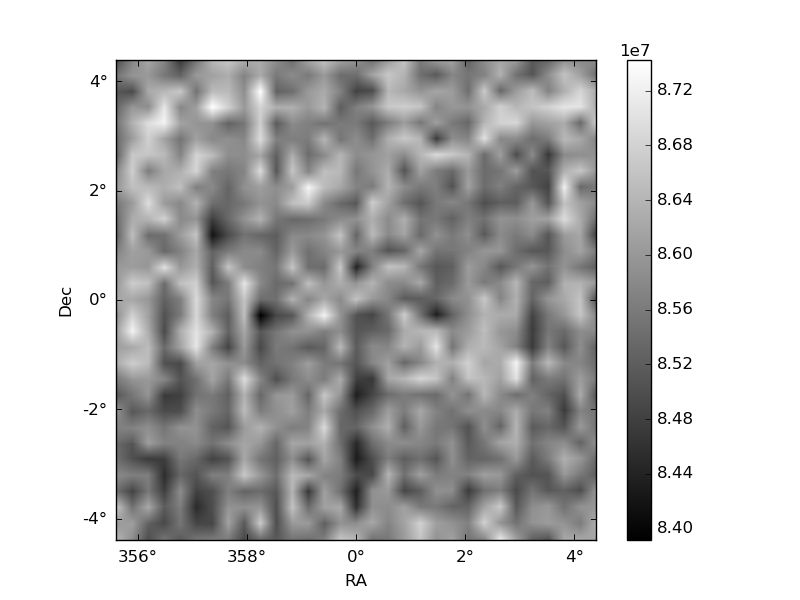
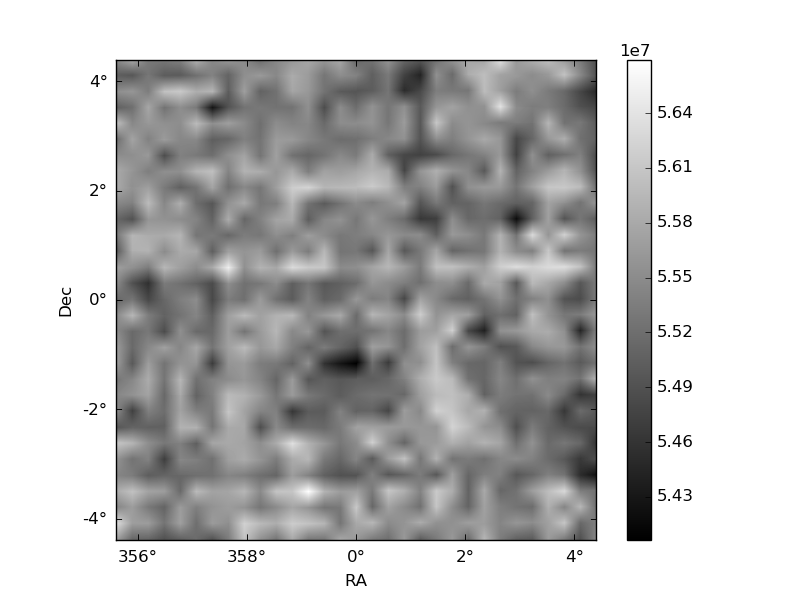
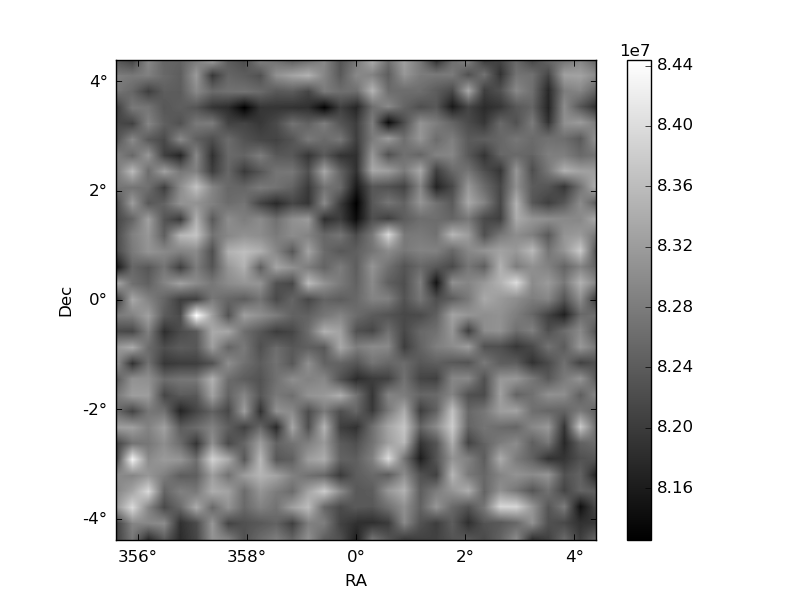
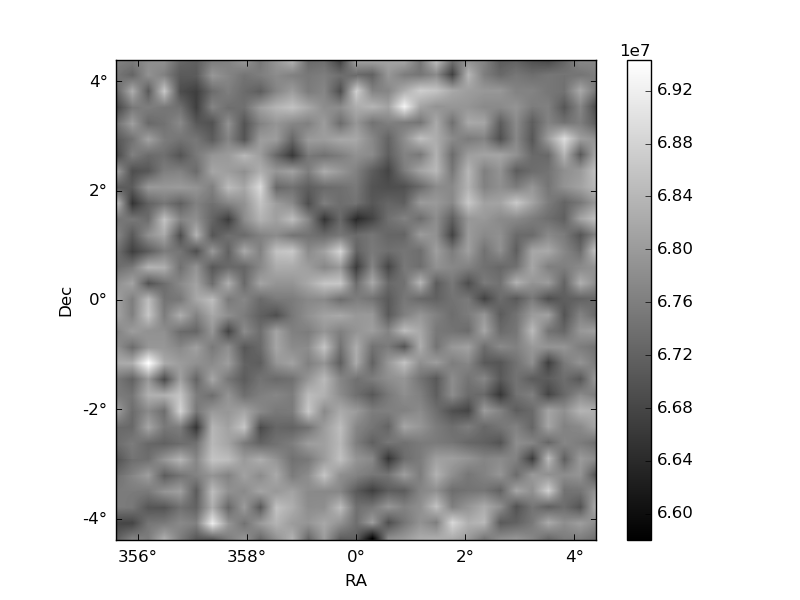
Histogram calculated using DETX and DETY for each event in the final _common_clean file
| Quadrant A | 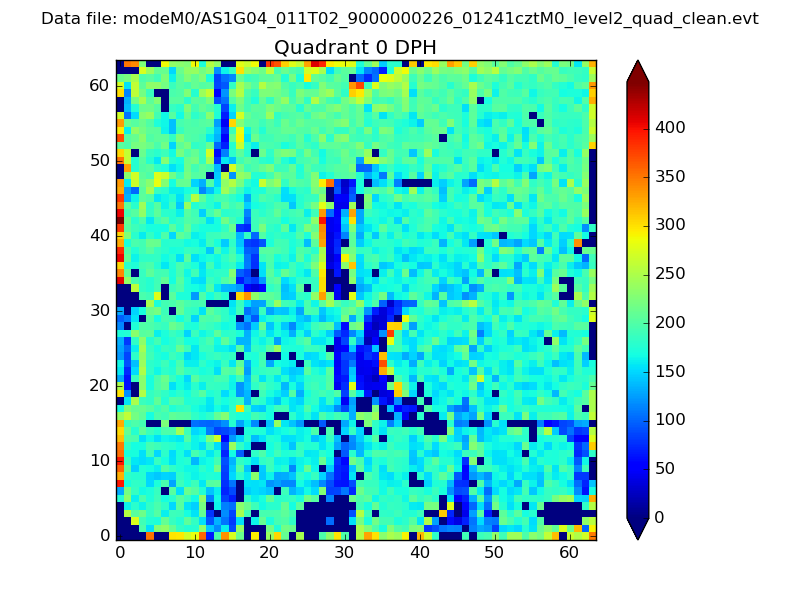 |
 |
Quadrant B |
|---|---|---|---|
| Quadrant D | 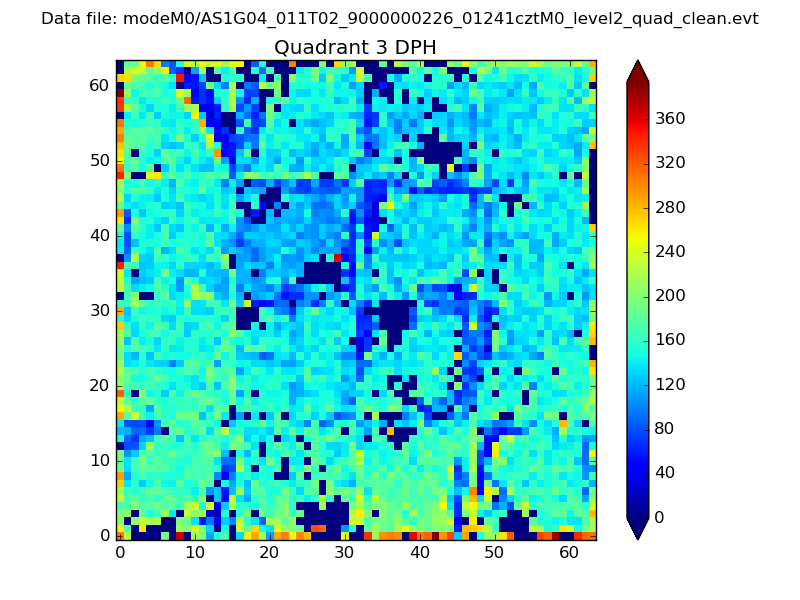 |
 |
Quadrant C |
| Plot type | Count rate plots | Images |
|---|---|---|
| Comparison with Poisson distribution Blue bars denote a histogram of data divided into 1 sec bins. Red curve is a Poisson curve with rate = median count rate of data. |
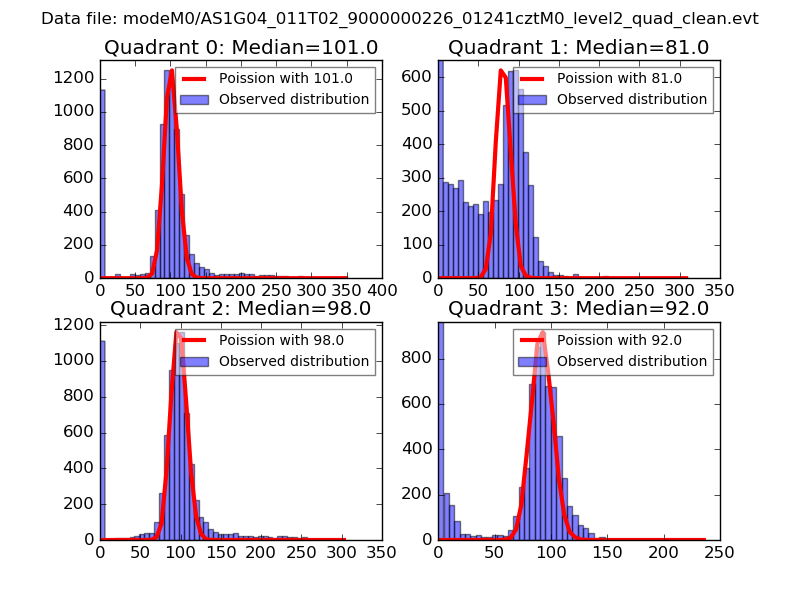 |
 |
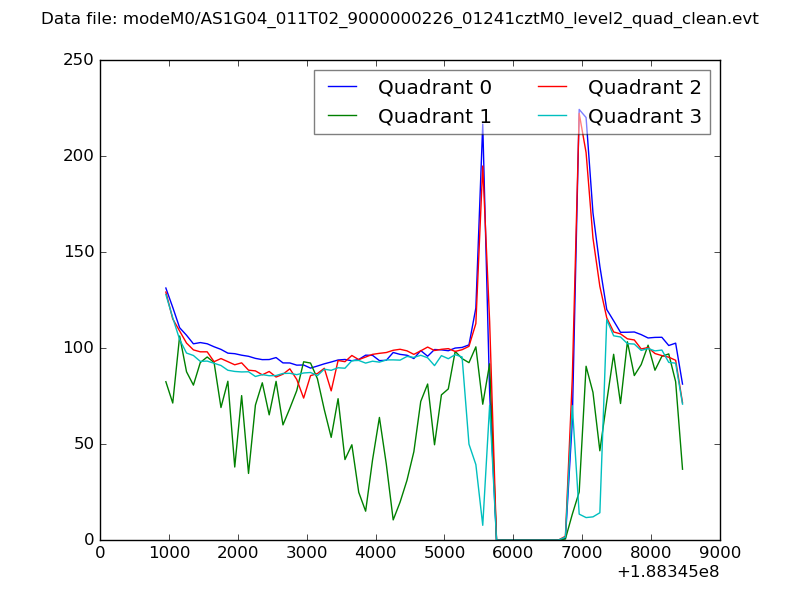
| Quadrant-wise count rates Data is divided into 100 sec bins |
 |
|
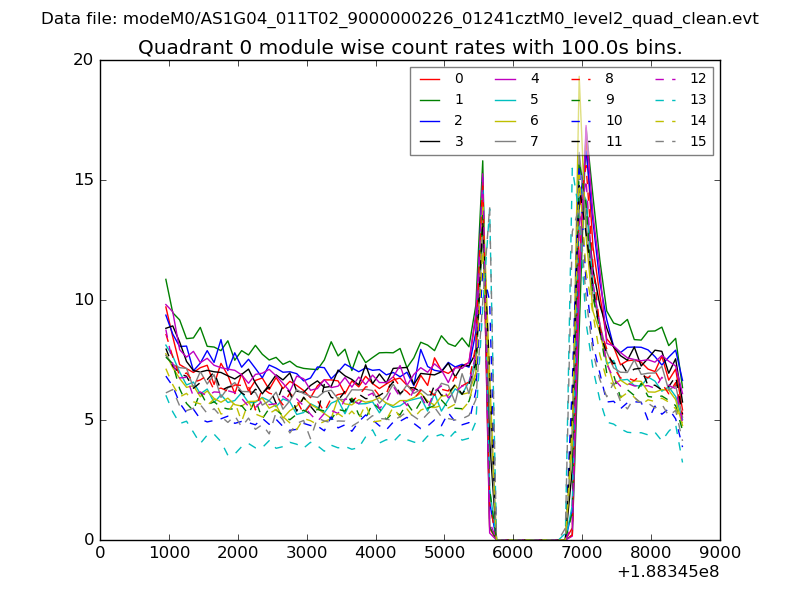
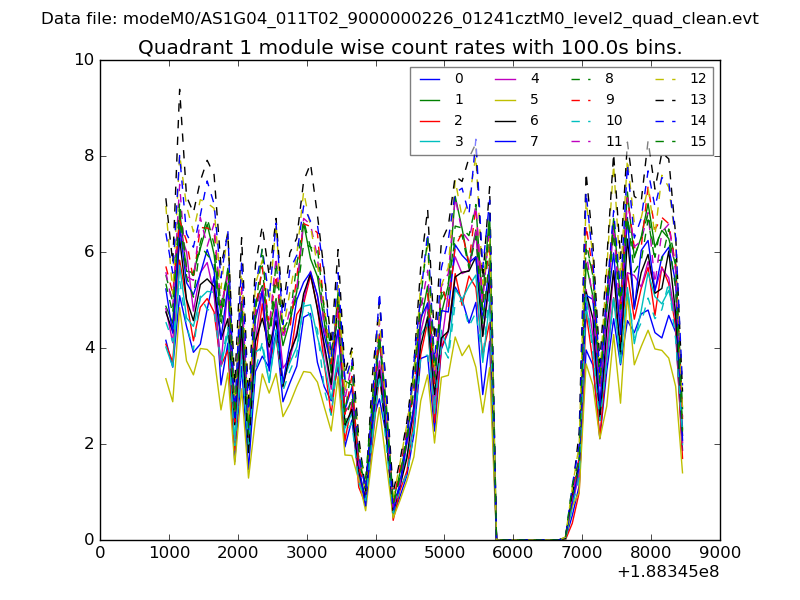
| Module-wise count rates for Quadrant A Data is divided into 100 sec bins |
 |
 |
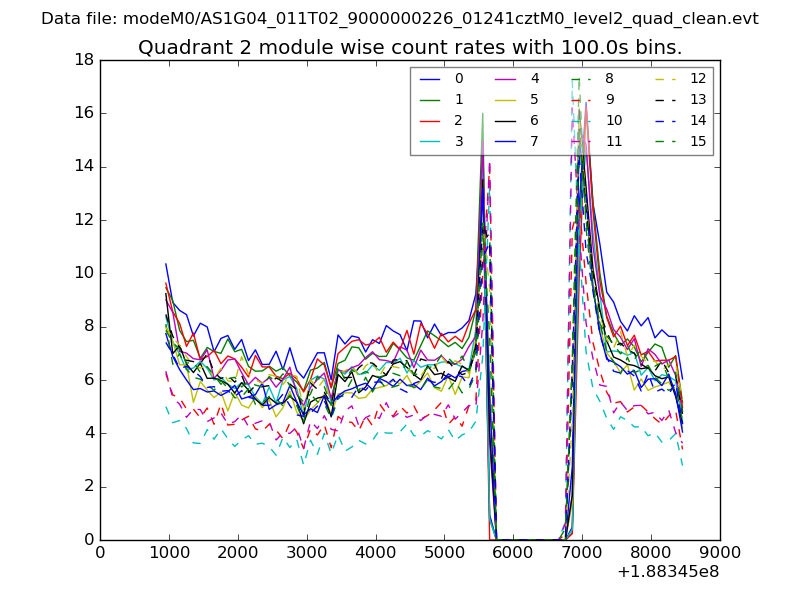
| Module-wise count rates for Quadrant B Data is divided into 100 sec bins |
 |
 |
| Module-wise count rates for Quadrant C Data is divided into 100 sec bins |
 |
 |
| Module-wise count rates for Quadrant D Data is divided into 100 sec bins |
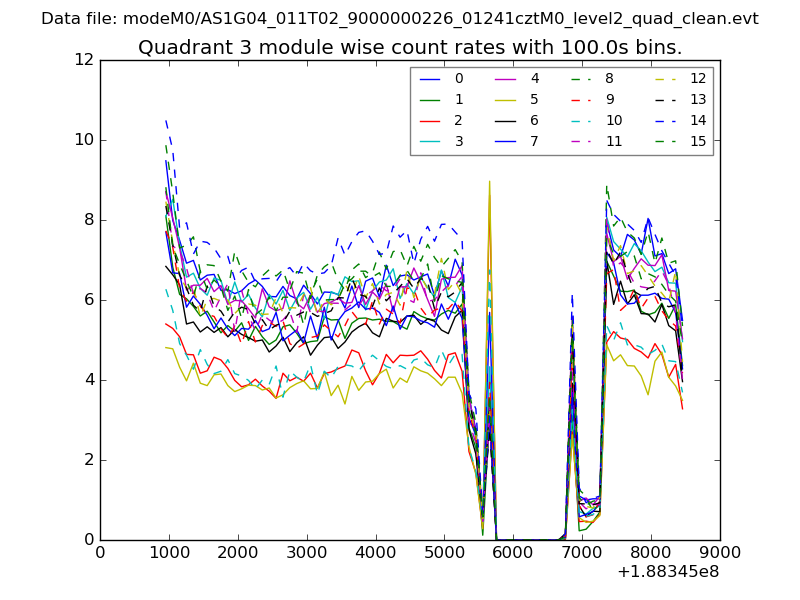 |
 |
| Parameter | Plot |
|---|---|
| CZT HV Monitor | 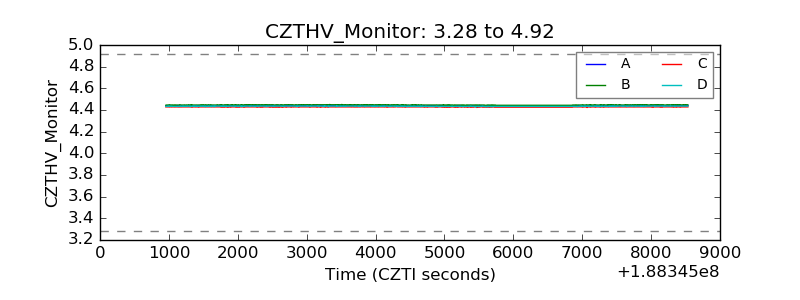 |
| D_VDD | 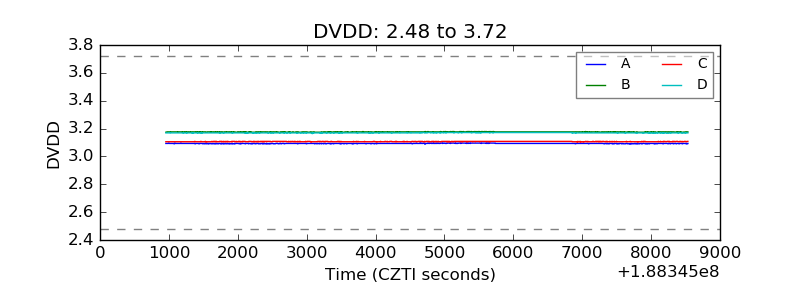 |
| Temperature 1 | 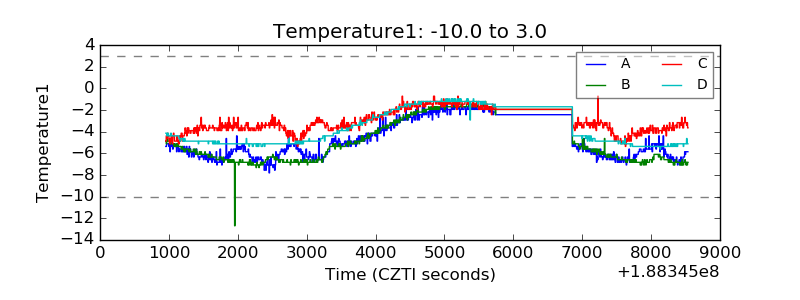 |
| Veto HV Monitor | 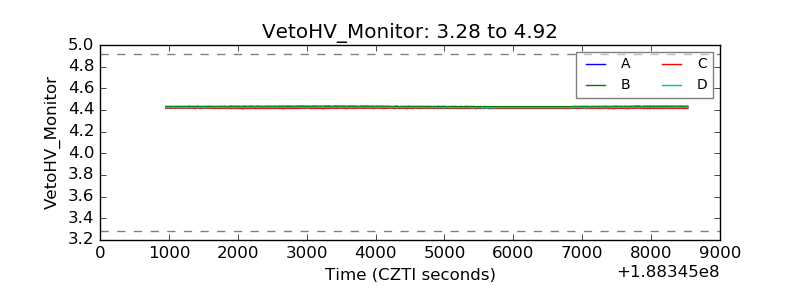 |
| Veto LLD | 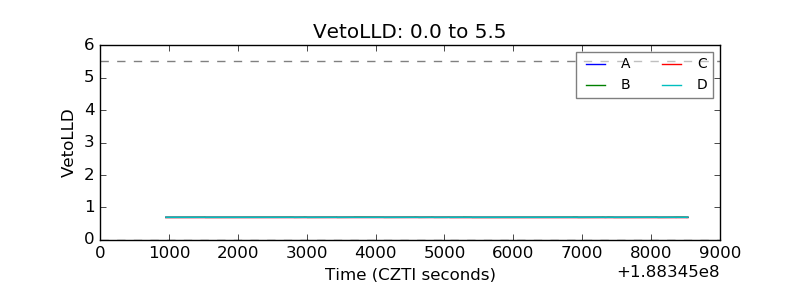 |
| Alpha Counter | 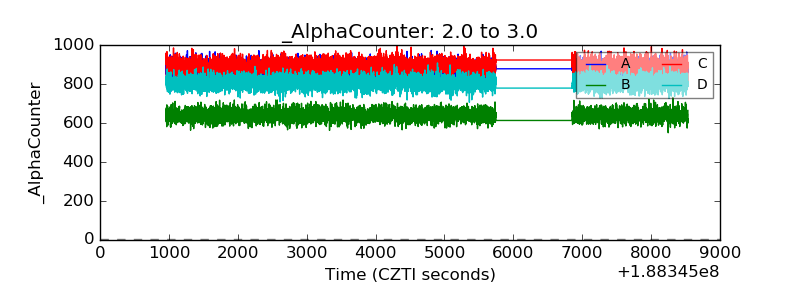 |
| _CPM_Rate | 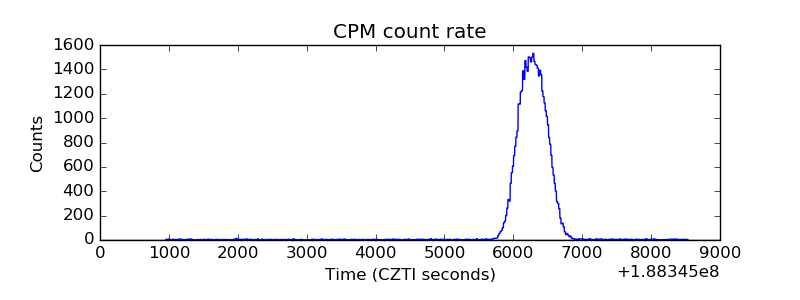 |
| CZT Counter | 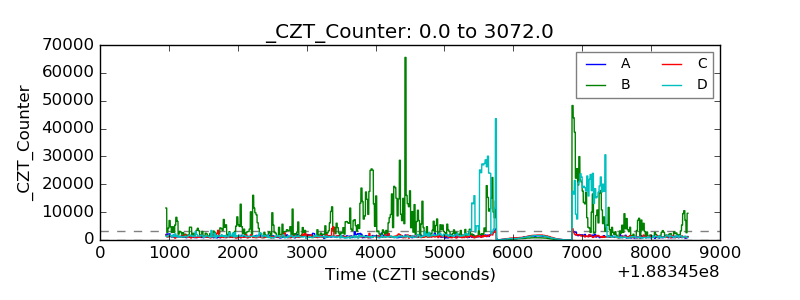 |
| +2.5 Volts monitor |  |
| +5 Volts monitor | 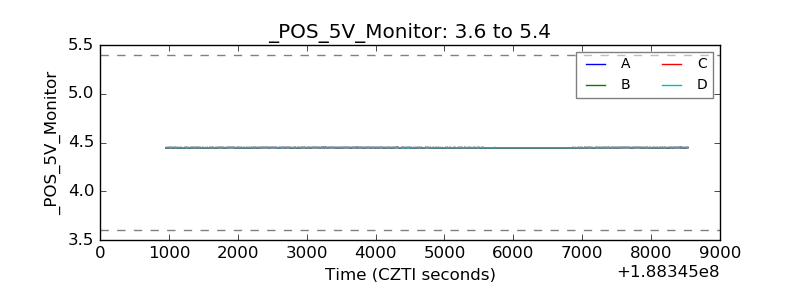 |
| _ROLL_ROT | 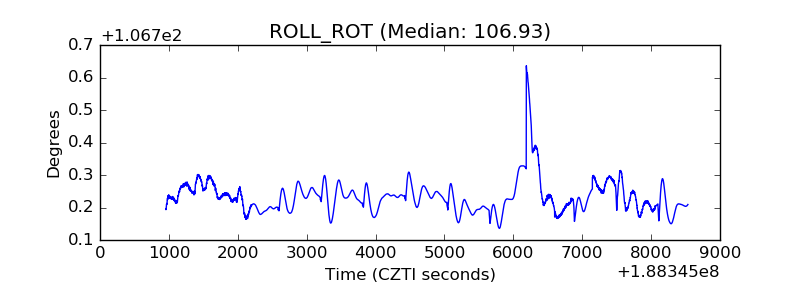 |
| _Roll_DEC | 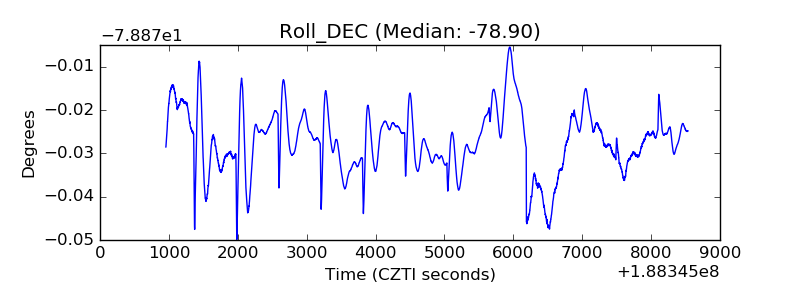 |
| _Roll_RA | 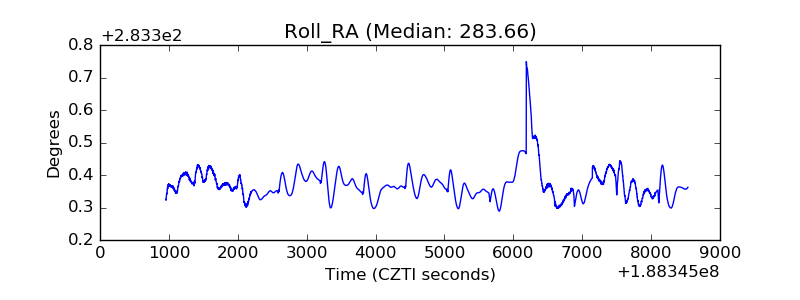 |
| Veto Counter | 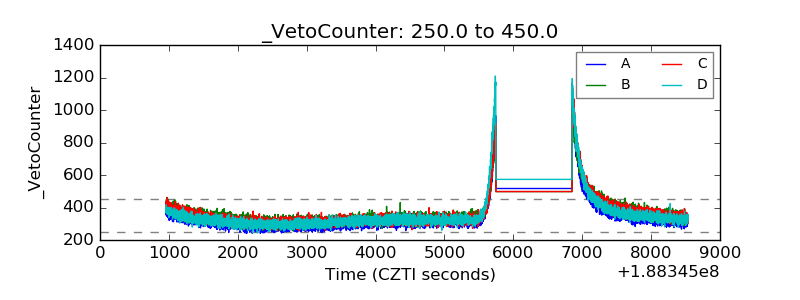 |