| Param | Original file | Final file |
|---|---|---|
| Filename | modeM0/AS1G04_011T02_9000000226_01246cztM0_level2.evt | modeM0/AS1G04_011T02_9000000226_01246cztM0_level2_quad_clean.evt |
| Size (bytes) | 944,712,000 | 67,844,160 |
| Size | 900.9 MB | 64.7 MB |
| Events in quadrant A | 5,497,742 | 465,091 |
| Events in quadrant B | 9,893,206 | 372,032 |
| Events in quadrant C | 5,515,384 | 461,751 |
| Events in quadrant D | 7,401,587 | 432,755 |
| Mode SS | |||
|---|---|---|---|
| Quadrant | BADHDUFLAG | Total packets | Discarded packets |
| A | 0 | 108 | 16 |
| B | 0 | 109 | 13 |
| C | 0 | 113 | 21 |
| D | 0 | 111 | 15 |
| Mode M9 | |||
|---|---|---|---|
| Quadrant | BADHDUFLAG | Total packets | Discarded packets |
| A | 0 | 14 | 8 |
| B | 0 | 12 | 7 |
| C | 0 | 10 | 5 |
| D | 0 | 10 | 5 |
| Mode M0 | |||
|---|---|---|---|
| Quadrant | BADHDUFLAG | Total packets | Discarded packets |
| A | 0 | 22999 | 3442 |
| B | 0 | 38362 | 5514 |
| C | 0 | 23460 | 3898 |
| D | 0 | 28825 | 3570 |
| Quadrant | Total seconds | Saturated seconds | Saturation percentage |
|---|---|---|---|
| A | 4575 | 17 | 0.371585% |
| B | 4556 | 1572 | 34.503951% |
| C | 4567 | 25 | 0.547405% |
| D | 4579 | 395 | 8.626338% |
Noise dominated data is calculated using 1-second bins in cleaned event files. If a bin has >2000 counts, and if more than 50% of those come from <1% of pixels, then it is considered to be noise-dominated and hence unusable.
| Quadrant | # 1 sec bins | Bins with >0 counts | Bins with >2000 counts | High rate bins dominated by noise | Noise dominated (total time) | Noise dominated (detector-on time) | Marked lightcurve |
|---|---|---|---|---|---|---|---|
| A | 5812 | 4631 | 167 | 167 | 2.87% | 3.61% | 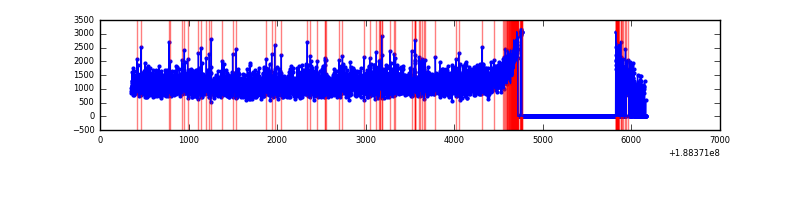 |
| B | 5805 | 4600 | 2367 | 2367 | 40.78% | 51.46% | 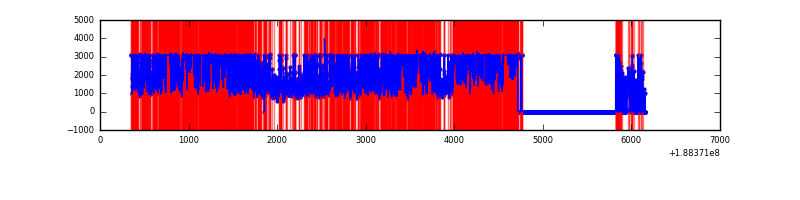 |
| C | 5798 | 4627 | 162 | 162 | 2.79% | 3.50% | 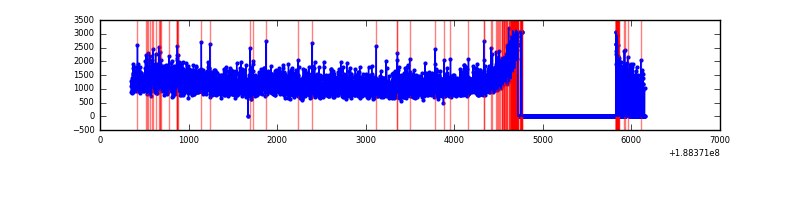 |
| D | 6279 | 4632 | 1124 | 1124 | 17.90% | 24.27% | 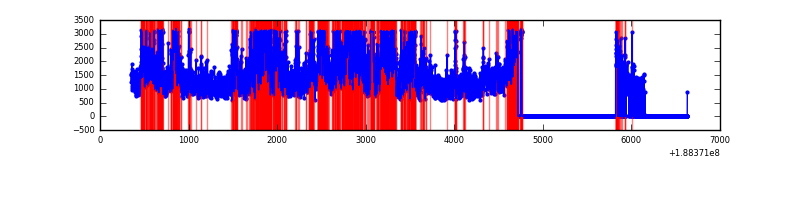 |
Top three noisy pixels from each quadrant. If the there are fewer than three noisy pixels in the level2.evt file, extra rows are filled as -1
| Pixel properties | Quadrant properties | ||||||
|---|---|---|---|---|---|---|---|
| Quadrant | DetID | PixID | Counts | Sigma | Mean | Median | Sigma |
| A | 3 | 80 | 21968 | 60.75 | 1420 | 1428 | 338.1 |
| A | 8 | 14 | 12700 | 33.34 | 1420 | 1428 | 338.1 |
| A | 12 | 243 | 9571 | 24.09 | 1420 | 1428 | 338.1 |
| B | 2 | 32 | 4642999 | 16242.43 | 1224 | 1231 | 285.8 |
| B | 8 | 4 | 282223 | 983.24 | 1224 | 1231 | 285.8 |
| B | 5 | 191 | 225483 | 784.7 | 1224 | 1231 | 285.8 |
| C | 15 | 241 | 237897 | 648.89 | 1314 | 1359 | 364.5 |
| C | 9 | 52 | 75340 | 202.95 | 1314 | 1359 | 364.5 |
| C | 3 | 79 | 23904 | 61.85 | 1314 | 1359 | 364.5 |
| D | 10 | 84 | 2371379 | 6012.89 | 1273 | 1318 | 394.2 |
| D | 1 | 239 | 197379 | 497.41 | 1273 | 1318 | 394.2 |
| D | 13 | 252 | 37567 | 91.96 | 1273 | 1318 | 394.2 |
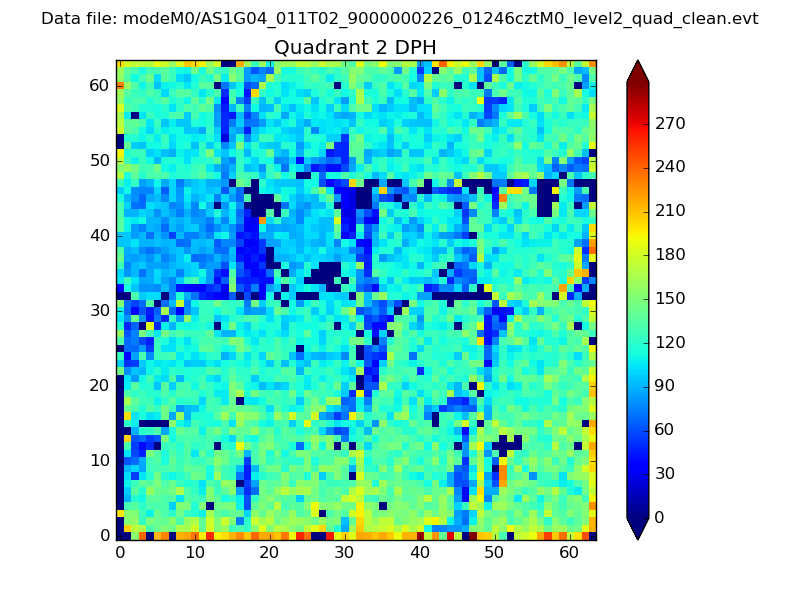
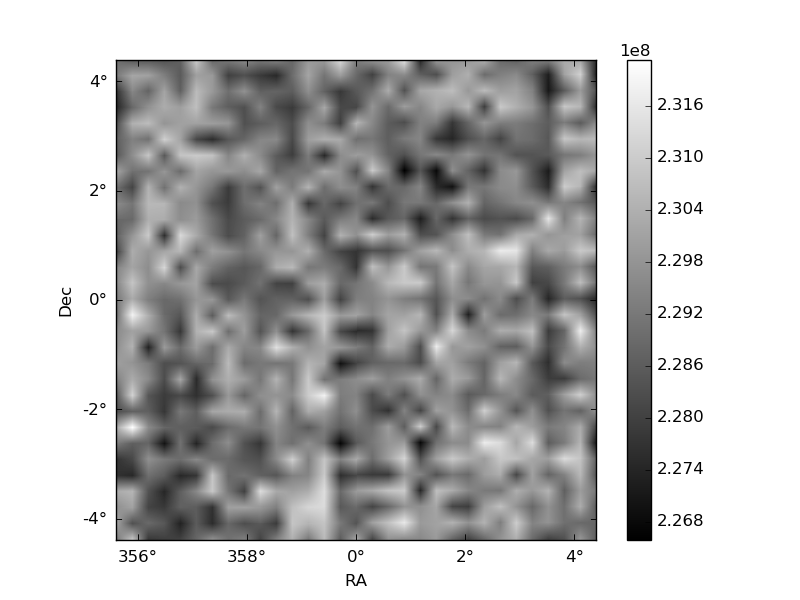
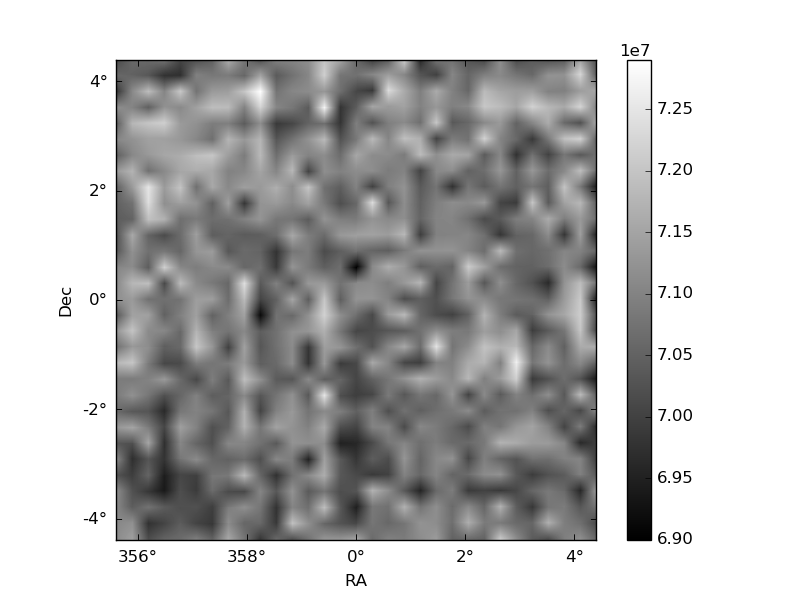
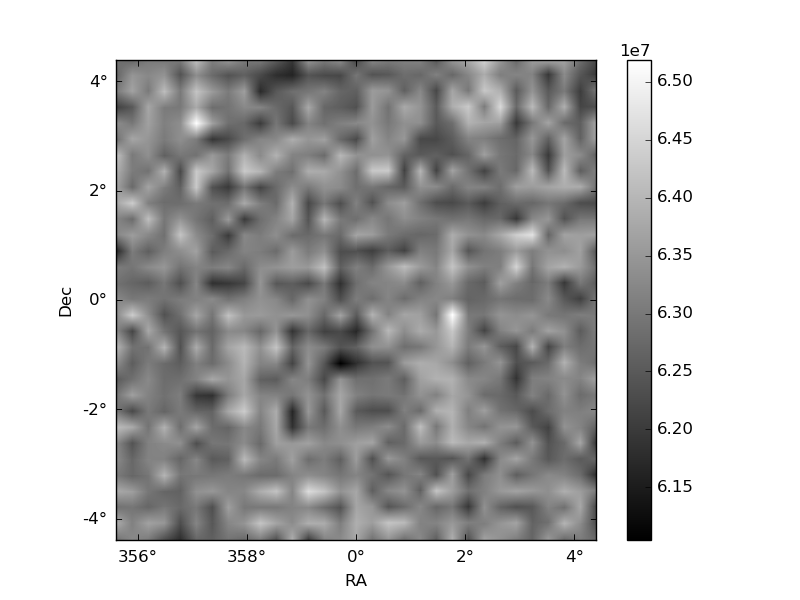
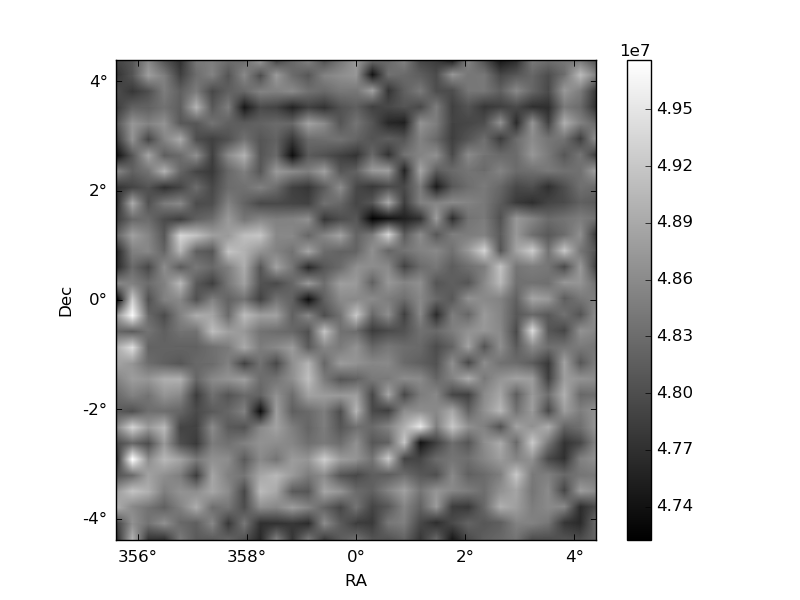
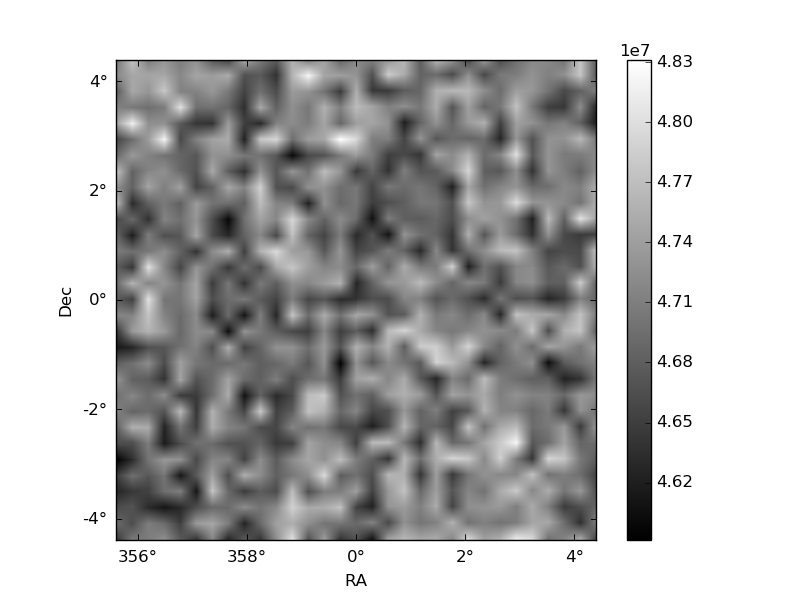
Histogram calculated using DETX and DETY for each event in the final _common_clean file
| Quadrant A | 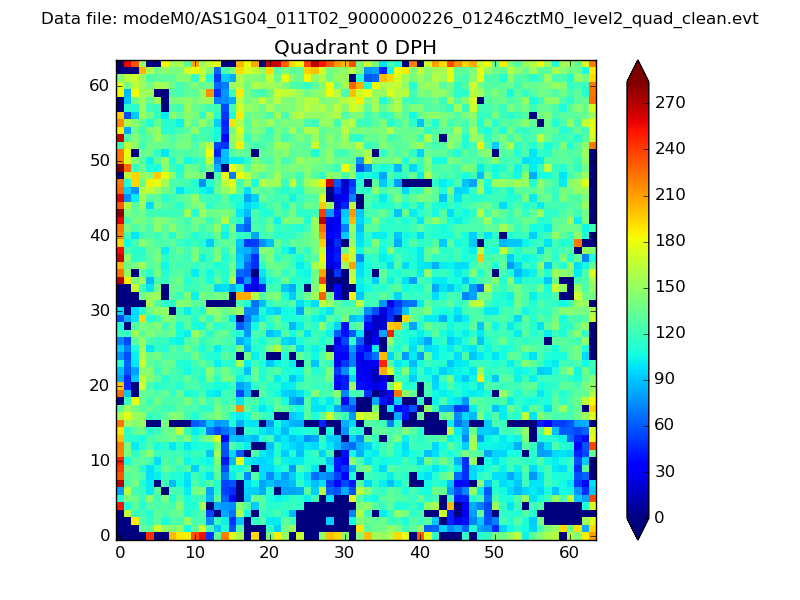 |
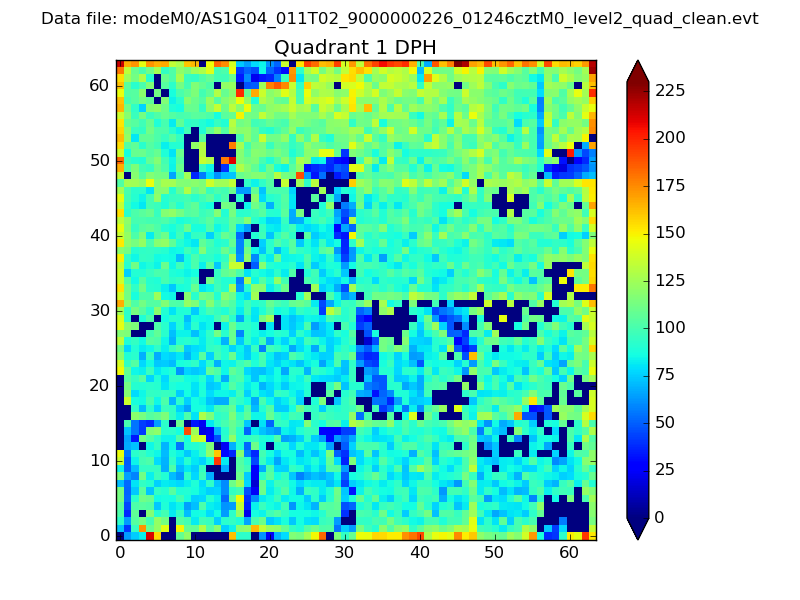 |
Quadrant B |
|---|---|---|---|
| Quadrant D | 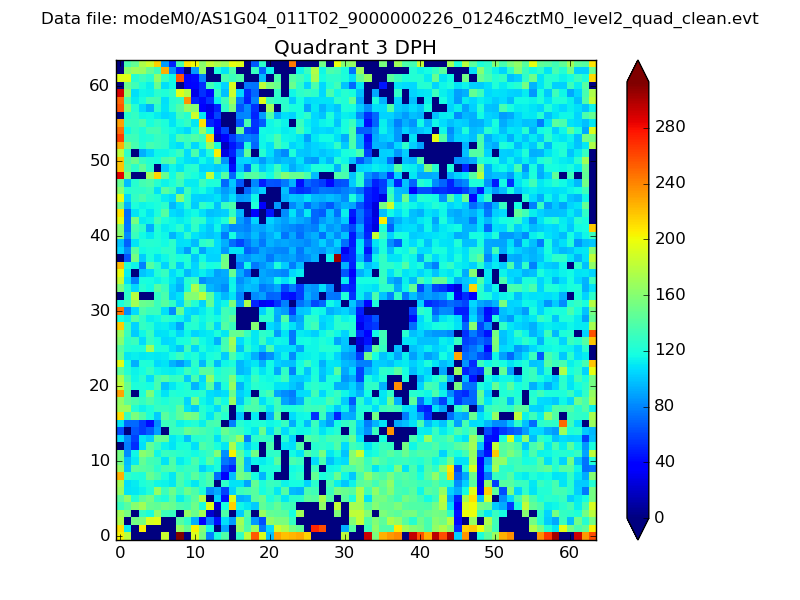 |
 |
Quadrant C |
| Plot type | Count rate plots | Images |
|---|---|---|
| Comparison with Poisson distribution Blue bars denote a histogram of data divided into 1 sec bins. Red curve is a Poisson curve with rate = median count rate of data. |
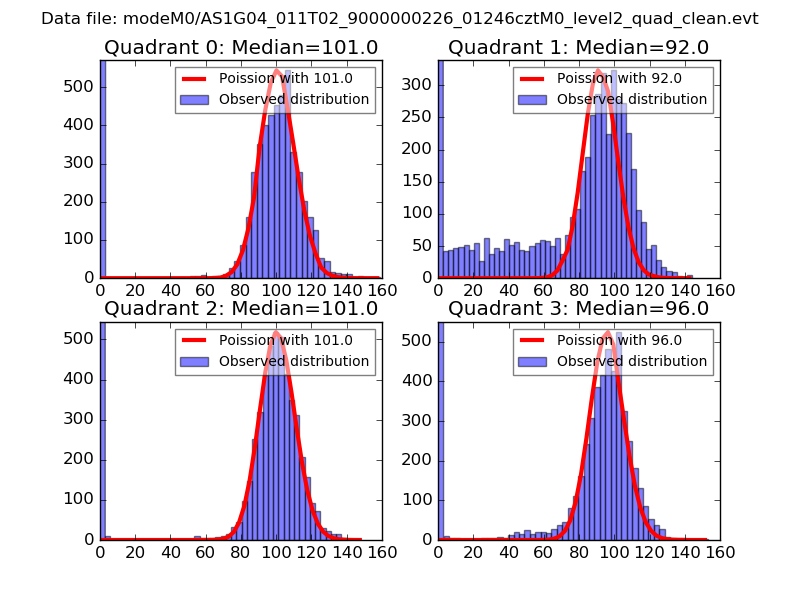 |
 |
| Quadrant-wise count rates Data is divided into 100 sec bins |
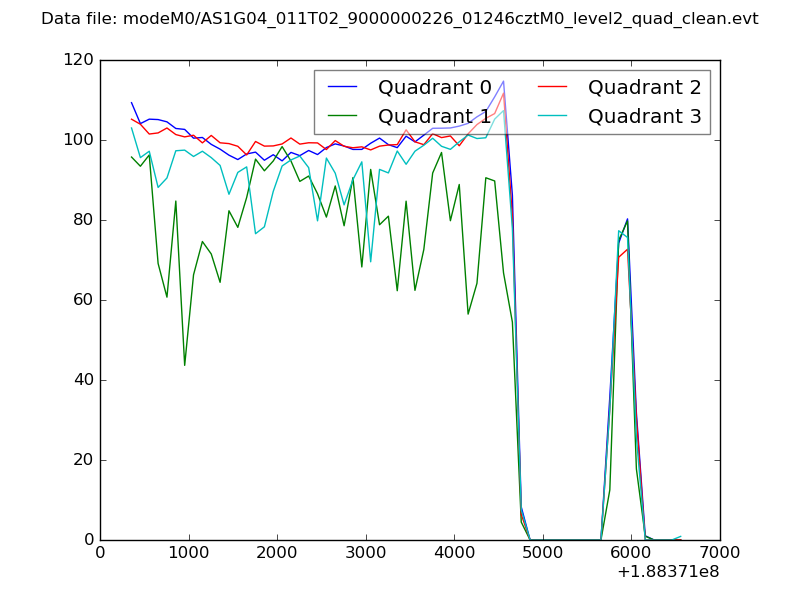 |
|
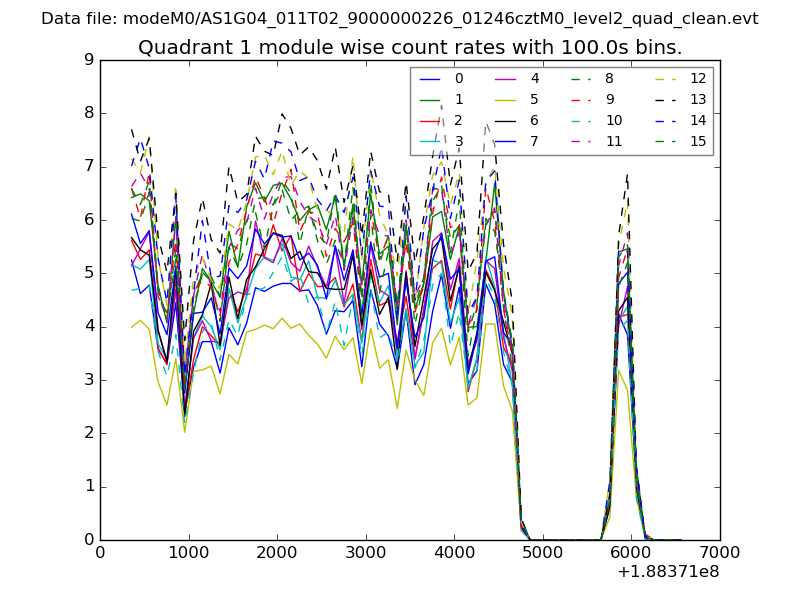
| Module-wise count rates for Quadrant A Data is divided into 100 sec bins |
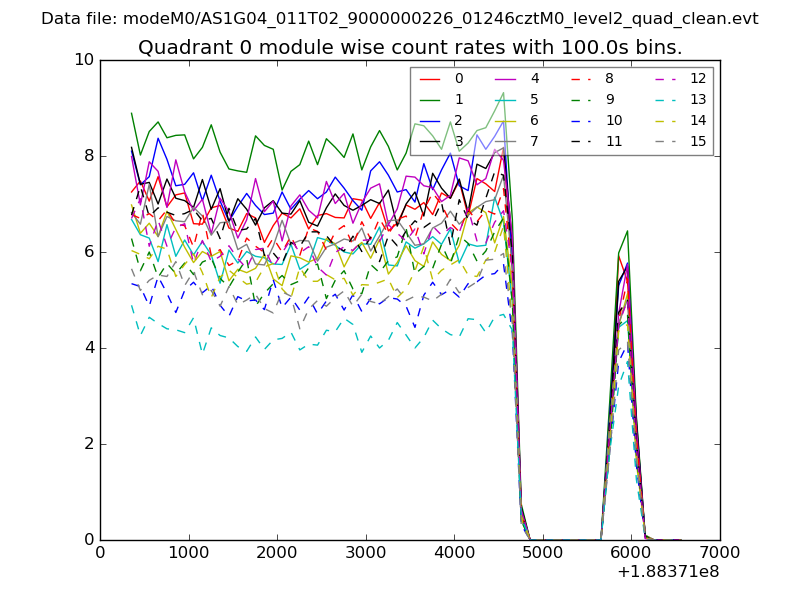 |
 |
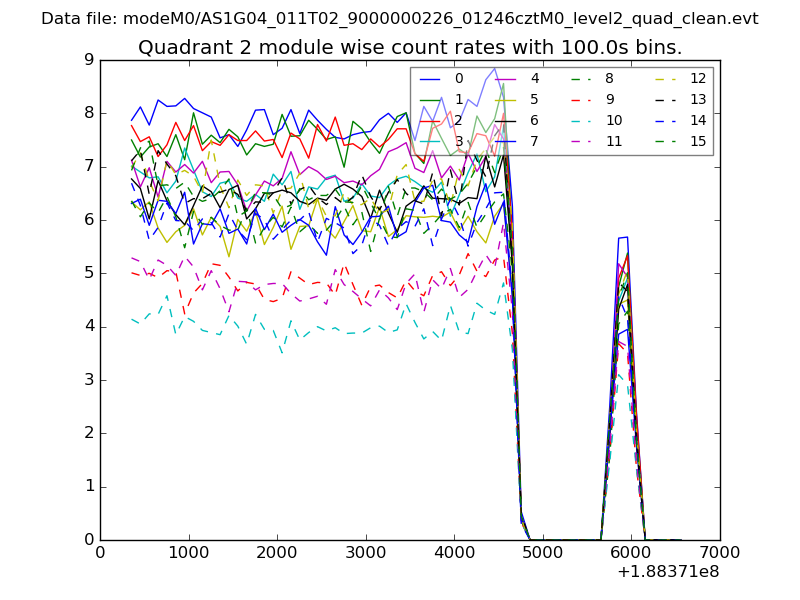
| Module-wise count rates for Quadrant B Data is divided into 100 sec bins |
 |
 |
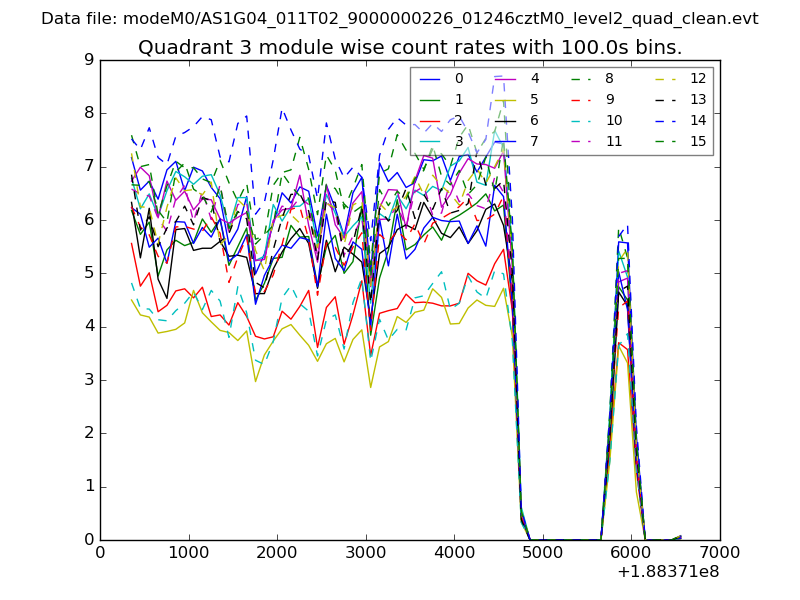
| Module-wise count rates for Quadrant C Data is divided into 100 sec bins |
 |
 |
| Module-wise count rates for Quadrant D Data is divided into 100 sec bins |
 |
 |
| Parameter | Plot |
|---|---|
| CZT HV Monitor | 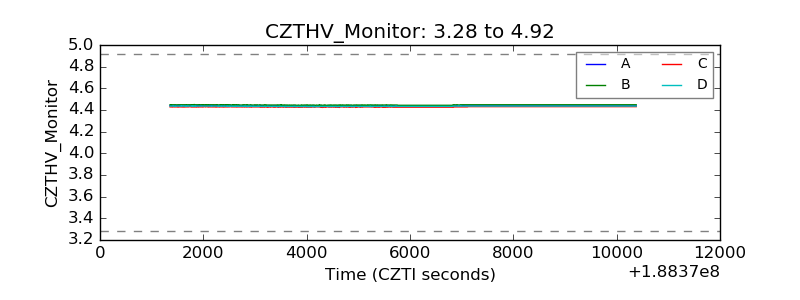 |
| D_VDD | 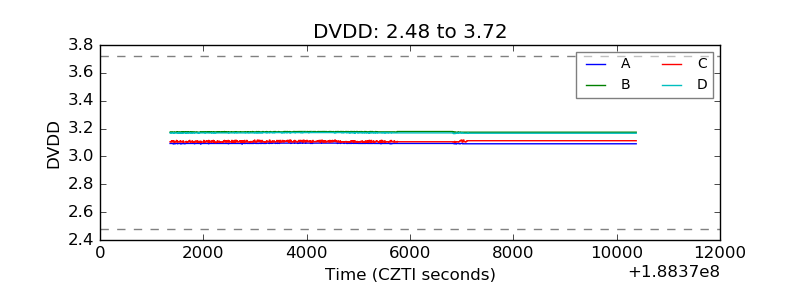 |
| Temperature 1 | 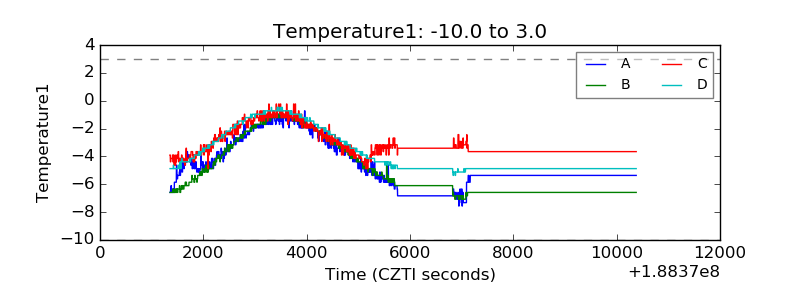 |
| Veto HV Monitor | 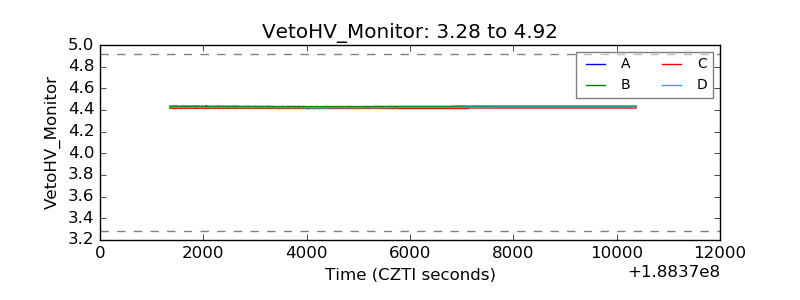 |
| Veto LLD | 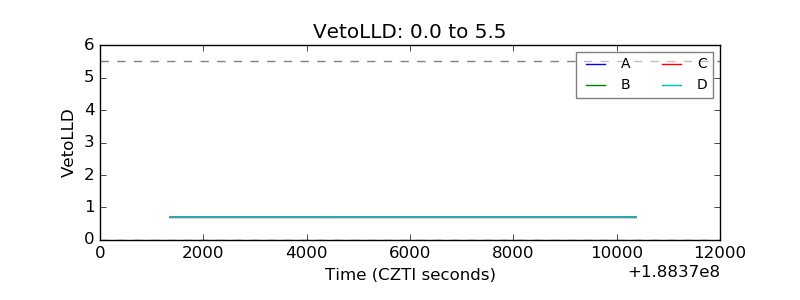 |
| Alpha Counter | 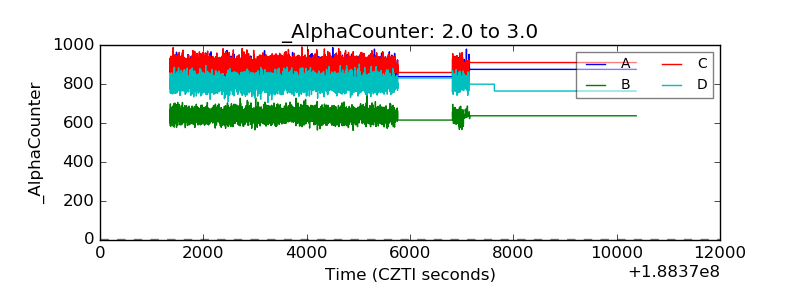 |
| _CPM_Rate | 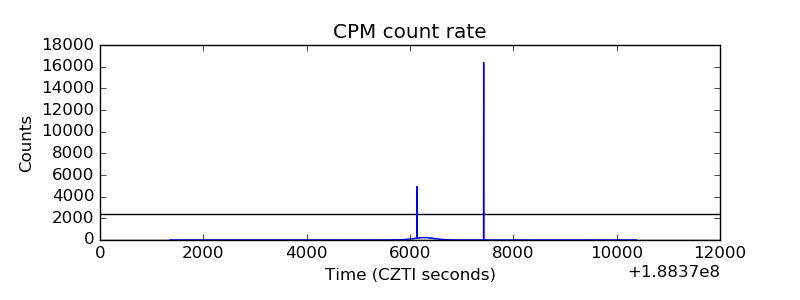 |
| CZT Counter | 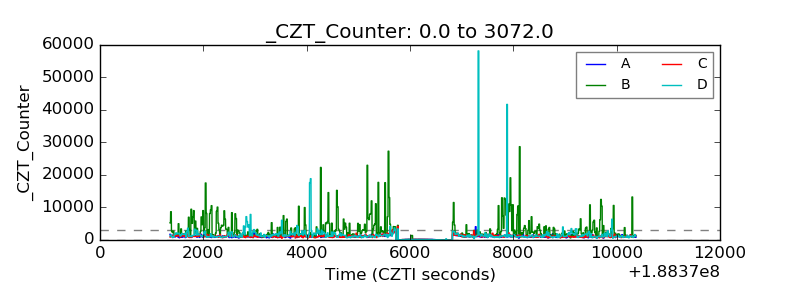 |
| +2.5 Volts monitor |  |
| +5 Volts monitor |  |
| _ROLL_ROT | 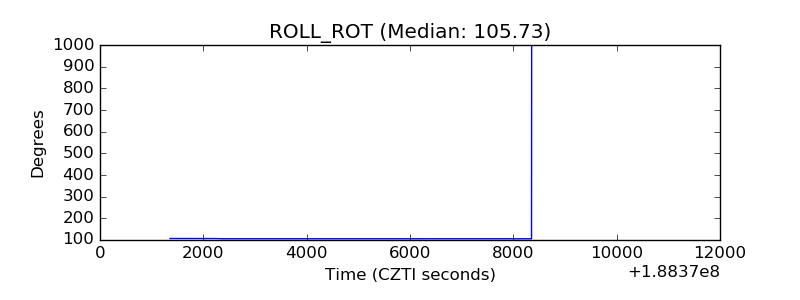 |
| _Roll_DEC | 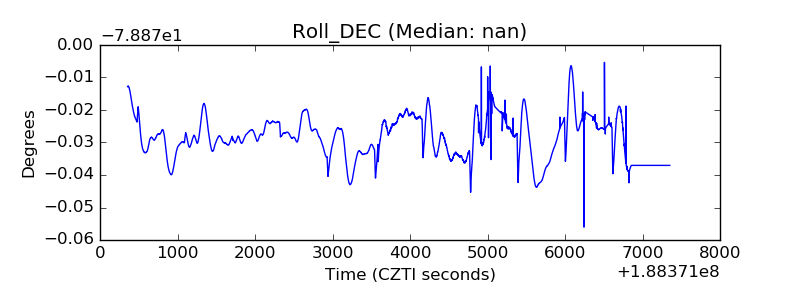 |
| _Roll_RA | 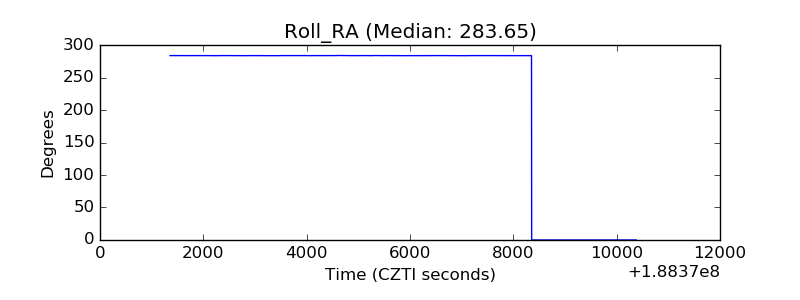 |
| Veto Counter | 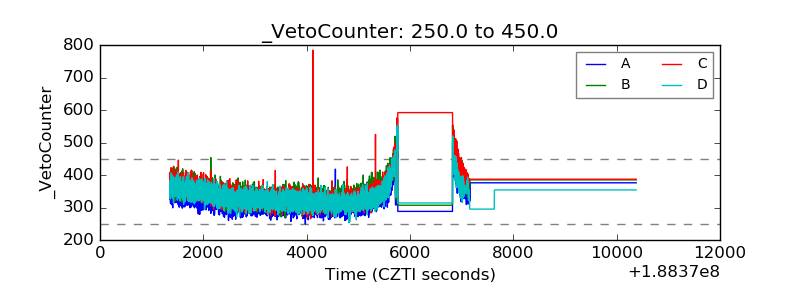 |