| Param | Original file | Final file |
|---|---|---|
| Filename | modeM0/AS1G04_011T02_9000000226_01247cztM0_level2.evt | modeM0/AS1G04_011T02_9000000226_01247cztM0_level2_quad_clean.evt |
| Size (bytes) | 1,209,859,200 | 99,783,360 |
| Size | 1.1 GB | 95.2 MB |
| Events in quadrant A | 8,088,940 | 664,801 |
| Events in quadrant B | 11,920,194 | 599,489 |
| Events in quadrant C | 8,000,745 | 658,035 |
| Events in quadrant D | 8,200,826 | 644,789 |
| Mode SS | |||
|---|---|---|---|
| Quadrant | BADHDUFLAG | Total packets | Discarded packets |
| A | 0 | 132 | 0 |
| B | 0 | 132 | 0 |
| C | 0 | 132 | 0 |
| D | 0 | 132 | 0 |
| Mode M9 | |||
|---|---|---|---|
| Quadrant | BADHDUFLAG | Total packets | Discarded packets |
| A | 0 | 7 | 0 |
| B | 0 | 7 | 0 |
| C | 0 | 7 | 0 |
| D | 0 | 7 | 0 |
| Mode M0 | |||
|---|---|---|---|
| Quadrant | BADHDUFLAG | Total packets | Discarded packets |
| A | 0 | 28641 | 2 |
| B | 0 | 40126 | 1 |
| C | 0 | 28408 | 1 |
| D | 0 | 29014 | 1 |
| Quadrant | Total seconds | Saturated seconds | Saturation percentage |
|---|---|---|---|
| A | 6514 | 31 | 0.475898% |
| B | 6514 | 1072 | 16.456862% |
| C | 6514 | 28 | 0.429843% |
| D | 6514 | 158 | 2.425545% |
Noise dominated data is calculated using 1-second bins in cleaned event files. If a bin has >2000 counts, and if more than 50% of those come from <1% of pixels, then it is considered to be noise-dominated and hence unusable.
| Quadrant | # 1 sec bins | Bins with >0 counts | Bins with >2000 counts | High rate bins dominated by noise | Noise dominated (total time) | Noise dominated (detector-on time) | Marked lightcurve |
|---|---|---|---|---|---|---|---|
| A | 7214 | 6514 | 264 | 264 | 3.66% | 4.05% | 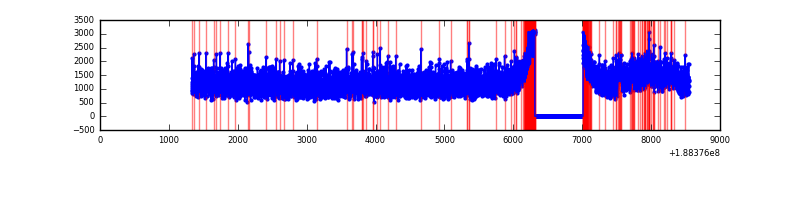 |
| B | 7213 | 6513 | 2122 | 2122 | 29.42% | 32.58% | 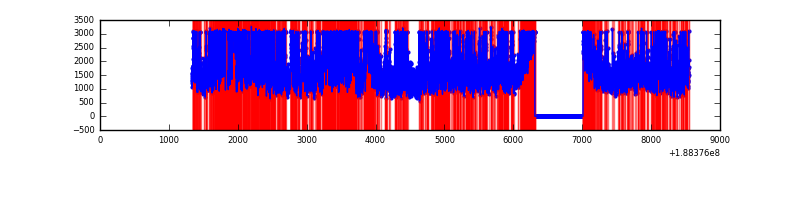 |
| C | 7213 | 6513 | 272 | 272 | 3.77% | 4.18% | 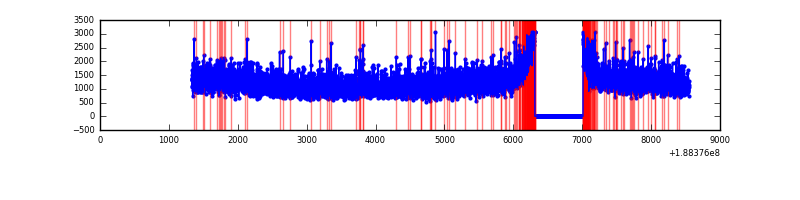 |
| D | 7213 | 6513 | 520 | 520 | 7.21% | 7.98% | 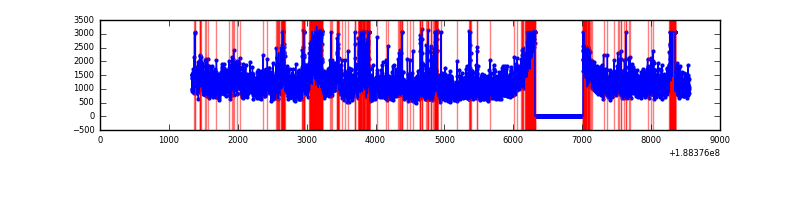 |
Top three noisy pixels from each quadrant. If the there are fewer than three noisy pixels in the level2.evt file, extra rows are filled as -1
| Pixel properties | Quadrant properties | ||||||
|---|---|---|---|---|---|---|---|
| Quadrant | DetID | PixID | Counts | Sigma | Mean | Median | Sigma |
| A | 3 | 80 | 280253 | 572.72 | 2027 | 2039 | 485.8 |
| A | 12 | 243 | 14864 | 26.4 | 2027 | 2039 | 485.8 |
| A | 8 | 14 | 11788 | 20.07 | 2027 | 2039 | 485.8 |
| B | 2 | 32 | 3384654 | 7343.35 | 1958 | 1967 | 460.6 |
| B | 8 | 4 | 352855 | 761.73 | 1958 | 1967 | 460.6 |
| B | 5 | 191 | 298927 | 644.66 | 1958 | 1967 | 460.6 |
| C | 15 | 241 | 340641 | 631.31 | 1929 | 1998 | 536.4 |
| C | 9 | 52 | 51475 | 92.24 | 1929 | 1998 | 536.4 |
| C | 5 | 234 | 27829 | 48.15 | 1929 | 1998 | 536.4 |
| D | 10 | 84 | 812256 | 1409.52 | 1864 | 1930 | 574.9 |
| D | 2 | 88 | 265517 | 458.49 | 1864 | 1930 | 574.9 |
| D | 10 | 125 | 99423 | 169.58 | 1864 | 1930 | 574.9 |
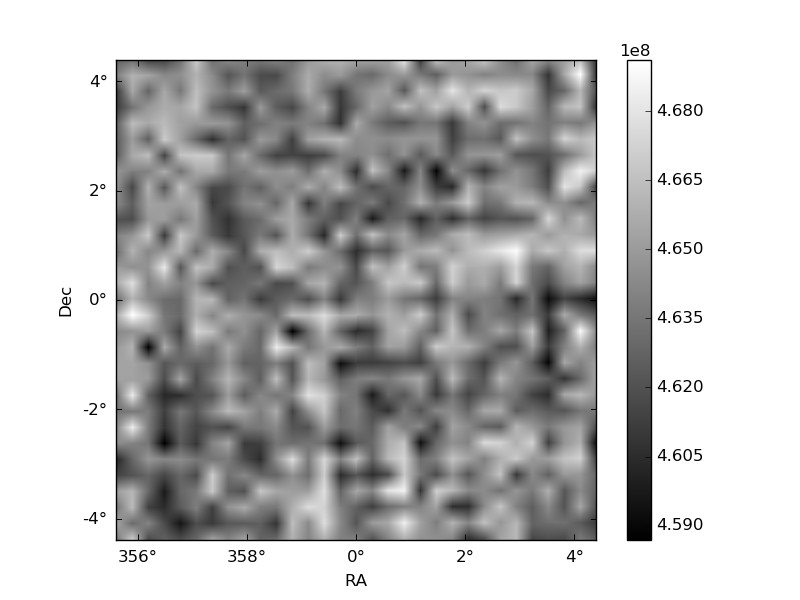
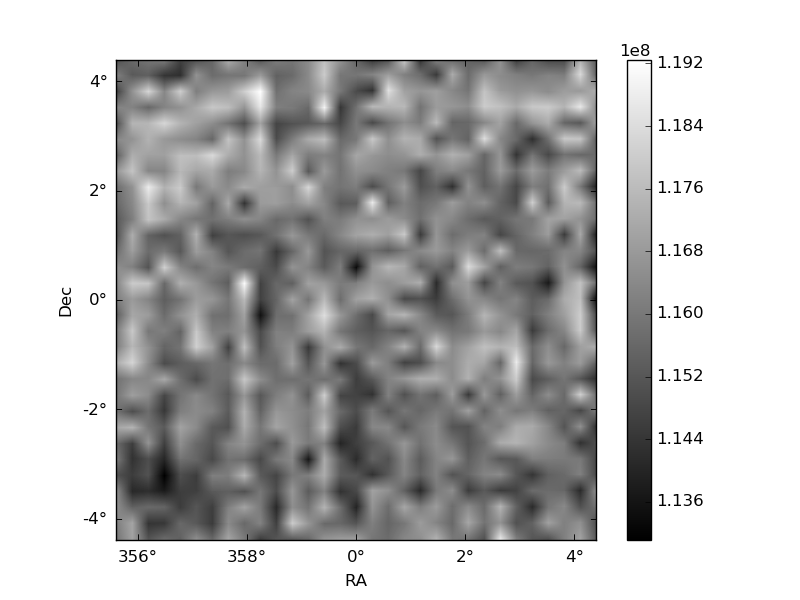
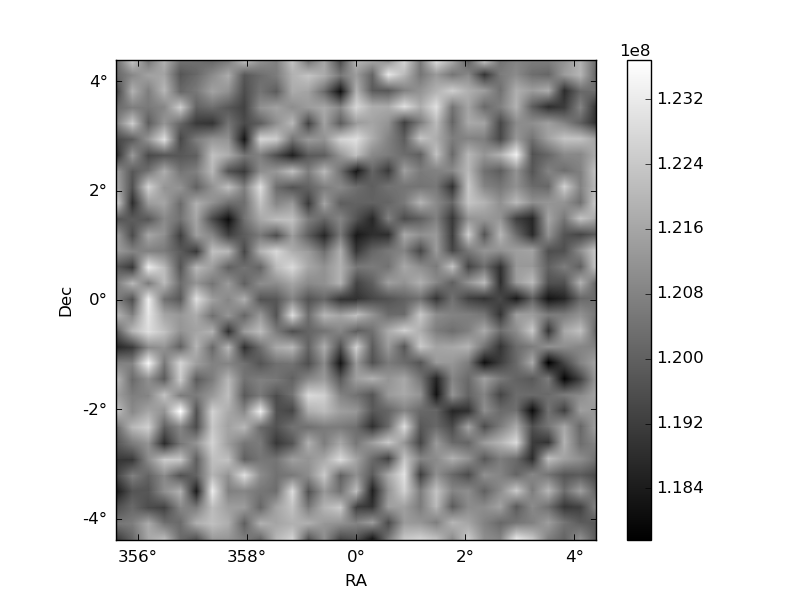
Histogram calculated using DETX and DETY for each event in the final _common_clean file
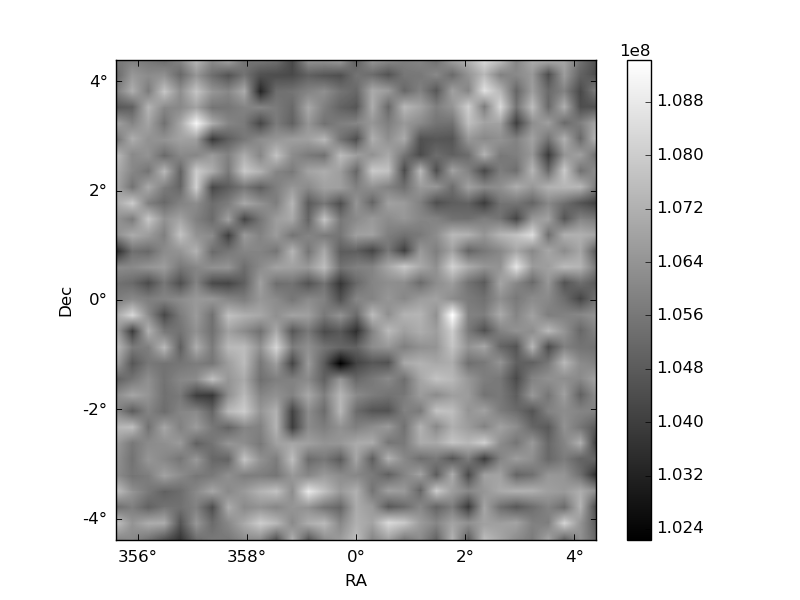
| Quadrant A | 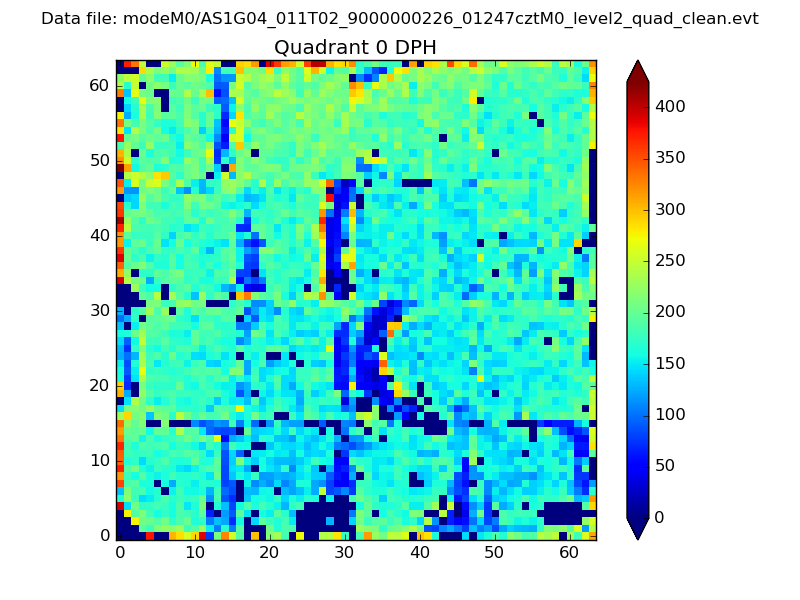 |
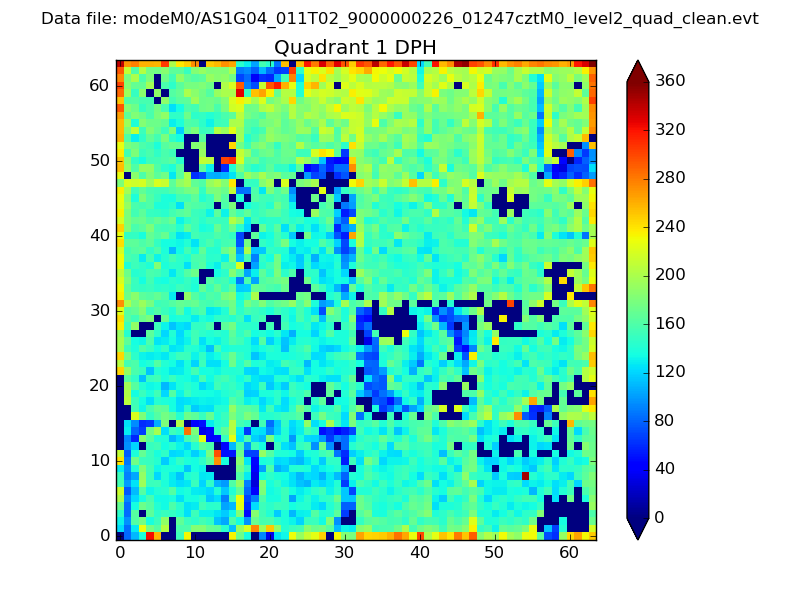 |
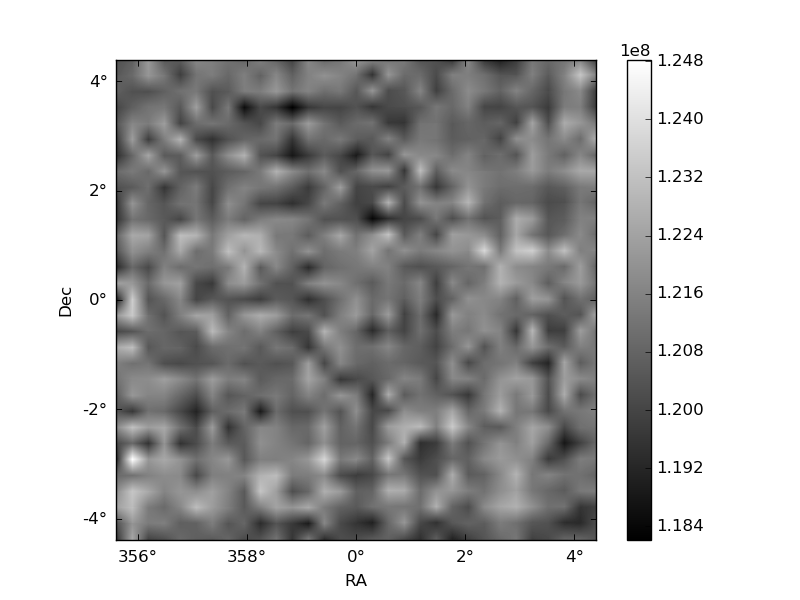
Quadrant B |
|---|---|---|---|
| Quadrant D | 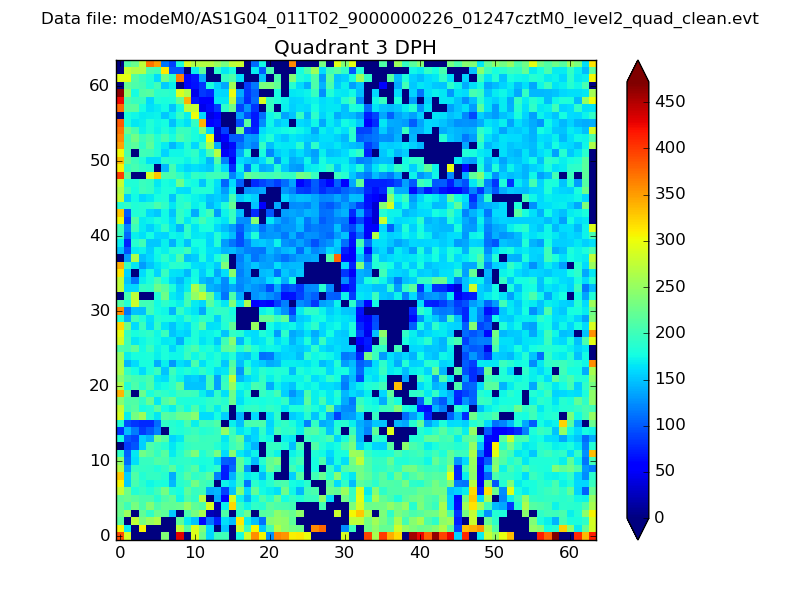 |
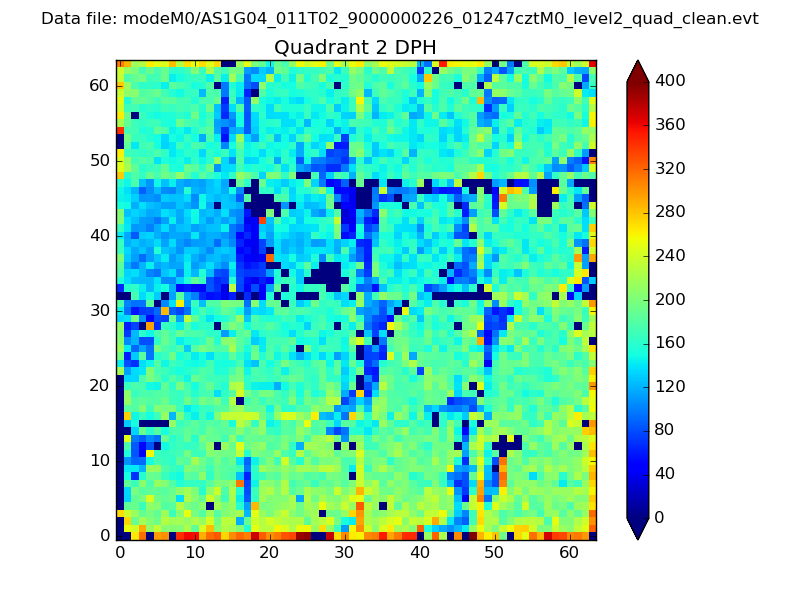 |
Quadrant C |
| Plot type | Count rate plots | Images |
|---|---|---|
| Comparison with Poisson distribution Blue bars denote a histogram of data divided into 1 sec bins. Red curve is a Poisson curve with rate = median count rate of data. |
 |
 |
| Quadrant-wise count rates Data is divided into 100 sec bins |
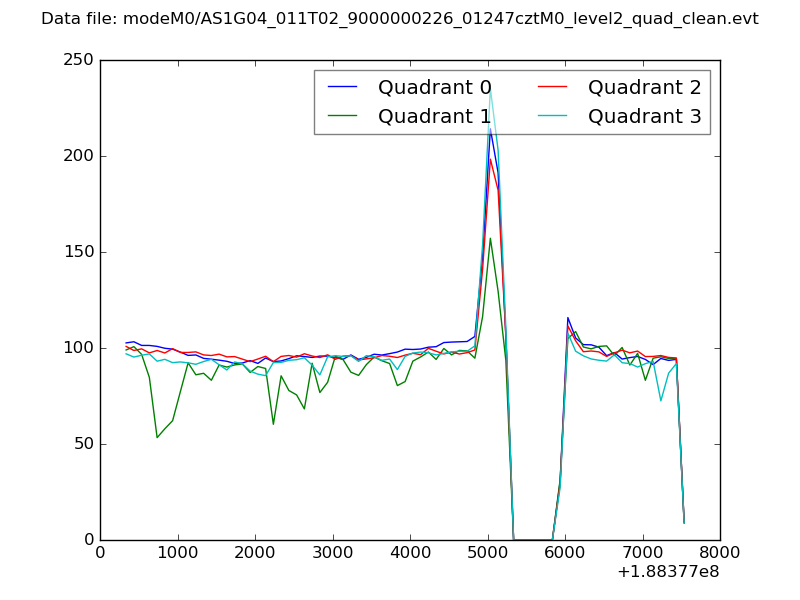 |
|
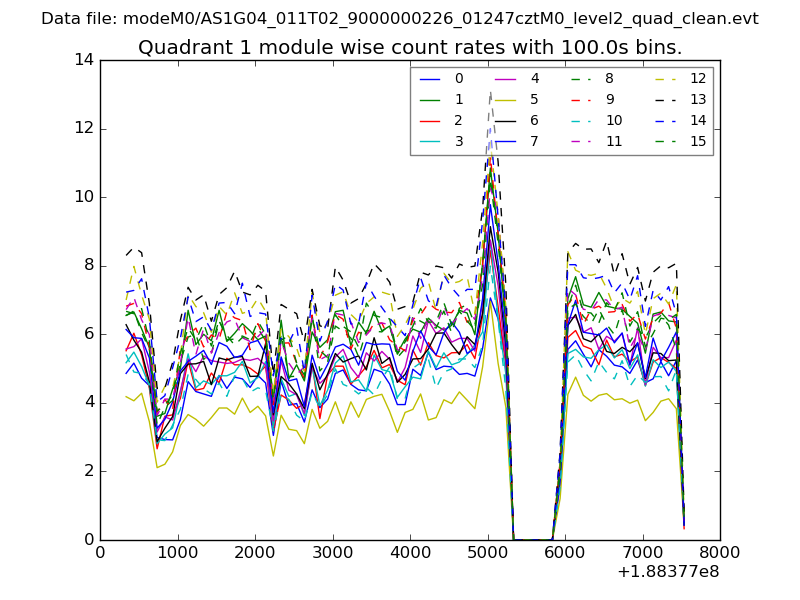
| Module-wise count rates for Quadrant A Data is divided into 100 sec bins |
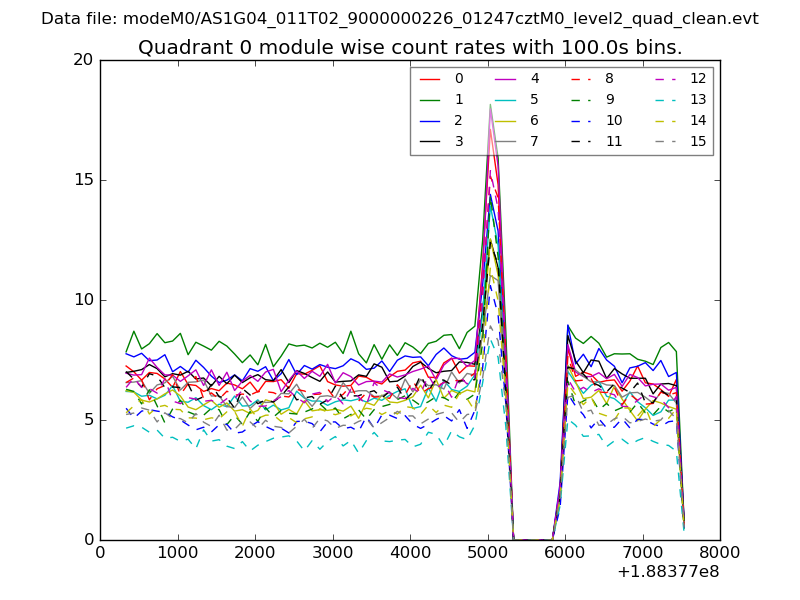 |
 |
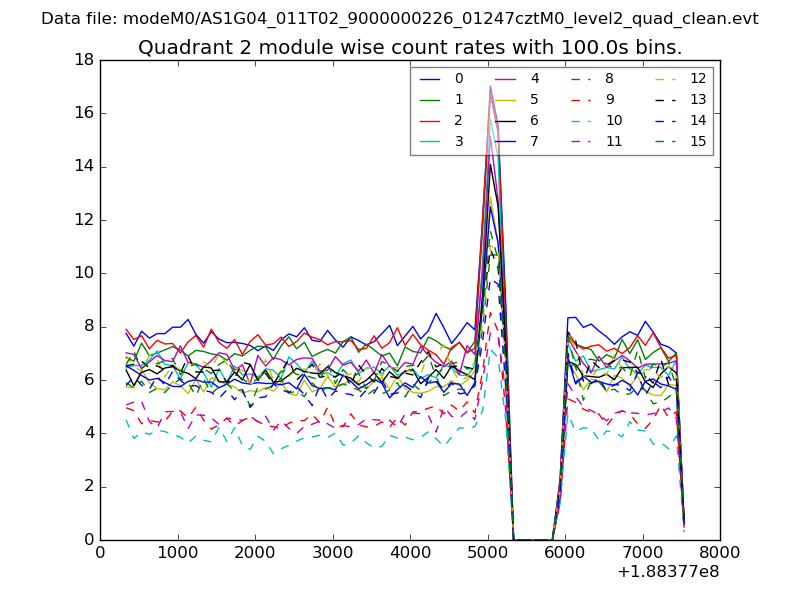
| Module-wise count rates for Quadrant B Data is divided into 100 sec bins |
 |
 |
| Module-wise count rates for Quadrant C Data is divided into 100 sec bins |
 |
 |
| Module-wise count rates for Quadrant D Data is divided into 100 sec bins |
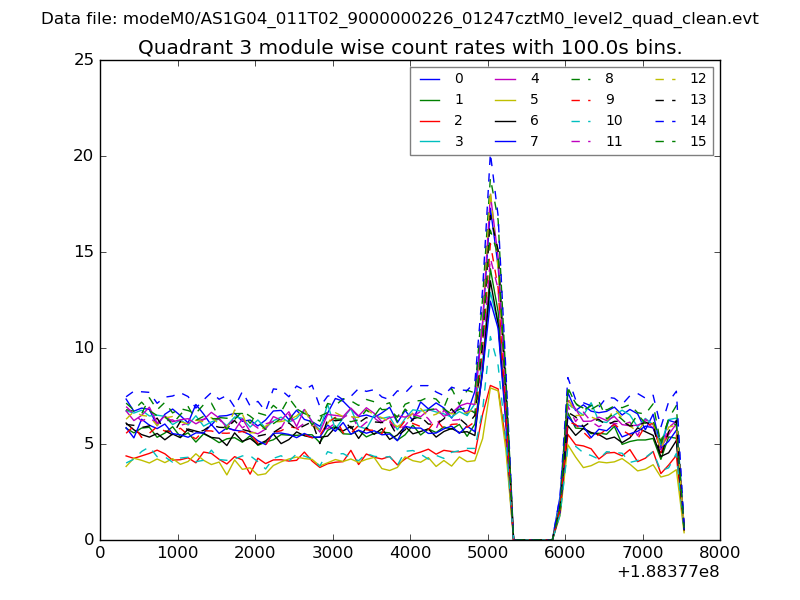 |
 |
| Parameter | Plot |
|---|---|
| CZT HV Monitor | 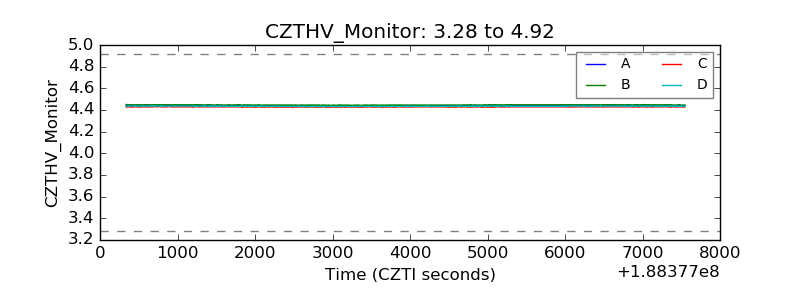 |
| D_VDD | 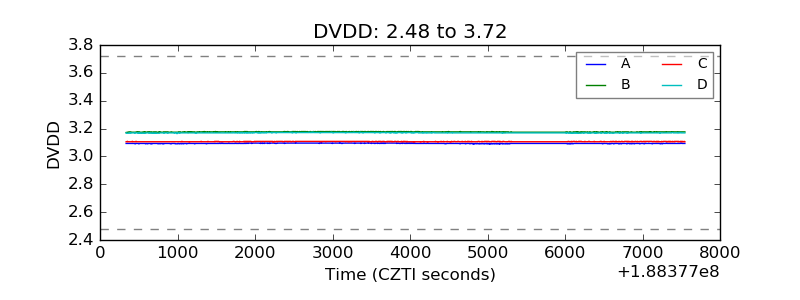 |
| Temperature 1 | 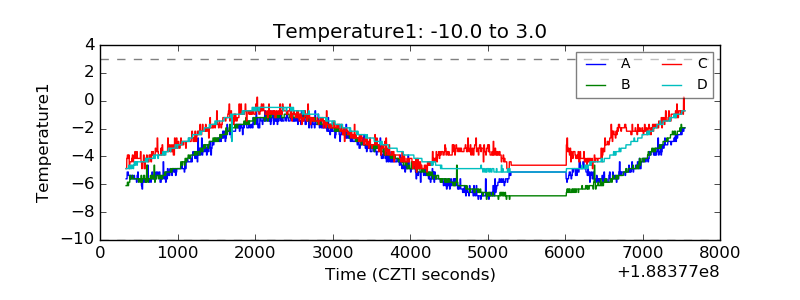 |
| Veto HV Monitor | 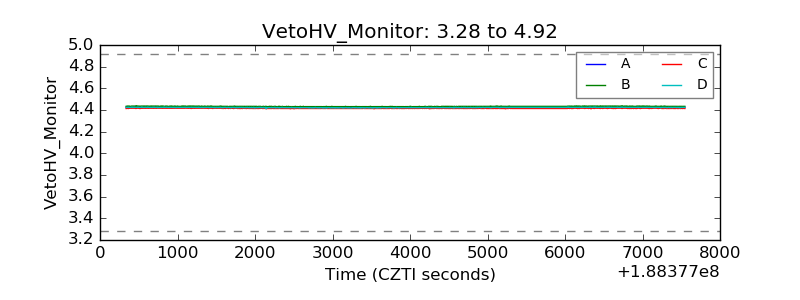 |
| Veto LLD | 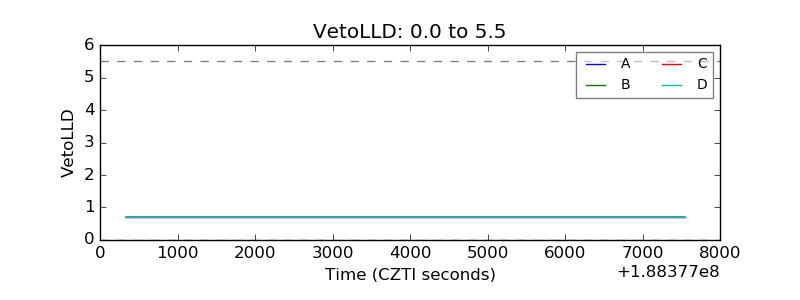 |
| Alpha Counter | 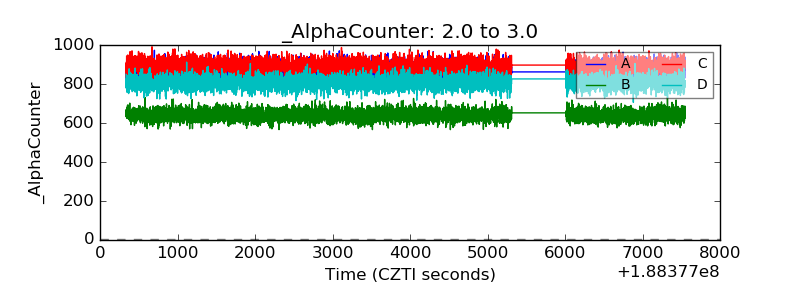 |
| _CPM_Rate | 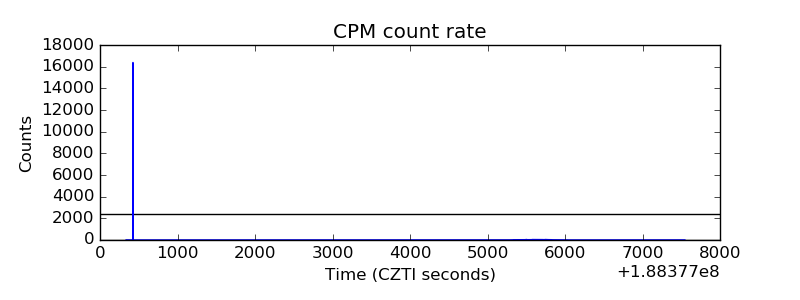 |
| CZT Counter | 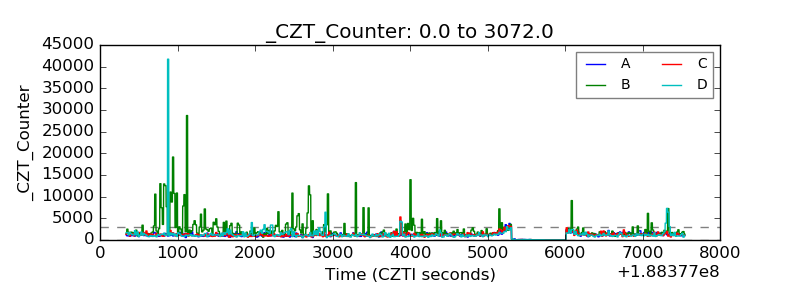 |
| +2.5 Volts monitor |  |
| +5 Volts monitor |  |
| _ROLL_ROT | 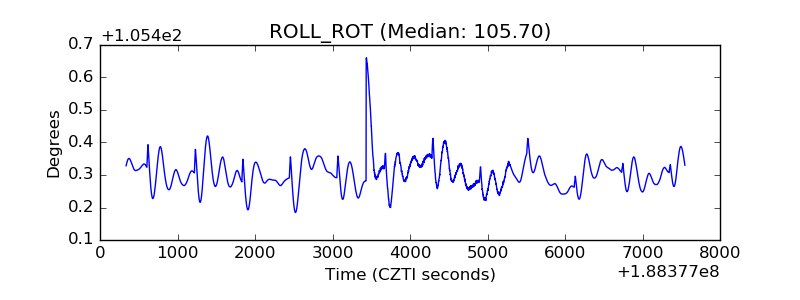 |
| _Roll_DEC | 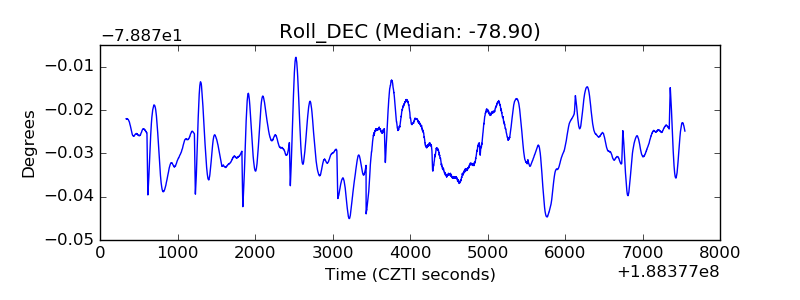 |
| _Roll_RA | 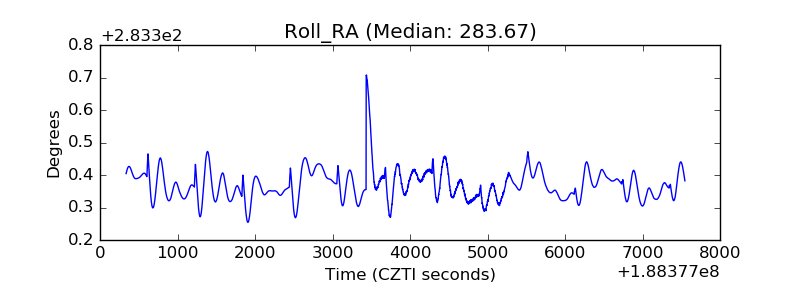 |
| Veto Counter | 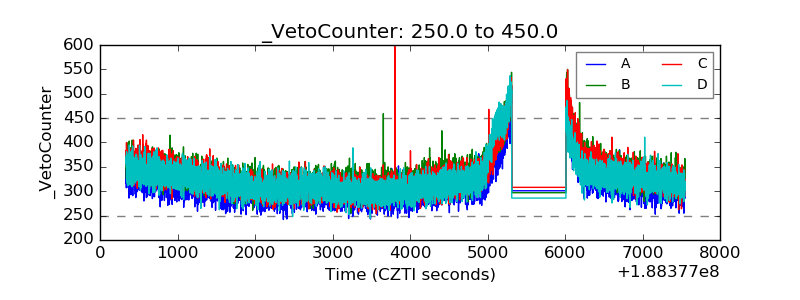 |