| Param | Original file | Final file |
|---|---|---|
| Filename | modeM0/AS1G04_011T02_9000000226_01248cztM0_level2.evt | modeM0/AS1G04_011T02_9000000226_01248cztM0_level2_quad_clean.evt |
| Size (bytes) | 1,526,840,640 | 112,089,600 |
| Size | 1.4 GB | 106.9 MB |
| Events in quadrant A | 10,598,245 | 748,473 |
| Events in quadrant B | 15,163,781 | 653,841 |
| Events in quadrant C | 9,639,423 | 745,759 |
| Events in quadrant D | 10,332,760 | 710,553 |
| Mode SS | |||
|---|---|---|---|
| Quadrant | BADHDUFLAG | Total packets | Discarded packets |
| A | 0 | 154 | 0 |
| B | 0 | 154 | 0 |
| C | 0 | 154 | 0 |
| D | 0 | 154 | 0 |
| Mode M0 | |||
|---|---|---|---|
| Quadrant | BADHDUFLAG | Total packets | Discarded packets |
| A | 0 | 36932 | 1 |
| B | 0 | 50745 | 0 |
| C | 0 | 34088 | 0 |
| D | 0 | 36251 | 0 |
| Quadrant | Total seconds | Saturated seconds | Saturation percentage |
|---|---|---|---|
| A | 7694 | 66 | 0.857811% |
| B | 7694 | 1827 | 23.745776% |
| C | 7694 | 49 | 0.636860% |
| D | 7694 | 445 | 5.783728% |
Noise dominated data is calculated using 1-second bins in cleaned event files. If a bin has >2000 counts, and if more than 50% of those come from <1% of pixels, then it is considered to be noise-dominated and hence unusable.
| Quadrant | # 1 sec bins | Bins with >0 counts | Bins with >2000 counts | High rate bins dominated by noise | Noise dominated (total time) | Noise dominated (detector-on time) | Marked lightcurve |
|---|---|---|---|---|---|---|---|
| A | 7693 | 7693 | 753 | 753 | 9.79% | 9.79% | 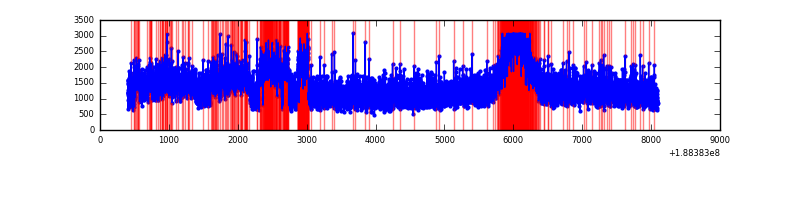 |
| B | 7693 | 7693 | 3137 | 3137 | 40.78% | 40.78% | 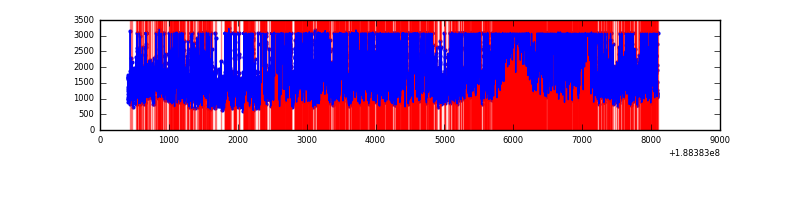 |
| C | 7693 | 7693 | 489 | 489 | 6.36% | 6.36% | 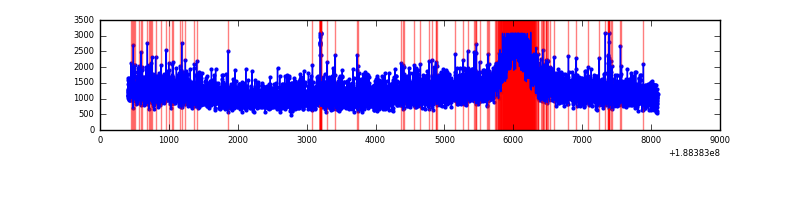 |
| D | 7693 | 7693 | 1030 | 1030 | 13.39% | 13.39% | 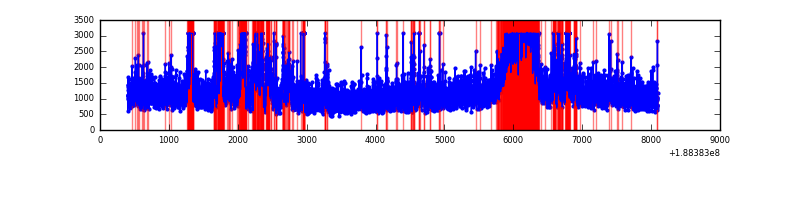 |
Top three noisy pixels from each quadrant. If the there are fewer than three noisy pixels in the level2.evt file, extra rows are filled as -1
| Pixel properties | Quadrant properties | ||||||
|---|---|---|---|---|---|---|---|
| Quadrant | DetID | PixID | Counts | Sigma | Mean | Median | Sigma |
| A | 3 | 80 | 1022470 | 1690.22 | 2488 | 2493 | 603.5 |
| A | 12 | 243 | 14491 | 19.88 | 2488 | 2493 | 603.5 |
| A | 11 | 79 | 9973 | 12.4 | 2488 | 2493 | 603.5 |
| B | 2 | 32 | 5159972 | 9469.32 | 2292 | 2294 | 544.7 |
| B | 8 | 4 | 631018 | 1154.32 | 2292 | 2294 | 544.7 |
| B | 5 | 191 | 195526 | 354.77 | 2292 | 2294 | 544.7 |
| C | 15 | 241 | 403694 | 616.11 | 2325 | 2397 | 651.3 |
| C | 9 | 52 | 62569 | 92.38 | 2325 | 2397 | 651.3 |
| C | 3 | 79 | 46452 | 67.64 | 2325 | 2397 | 651.3 |
| D | 2 | 88 | 1777283 | 2536.53 | 2250 | 2331 | 699.8 |
| D | 10 | 84 | 55150 | 75.48 | 2250 | 2331 | 699.8 |
| D | 10 | 125 | 31521 | 41.71 | 2250 | 2331 | 699.8 |
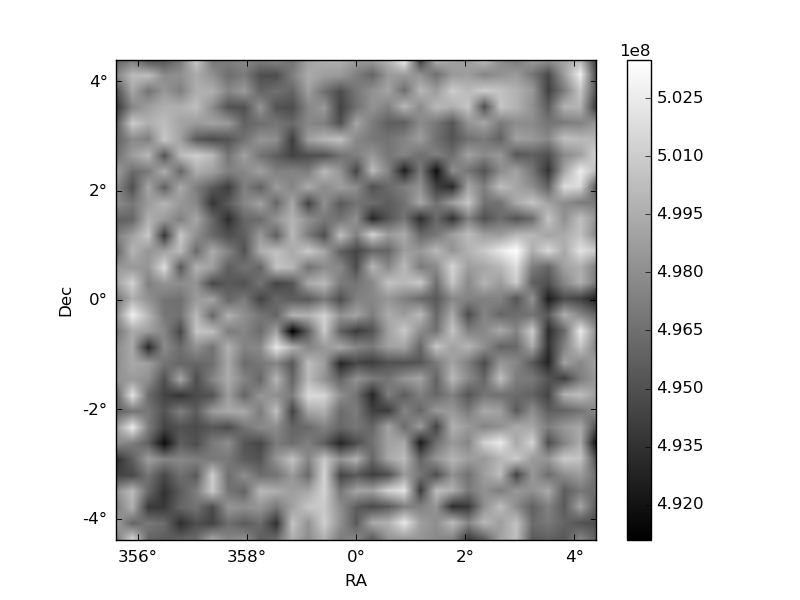
Histogram calculated using DETX and DETY for each event in the final _common_clean file
| Quadrant A |  |
 |
Quadrant B |
|---|---|---|---|
| Quadrant D |  |
 |
Quadrant C |
| Plot type | Count rate plots | Images |
|---|---|---|
| Comparison with Poisson distribution Blue bars denote a histogram of data divided into 1 sec bins. Red curve is a Poisson curve with rate = median count rate of data. |
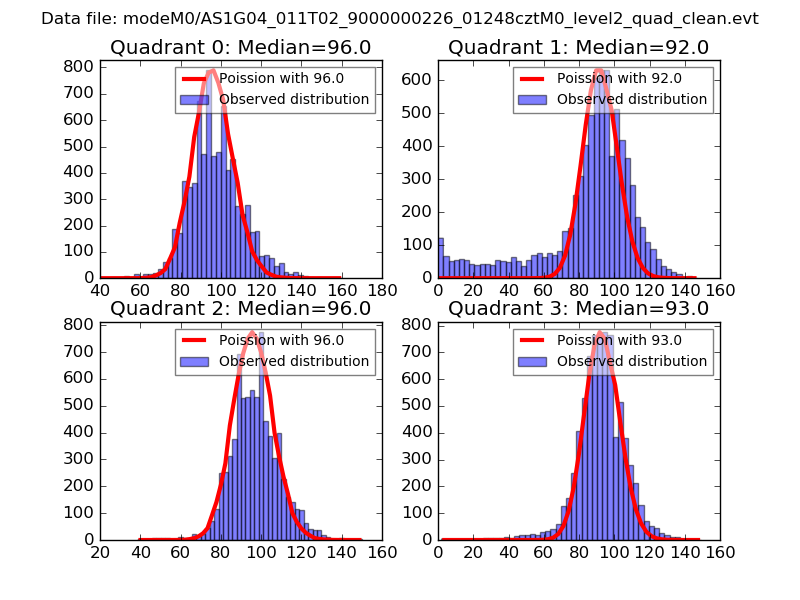 |
 |
| Quadrant-wise count rates Data is divided into 100 sec bins |
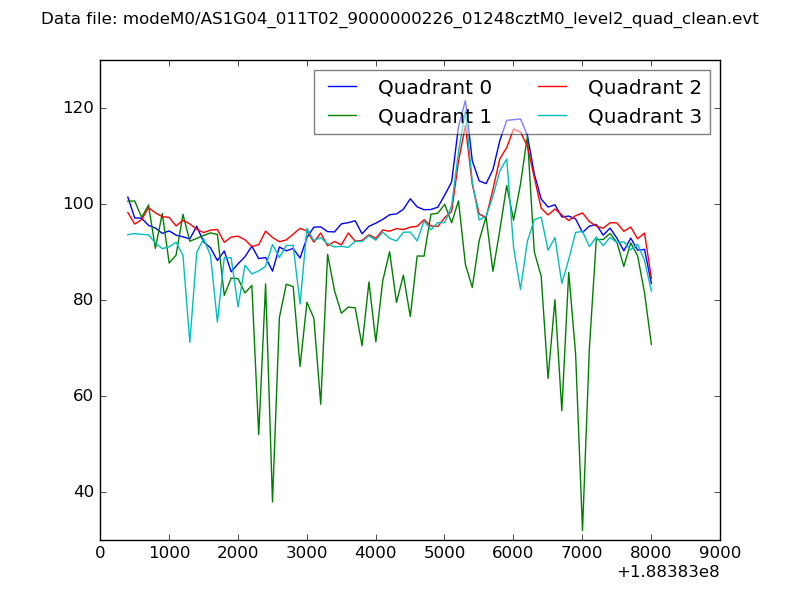 |
|
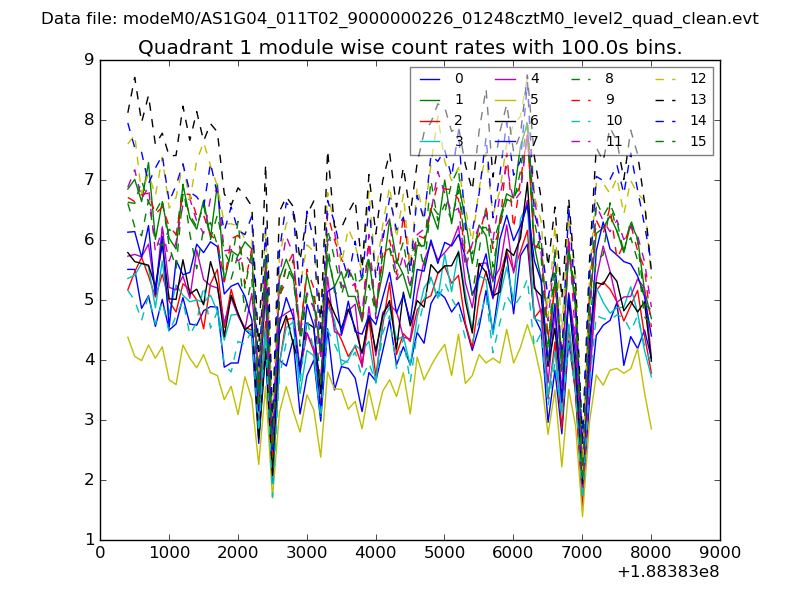
| Module-wise count rates for Quadrant A Data is divided into 100 sec bins |
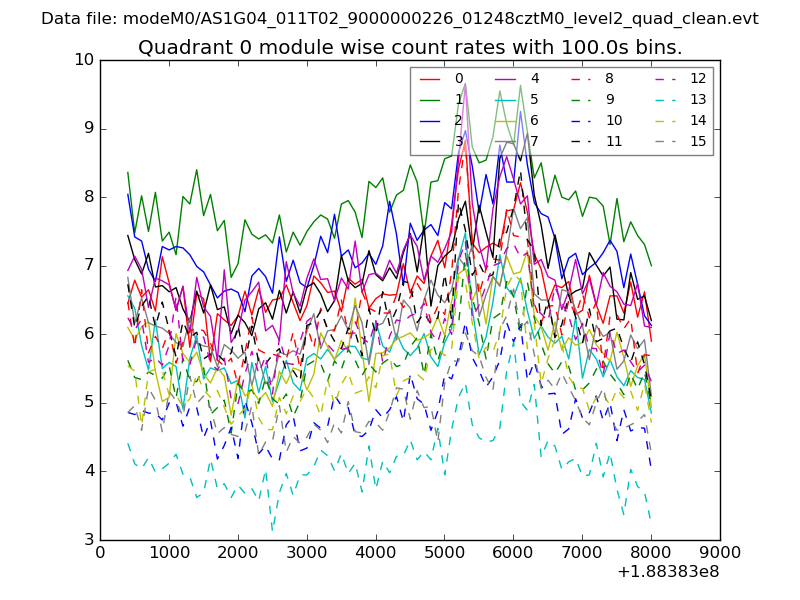 |
 |
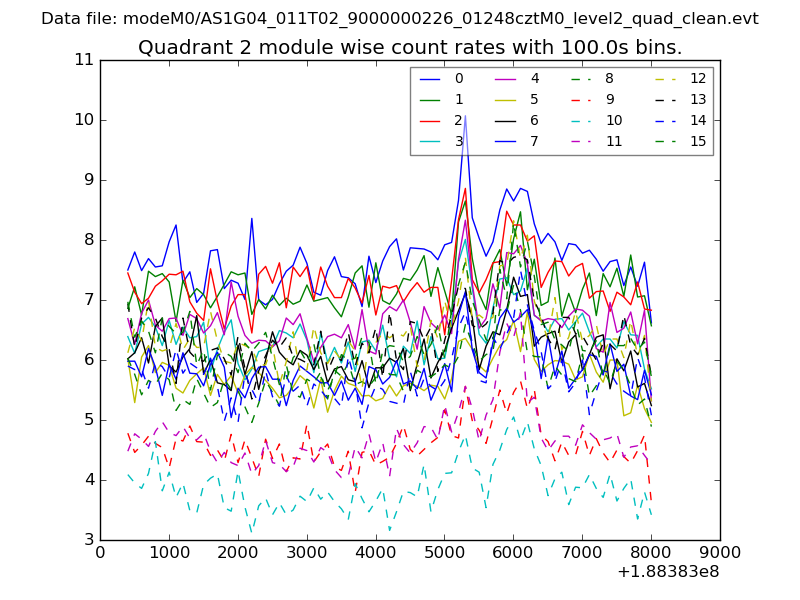
| Module-wise count rates for Quadrant B Data is divided into 100 sec bins |
 |
 |
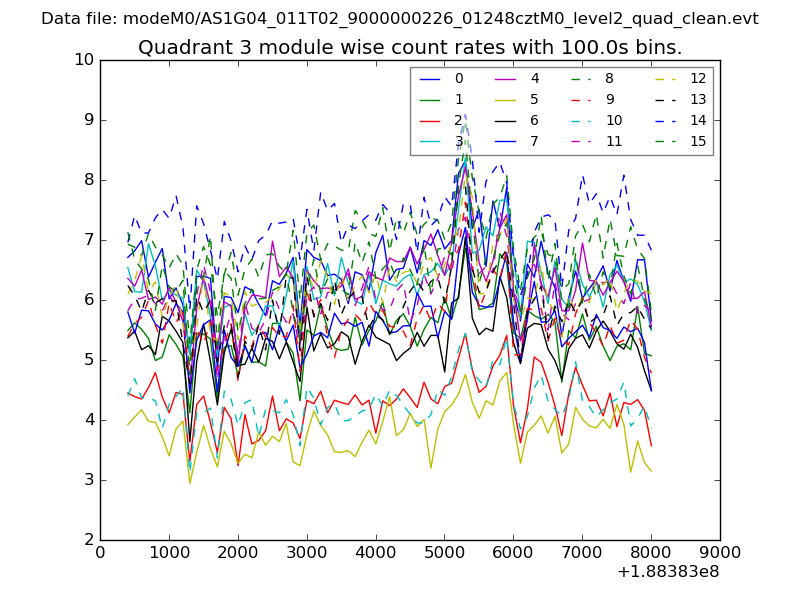
| Module-wise count rates for Quadrant C Data is divided into 100 sec bins |
 |
 |
| Module-wise count rates for Quadrant D Data is divided into 100 sec bins |
 |
 |
| Parameter | Plot |
|---|---|
| CZT HV Monitor | 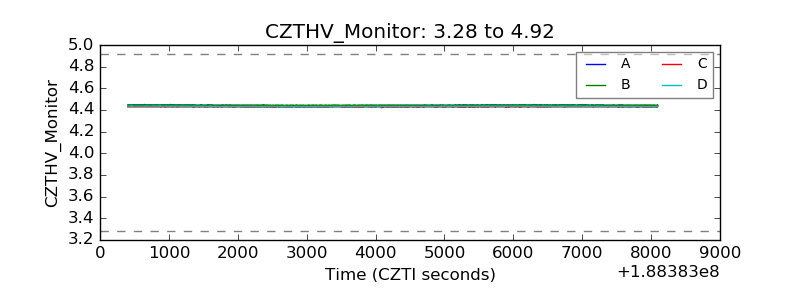 |
| D_VDD | 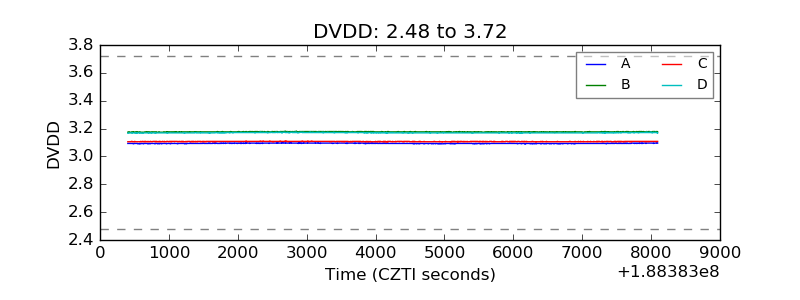 |
| Temperature 1 | 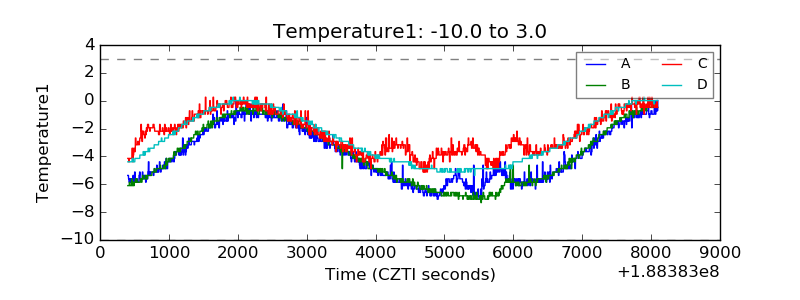 |
| Veto HV Monitor | 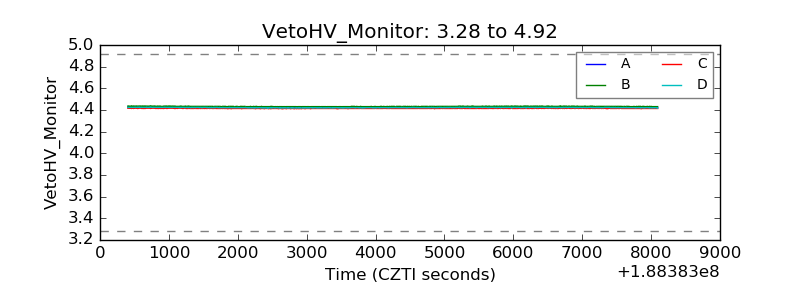 |
| Veto LLD | 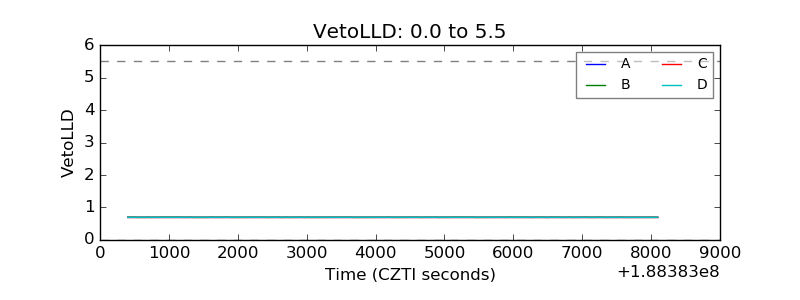 |
| Alpha Counter | 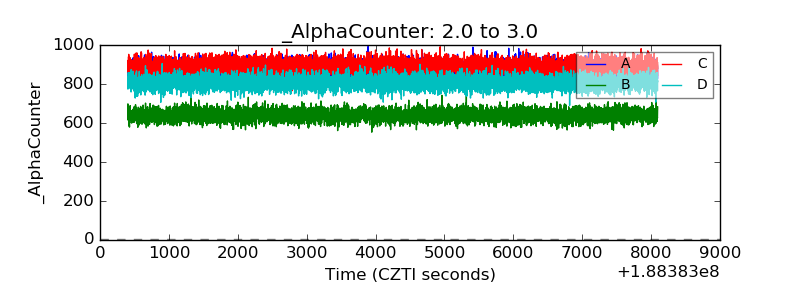 |
| _CPM_Rate | 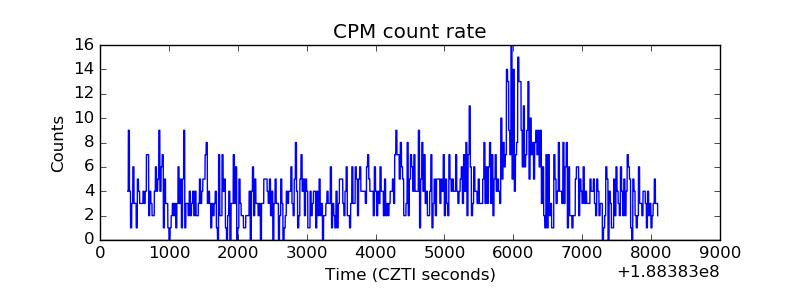 |
| CZT Counter |  |
| +2.5 Volts monitor |  |
| +5 Volts monitor |  |
| _ROLL_ROT | 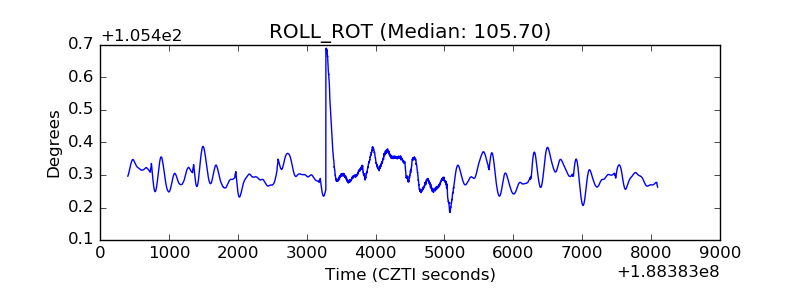 |
| _Roll_DEC | 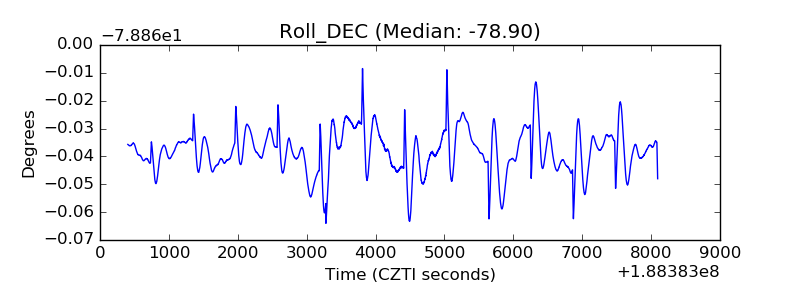 |
| _Roll_RA | 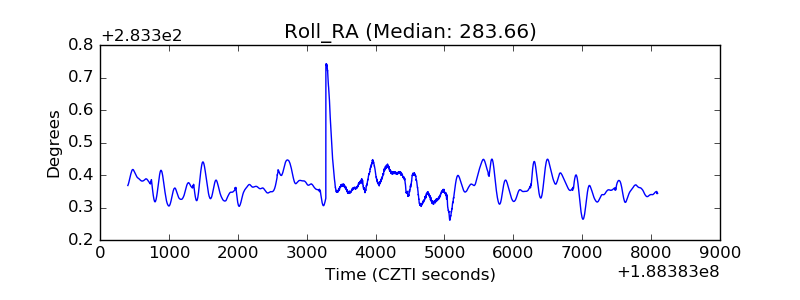 |
| Veto Counter | 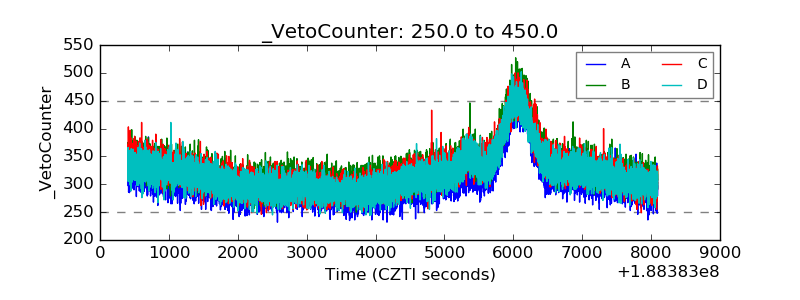 |