| Param | Original file | Final file |
|---|---|---|
| Filename | modeM0/AS1G04_011T02_9000000226_01249cztM0_level2.evt | modeM0/AS1G04_011T02_9000000226_01249cztM0_level2_quad_clean.evt |
| Size (bytes) | 1,382,581,440 | 103,135,680 |
| Size | 1.3 GB | 98.4 MB |
| Events in quadrant A | 8,480,124 | 704,326 |
| Events in quadrant B | 16,462,420 | 541,480 |
| Events in quadrant C | 8,655,170 | 692,123 |
| Events in quadrant D | 7,802,238 | 686,818 |
| Mode SS | |||
|---|---|---|---|
| Quadrant | BADHDUFLAG | Total packets | Discarded packets |
| A | 0 | 144 | 0 |
| B | 0 | 144 | 0 |
| C | 0 | 144 | 0 |
| D | 0 | 144 | 0 |
| Mode M0 | |||
|---|---|---|---|
| Quadrant | BADHDUFLAG | Total packets | Discarded packets |
| A | 0 | 30255 | 1 |
| B | 0 | 54369 | 0 |
| C | 0 | 30773 | 0 |
| D | 0 | 28265 | 0 |
| Quadrant | Total seconds | Saturated seconds | Saturation percentage |
|---|---|---|---|
| A | 7140 | 0 | 0.000000% |
| B | 7140 | 2806 | 39.299720% |
| C | 7140 | 7 | 0.098039% |
| D | 7140 | 6 | 0.084034% |
Noise dominated data is calculated using 1-second bins in cleaned event files. If a bin has >2000 counts, and if more than 50% of those come from <1% of pixels, then it is considered to be noise-dominated and hence unusable.
| Quadrant | # 1 sec bins | Bins with >0 counts | Bins with >2000 counts | High rate bins dominated by noise | Noise dominated (total time) | Noise dominated (detector-on time) | Marked lightcurve |
|---|---|---|---|---|---|---|---|
| A | 7139 | 7139 | 195 | 195 | 2.73% | 2.73% |  |
| B | 7139 | 7139 | 4264 | 4264 | 59.73% | 59.73% | 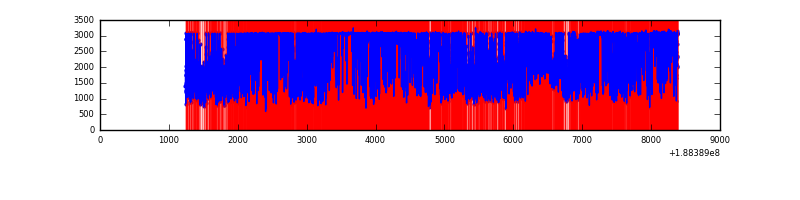 |
| C | 7139 | 7139 | 235 | 235 | 3.29% | 3.29% | 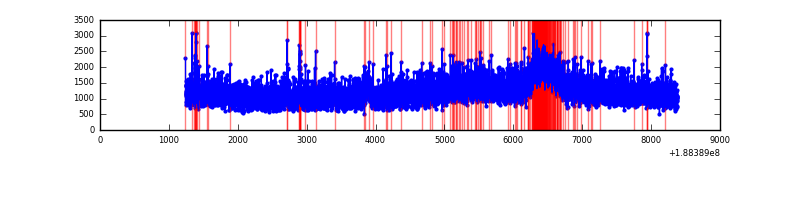 |
| D | 7139 | 7139 | 127 | 127 | 1.78% | 1.78% | 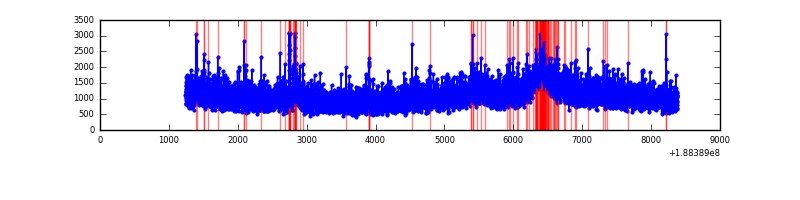 |
Top three noisy pixels from each quadrant. If the there are fewer than three noisy pixels in the level2.evt file, extra rows are filled as -1
| Pixel properties | Quadrant properties | ||||||
|---|---|---|---|---|---|---|---|
| Quadrant | DetID | PixID | Counts | Sigma | Mean | Median | Sigma |
| A | 12 | 243 | 18739 | 31.31 | 2202 | 2215 | 527.8 |
| A | 11 | 79 | 10473 | 15.65 | 2202 | 2215 | 527.8 |
| A | 13 | 235 | 7873 | 10.72 | 2202 | 2215 | 527.8 |
| B | 2 | 32 | 8392698 | 18744.86 | 1887 | 1893 | 447.6 |
| B | 8 | 4 | 378864 | 842.14 | 1887 | 1893 | 447.6 |
| B | 12 | 52 | 260188 | 577.02 | 1887 | 1893 | 447.6 |
| C | 15 | 241 | 355245 | 614.84 | 2057 | 2129 | 574.3 |
| C | 5 | 234 | 102762 | 175.22 | 2057 | 2129 | 574.3 |
| C | 9 | 52 | 74483 | 125.98 | 2057 | 2129 | 574.3 |
| D | 13 | 70 | 77236 | 119.3 | 2030 | 2107 | 629.7 |
| D | 10 | 84 | 38801 | 58.27 | 2030 | 2107 | 629.7 |
| D | 10 | 85 | 36514 | 54.64 | 2030 | 2107 | 629.7 |
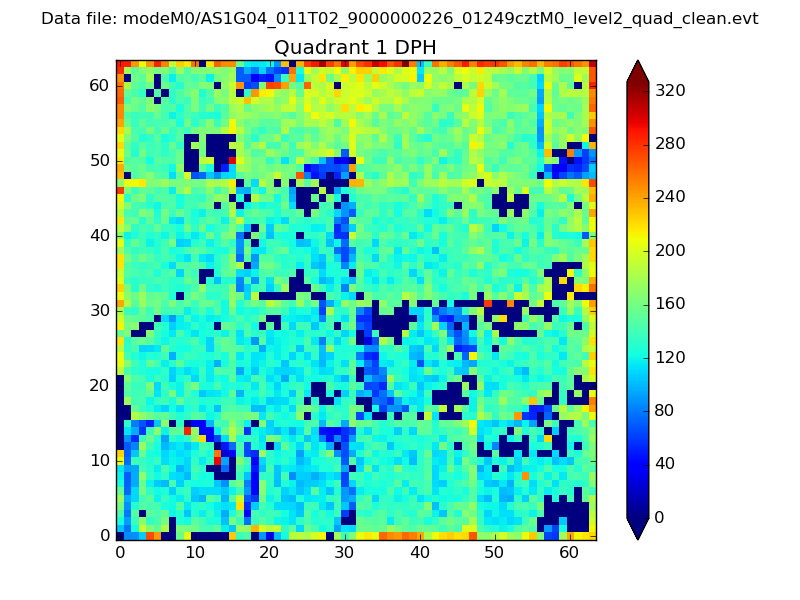
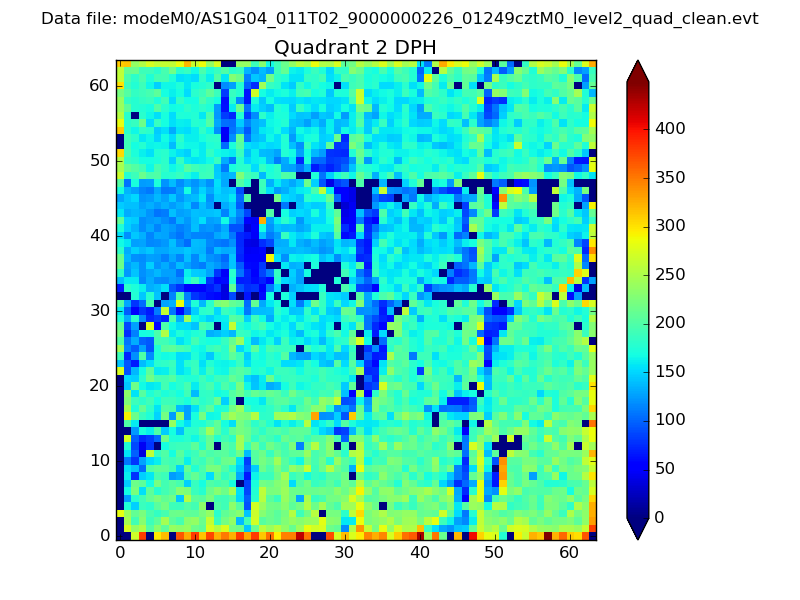
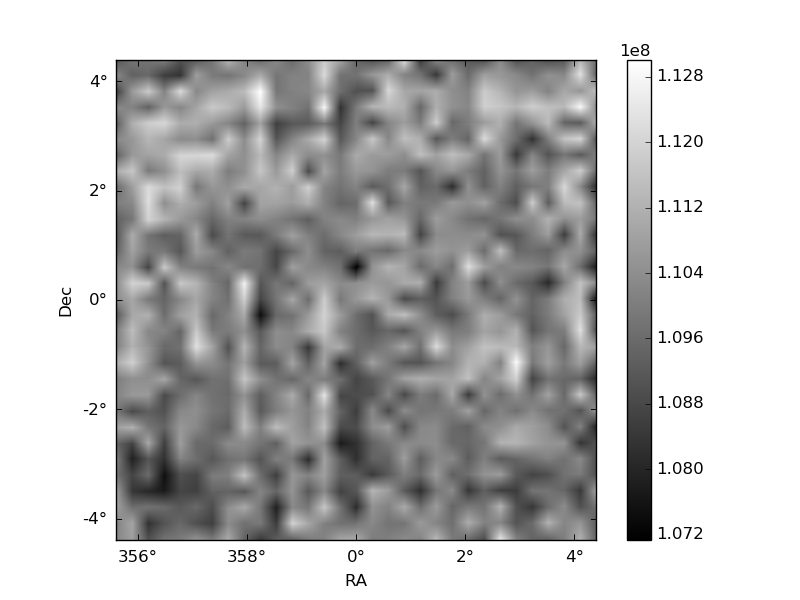
Histogram calculated using DETX and DETY for each event in the final _common_clean file
| Quadrant A | 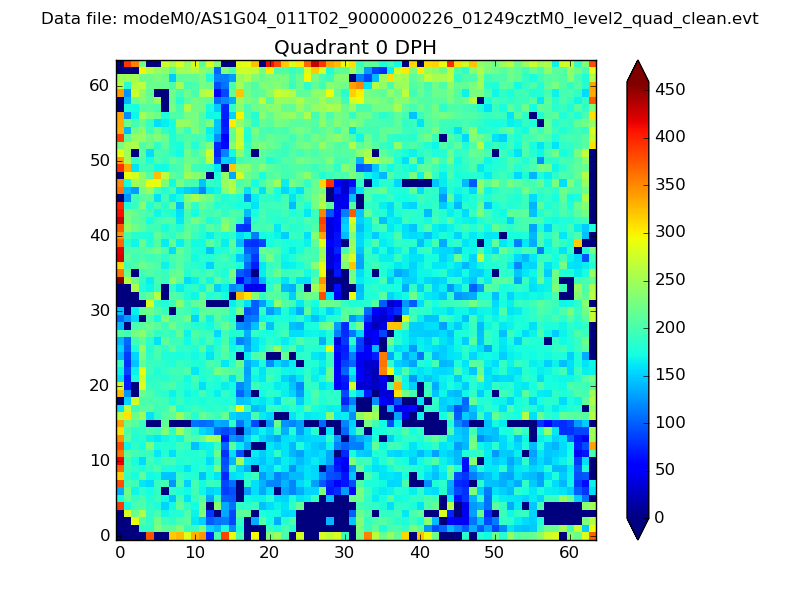 |
 |
Quadrant B |
|---|---|---|---|
| Quadrant D | 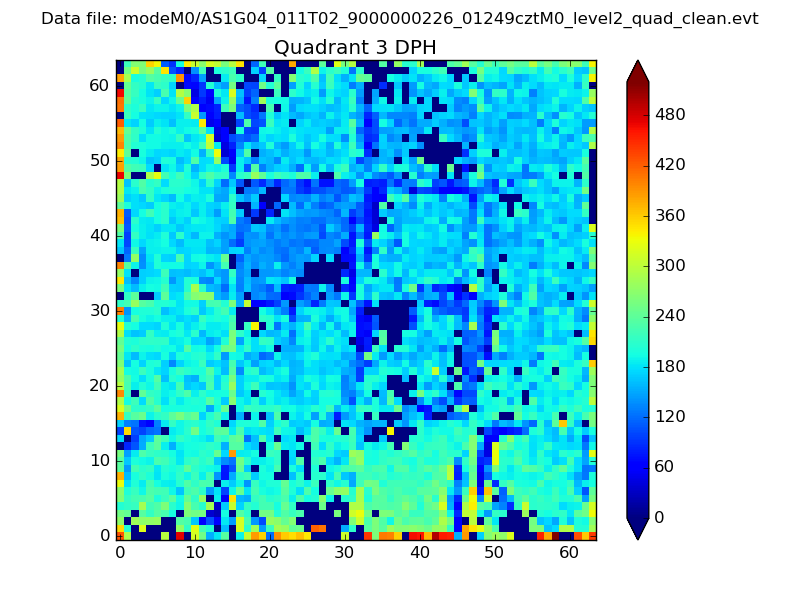 |
 |
Quadrant C |
| Plot type | Count rate plots | Images |
|---|---|---|
| Comparison with Poisson distribution Blue bars denote a histogram of data divided into 1 sec bins. Red curve is a Poisson curve with rate = median count rate of data. |
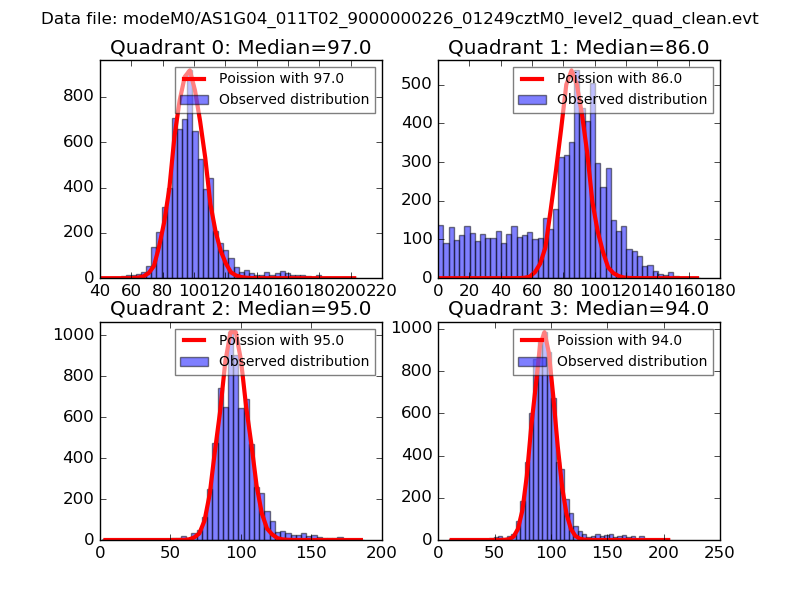 |
 |
| Quadrant-wise count rates Data is divided into 100 sec bins |
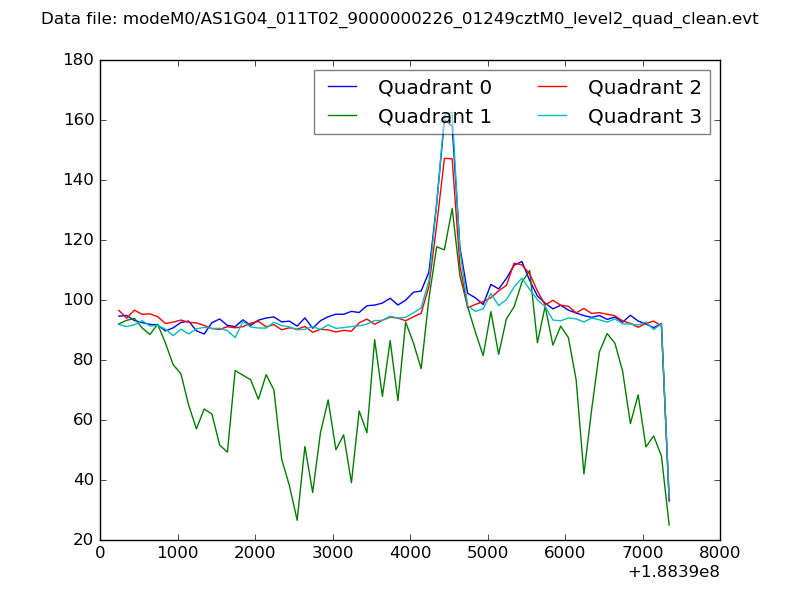 |
|
| Module-wise count rates for Quadrant A Data is divided into 100 sec bins |
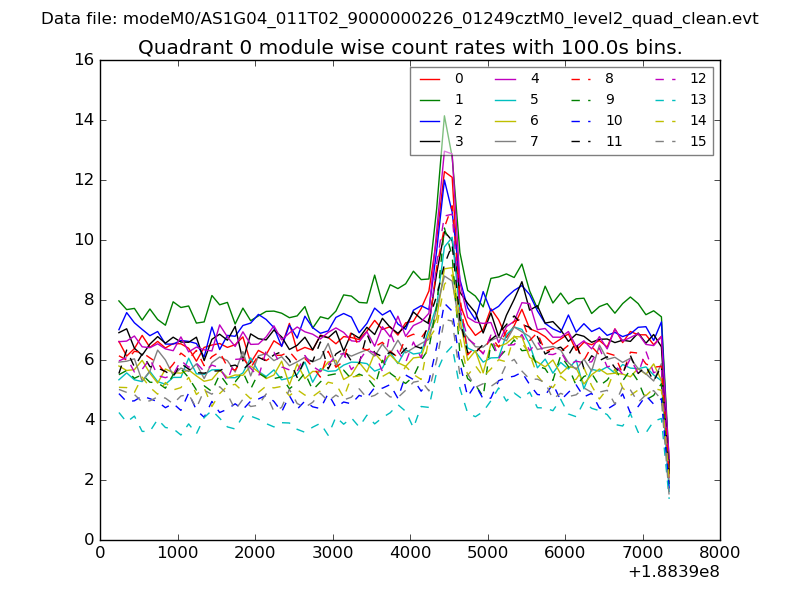 |
 |
| Module-wise count rates for Quadrant B Data is divided into 100 sec bins |
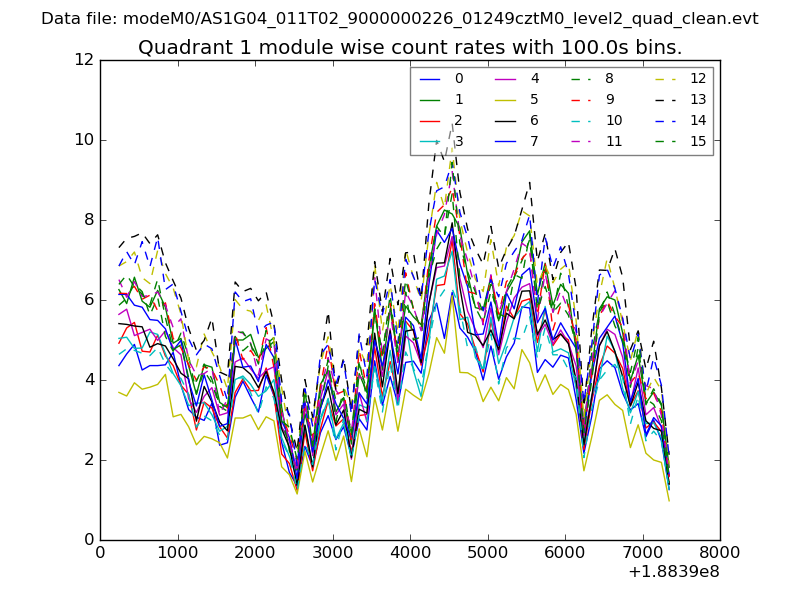 |
 |
| Module-wise count rates for Quadrant C Data is divided into 100 sec bins |
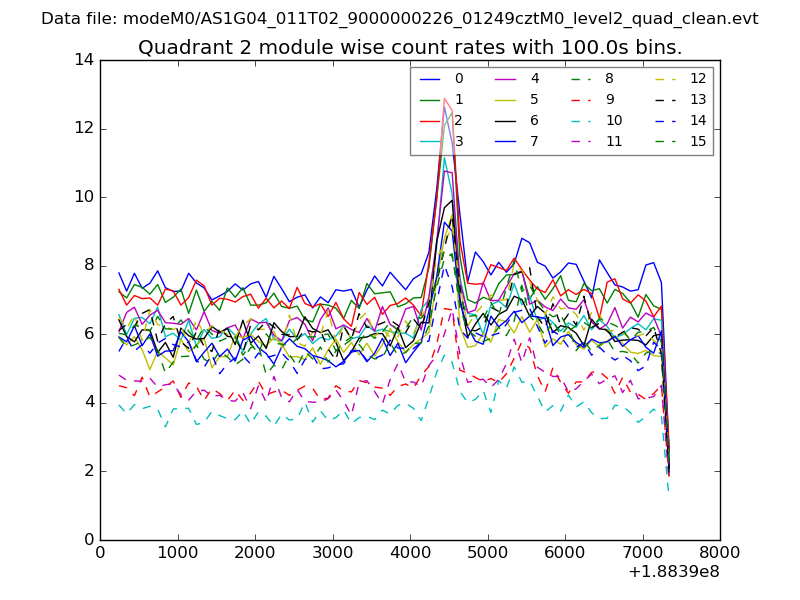 |
 |
| Module-wise count rates for Quadrant D Data is divided into 100 sec bins |
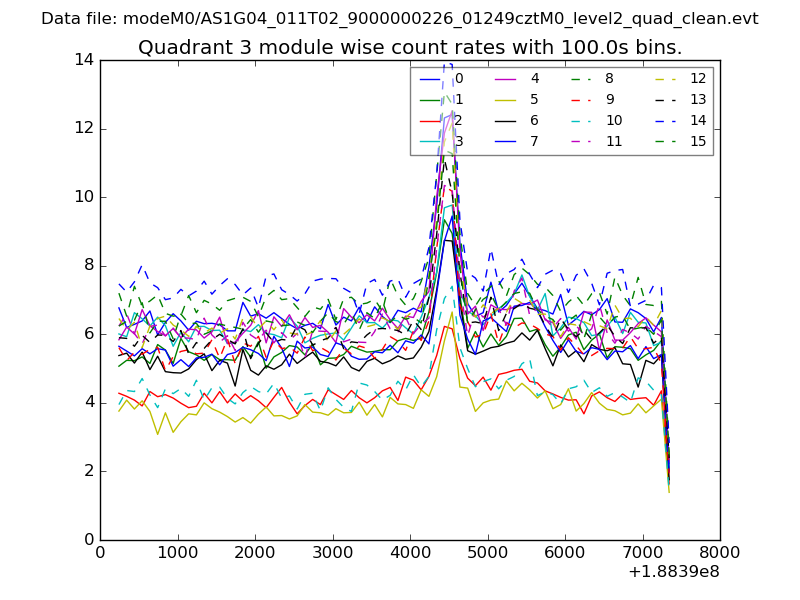 |
 |
| Parameter | Plot |
|---|---|
| CZT HV Monitor | 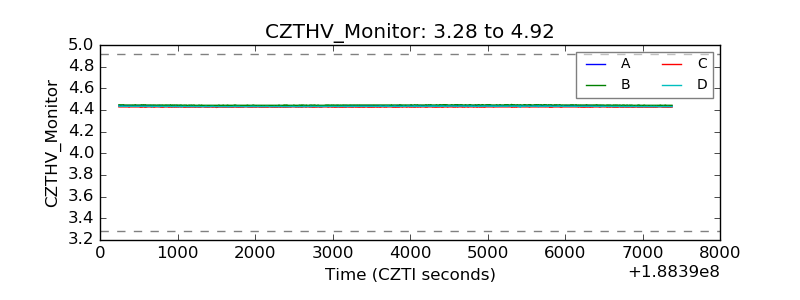 |
| D_VDD | 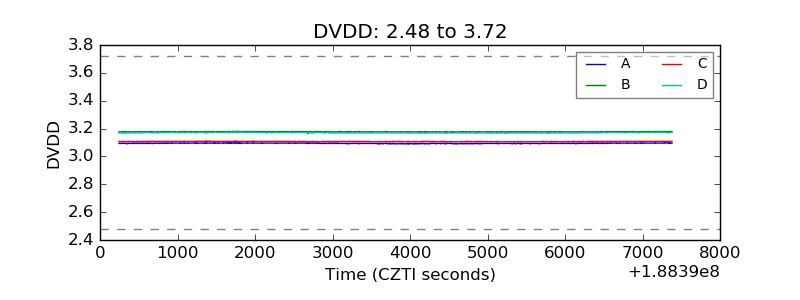 |
| Temperature 1 | 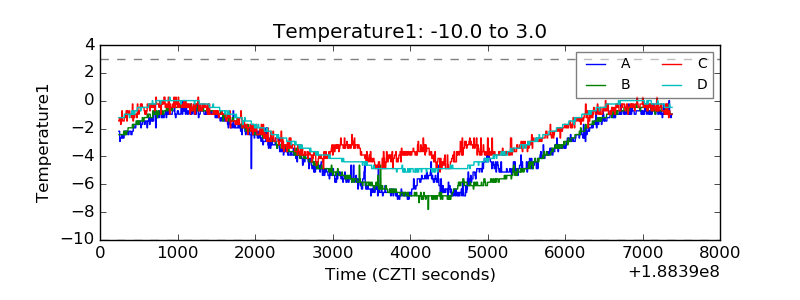 |
| Veto HV Monitor | 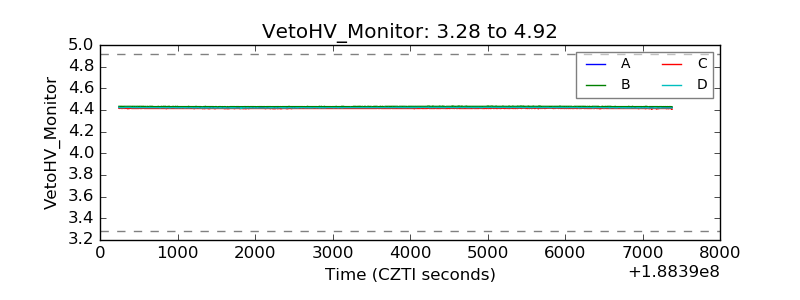 |
| Veto LLD | 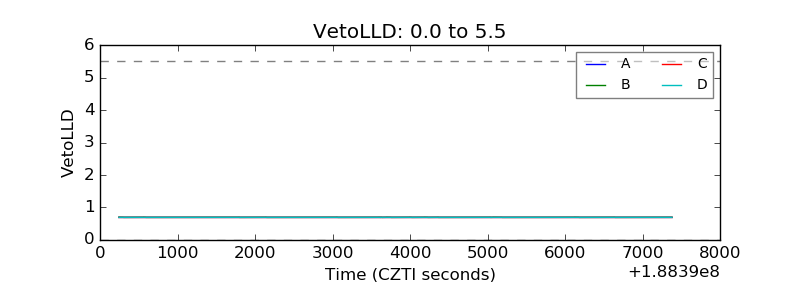 |
| Alpha Counter | 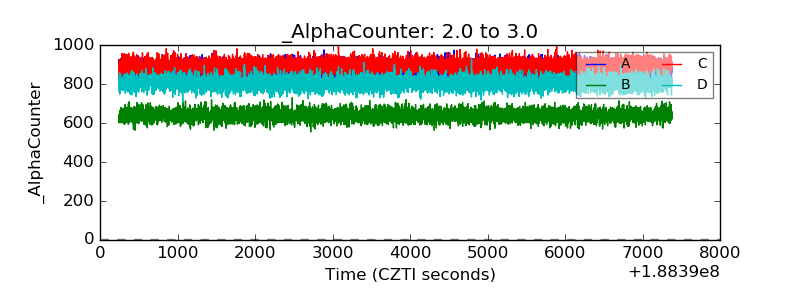 |
| _CPM_Rate | 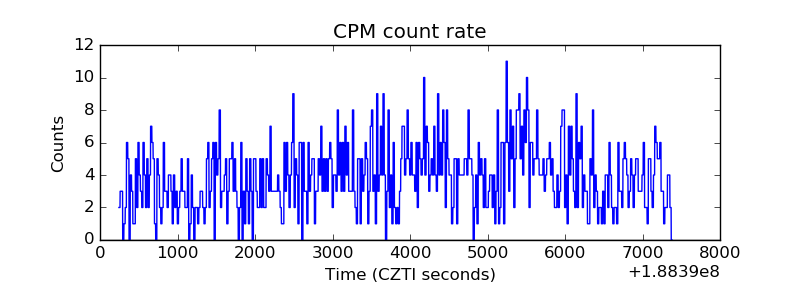 |
| CZT Counter | 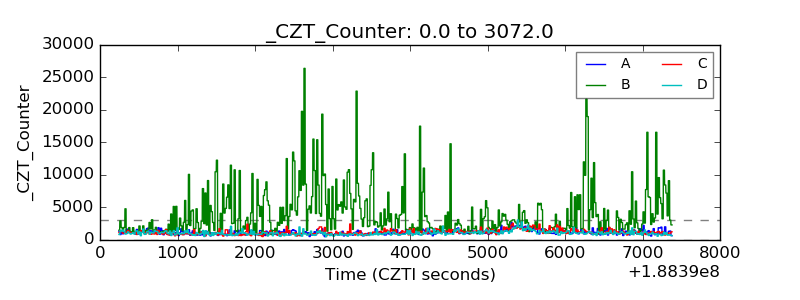 |
| +2.5 Volts monitor |  |
| +5 Volts monitor | 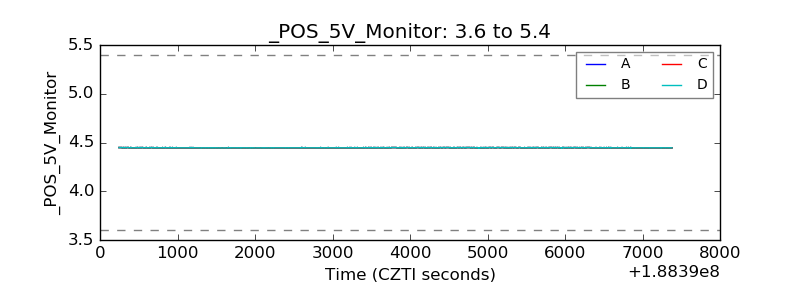 |
| _ROLL_ROT | 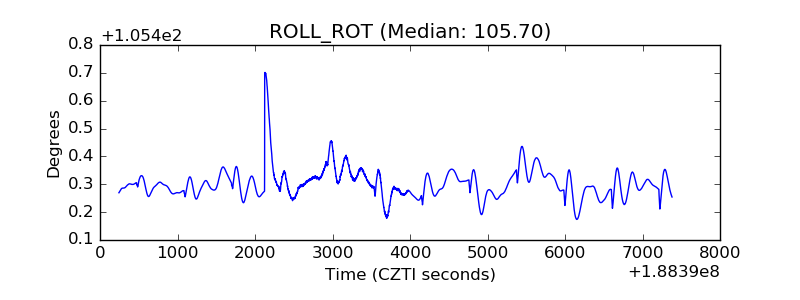 |
| _Roll_DEC | 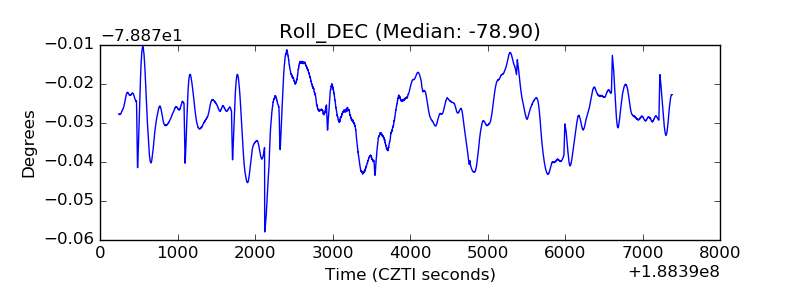 |
| _Roll_RA |  |
| Veto Counter | 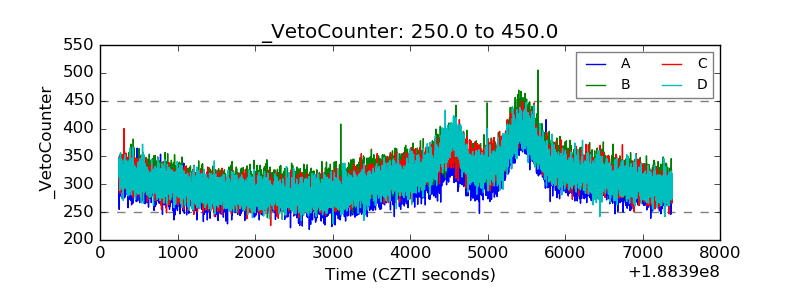 |