| Param | Original file | Final file |
|---|---|---|
| Filename | modeM0/AS1G04_011T02_9000000226_01250cztM0_level2.evt | modeM0/AS1G04_011T02_9000000226_01250cztM0_level2_quad_clean.evt |
| Size (bytes) | 1,383,586,560 | 99,475,200 |
| Size | 1.3 GB | 94.9 MB |
| Events in quadrant A | 8,619,138 | 683,236 |
| Events in quadrant B | 16,006,380 | 509,350 |
| Events in quadrant C | 8,607,463 | 671,605 |
| Events in quadrant D | 8,205,237 | 657,522 |
| Mode SS | |||
|---|---|---|---|
| Quadrant | BADHDUFLAG | Total packets | Discarded packets |
| A | 0 | 140 | 0 |
| B | 0 | 140 | 0 |
| C | 0 | 140 | 0 |
| D | 0 | 140 | 0 |
| Mode M0 | |||
|---|---|---|---|
| Quadrant | BADHDUFLAG | Total packets | Discarded packets |
| A | 0 | 30582 | 1 |
| B | 0 | 52914 | 0 |
| C | 0 | 30556 | 0 |
| D | 0 | 29383 | 0 |
| Quadrant | Total seconds | Saturated seconds | Saturation percentage |
|---|---|---|---|
| A | 7028 | 19 | 0.270347% |
| B | 7028 | 2847 | 40.509391% |
| C | 7028 | 9 | 0.128059% |
| D | 7028 | 126 | 1.792829% |
Noise dominated data is calculated using 1-second bins in cleaned event files. If a bin has >2000 counts, and if more than 50% of those come from <1% of pixels, then it is considered to be noise-dominated and hence unusable.
| Quadrant | # 1 sec bins | Bins with >0 counts | Bins with >2000 counts | High rate bins dominated by noise | Noise dominated (total time) | Noise dominated (detector-on time) | Marked lightcurve |
|---|---|---|---|---|---|---|---|
| A | 7027 | 7027 | 361 | 361 | 5.14% | 5.14% | 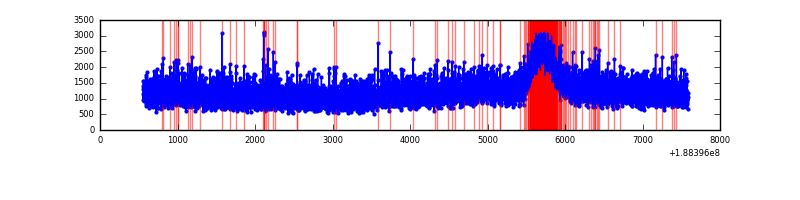 |
| B | 7028 | 7028 | 4095 | 4095 | 58.27% | 58.27% | 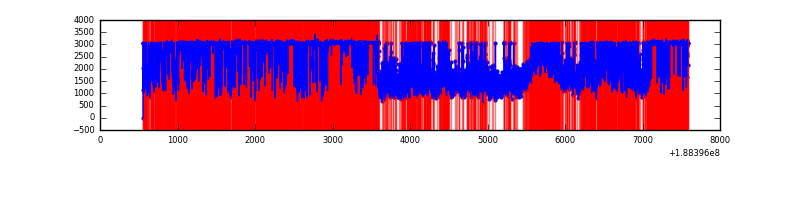 |
| C | 7028 | 7028 | 341 | 341 | 4.85% | 4.85% |  |
| D | 7027 | 7027 | 413 | 413 | 5.88% | 5.88% | 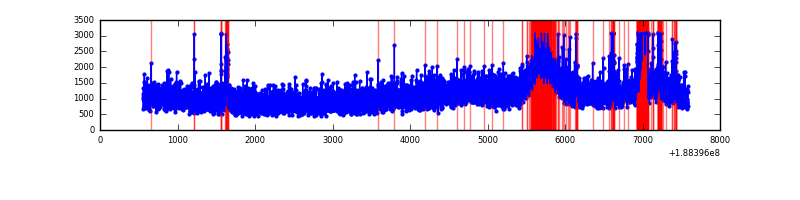 |
Top three noisy pixels from each quadrant. If the there are fewer than three noisy pixels in the level2.evt file, extra rows are filled as -1
| Pixel properties | Quadrant properties | ||||||
|---|---|---|---|---|---|---|---|
| Quadrant | DetID | PixID | Counts | Sigma | Mean | Median | Sigma |
| A | 12 | 243 | 29158 | 50.05 | 2224 | 2240 | 537.8 |
| A | 0 | 51 | 20597 | 34.13 | 2224 | 2240 | 537.8 |
| A | 0 | 5 | 14511 | 22.82 | 2224 | 2240 | 537.8 |
| B | 2 | 32 | 8183934 | 18612.05 | 1844 | 1848 | 439.6 |
| B | 12 | 52 | 297793 | 673.19 | 1844 | 1848 | 439.6 |
| B | 5 | 191 | 224667 | 506.85 | 1844 | 1848 | 439.6 |
| C | 15 | 241 | 333511 | 572.04 | 2066 | 2142 | 579.3 |
| C | 5 | 234 | 98426 | 166.22 | 2066 | 2142 | 579.3 |
| C | 3 | 79 | 56706 | 94.19 | 2066 | 2142 | 579.3 |
| D | 10 | 84 | 519686 | 833.47 | 2005 | 2077 | 621.0 |
| D | 12 | 22 | 145943 | 231.66 | 2005 | 2077 | 621.0 |
| D | 2 | 107 | 28118 | 41.93 | 2005 | 2077 | 621.0 |
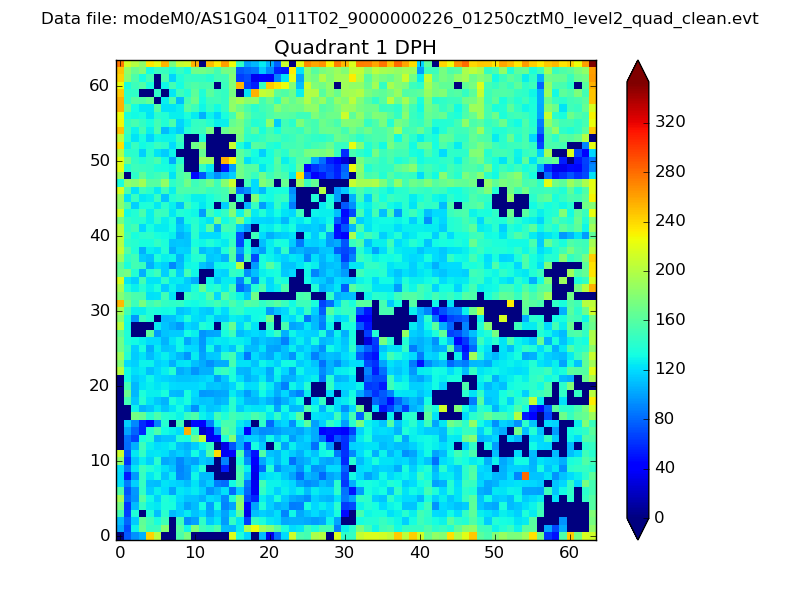
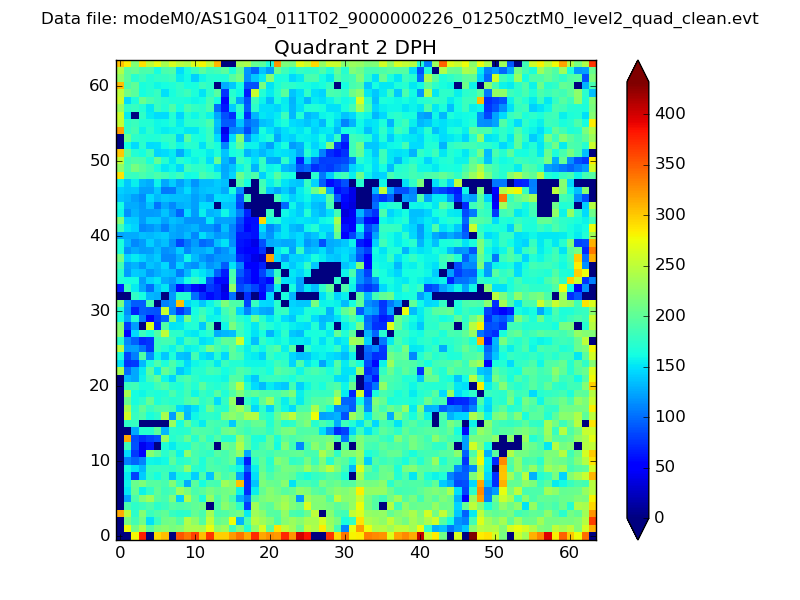
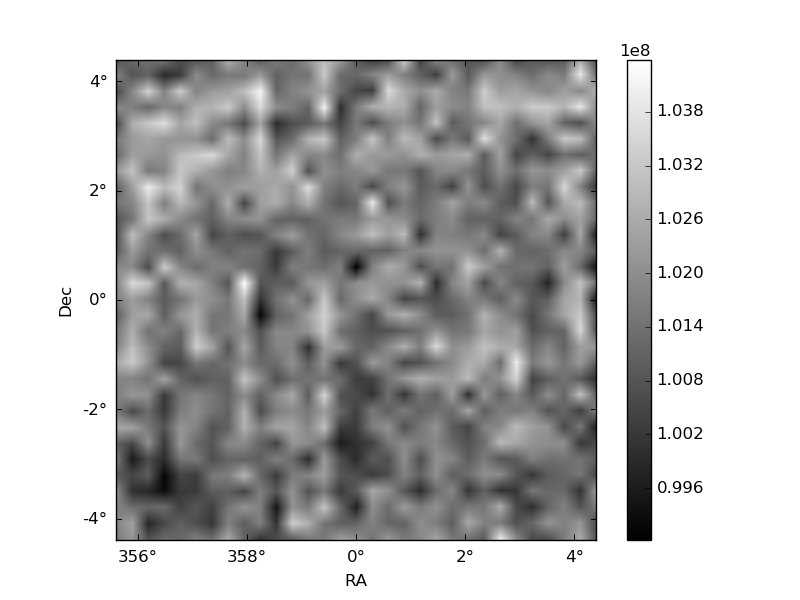
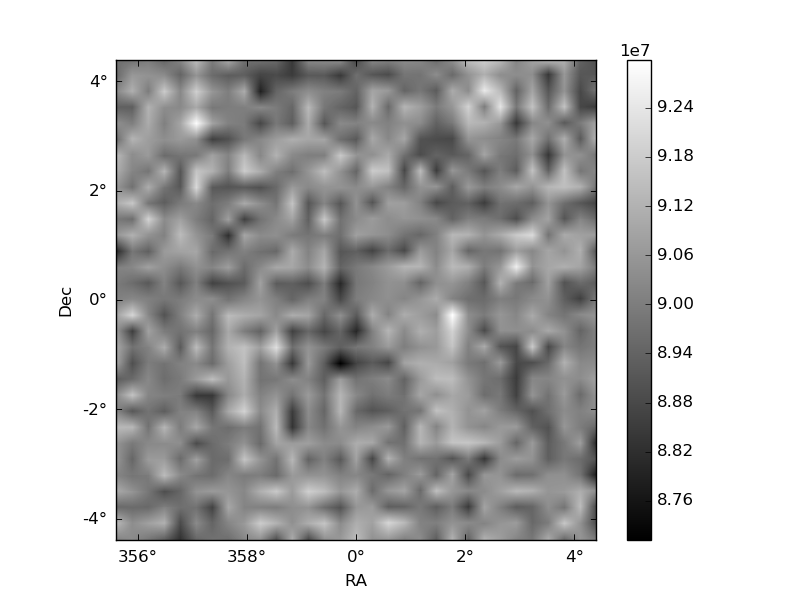
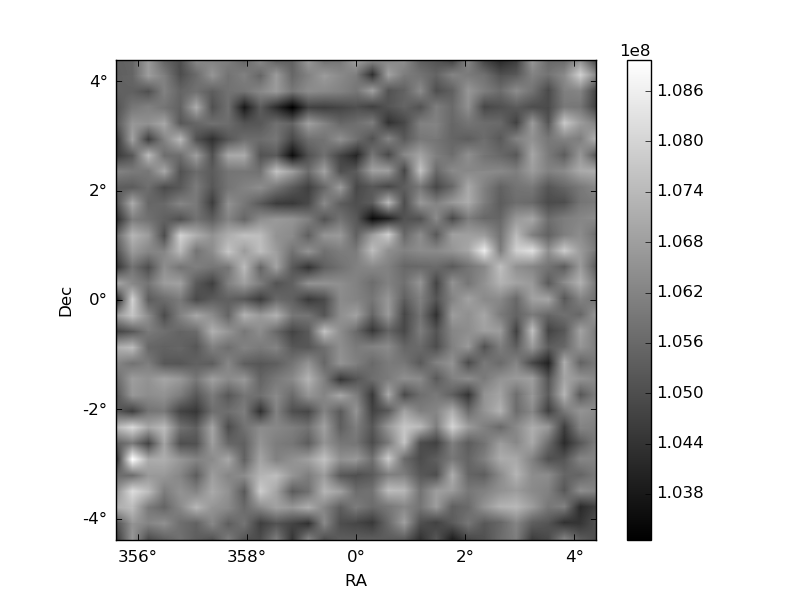
Histogram calculated using DETX and DETY for each event in the final _common_clean file
| Quadrant A |  |
 |
Quadrant B |
|---|---|---|---|
| Quadrant D | 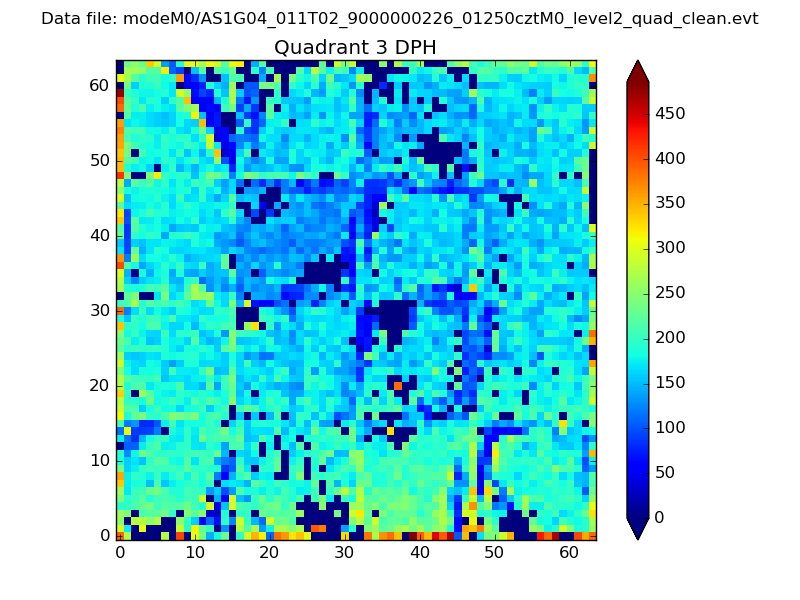 |
 |
Quadrant C |
| Plot type | Count rate plots | Images |
|---|---|---|
| Comparison with Poisson distribution Blue bars denote a histogram of data divided into 1 sec bins. Red curve is a Poisson curve with rate = median count rate of data. |
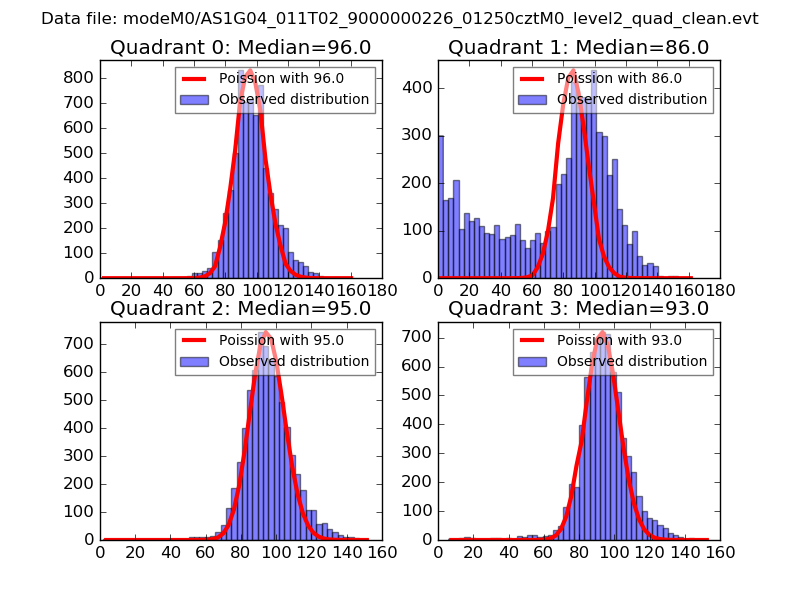 |
 |
| Quadrant-wise count rates Data is divided into 100 sec bins |
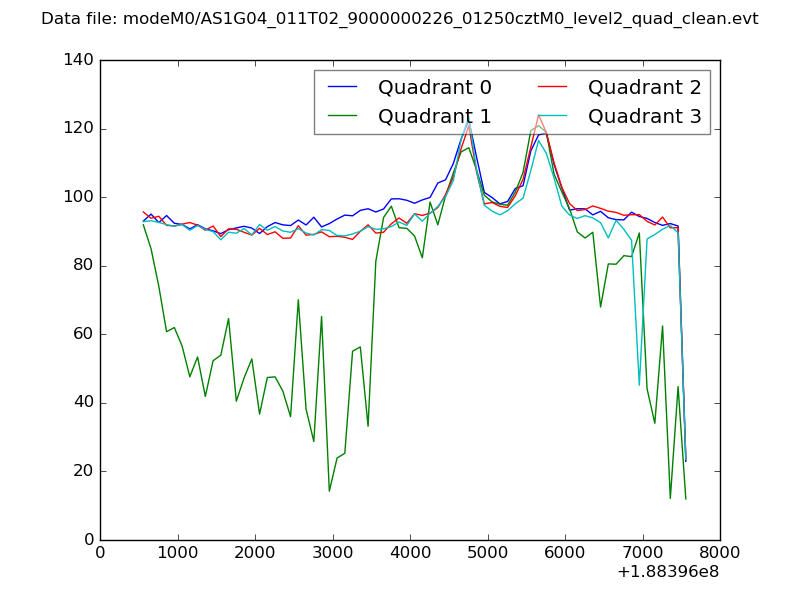 |
|
| Module-wise count rates for Quadrant A Data is divided into 100 sec bins |
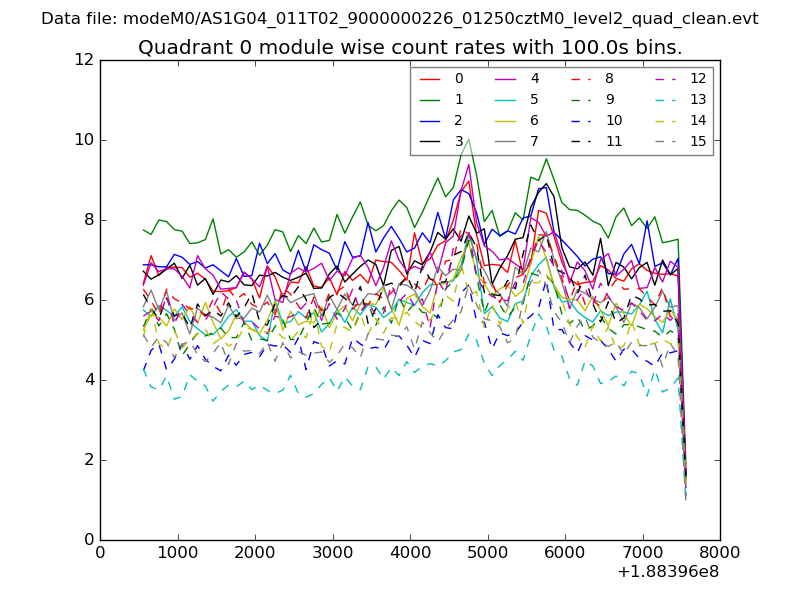 |
 |
| Module-wise count rates for Quadrant B Data is divided into 100 sec bins |
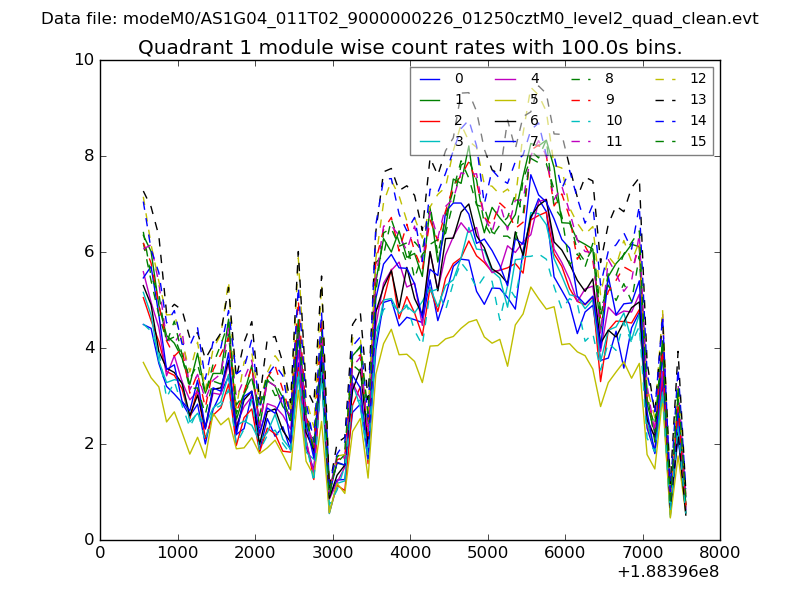 |
 |
| Module-wise count rates for Quadrant C Data is divided into 100 sec bins |
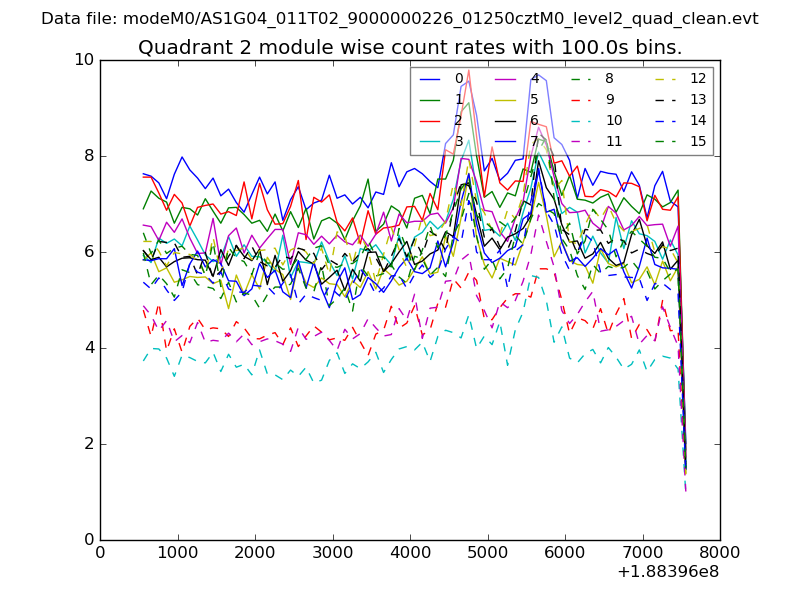 |
 |
| Module-wise count rates for Quadrant D Data is divided into 100 sec bins |
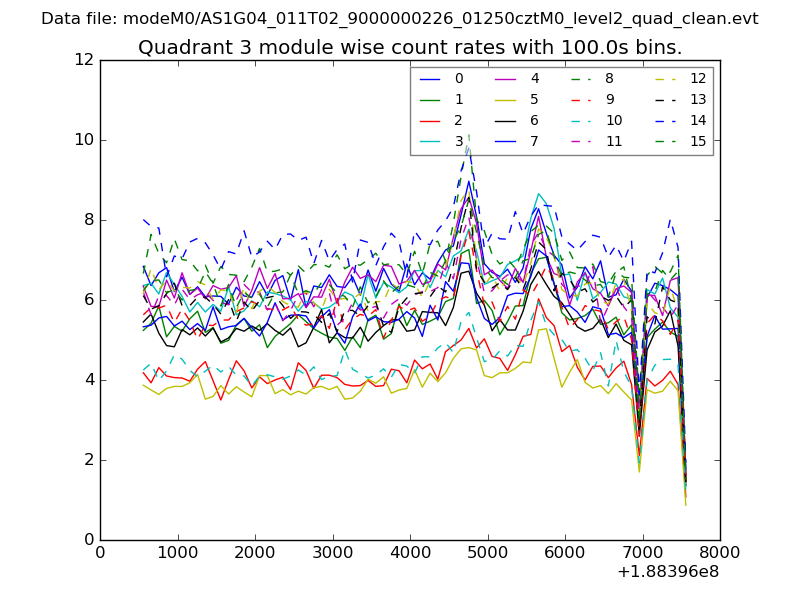 |
 |
| Parameter | Plot |
|---|---|
| CZT HV Monitor | 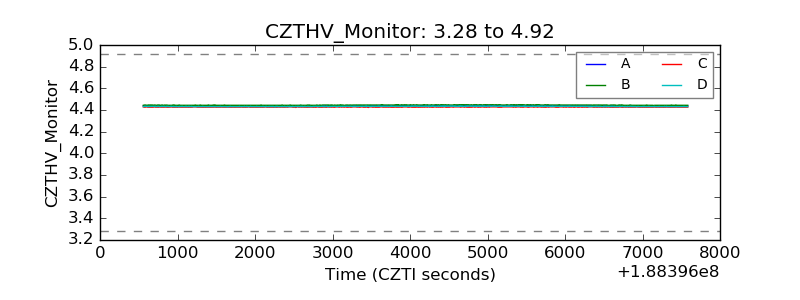 |
| D_VDD | 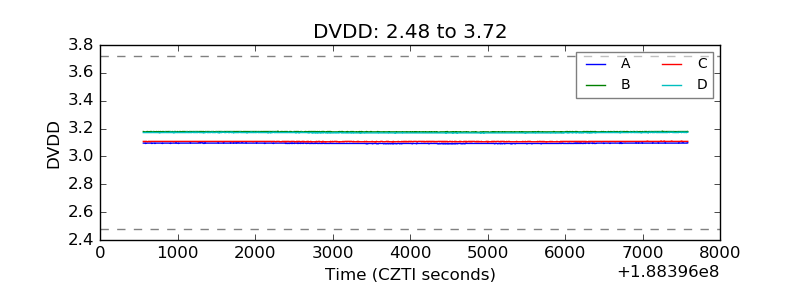 |
| Temperature 1 | 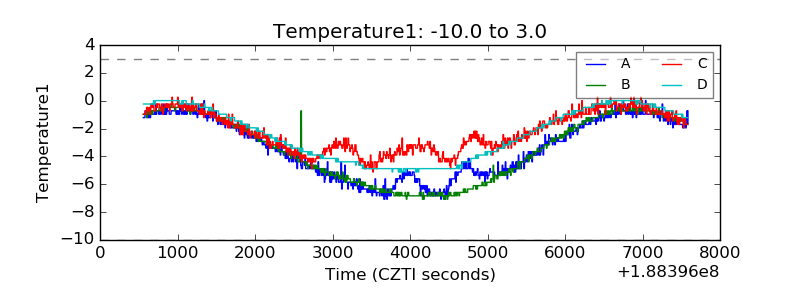 |
| Veto HV Monitor | 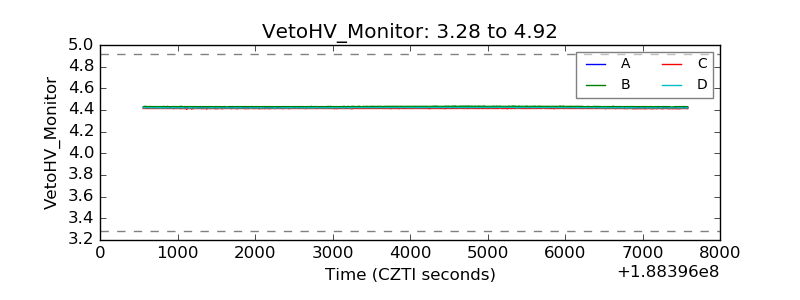 |
| Veto LLD | 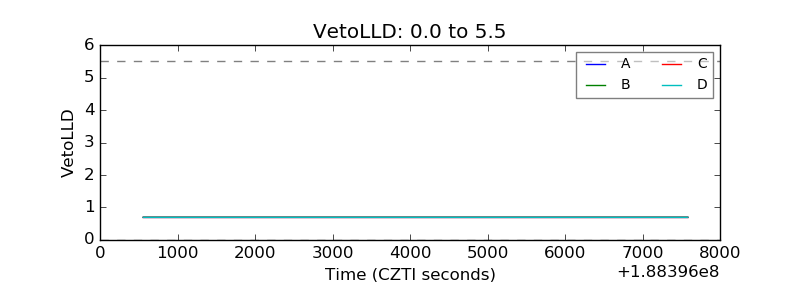 |
| Alpha Counter | 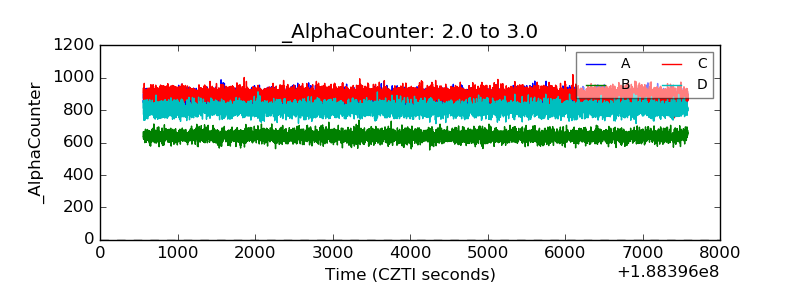 |
| _CPM_Rate | 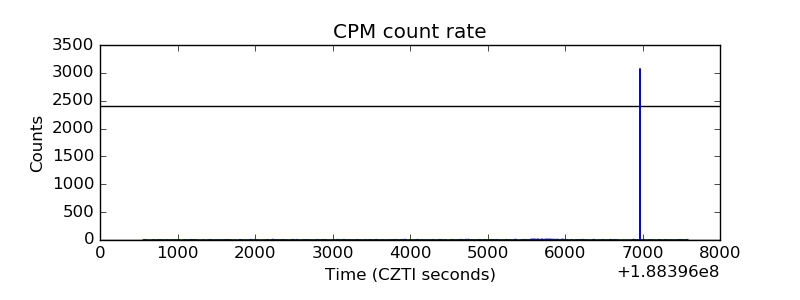 |
| CZT Counter | 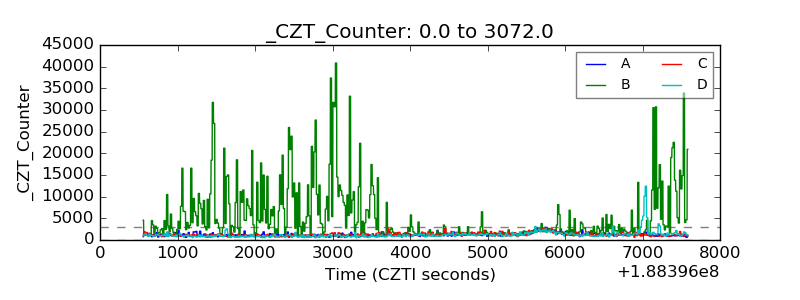 |
| +2.5 Volts monitor |  |
| +5 Volts monitor |  |
| _ROLL_ROT | 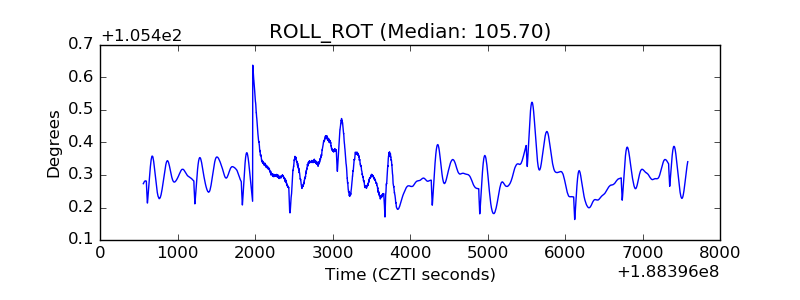 |
| _Roll_DEC | 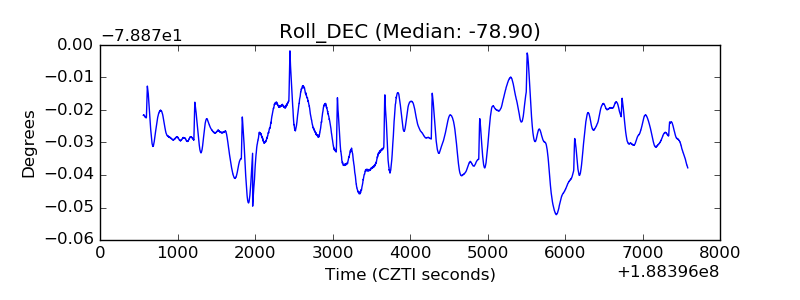 |
| _Roll_RA | 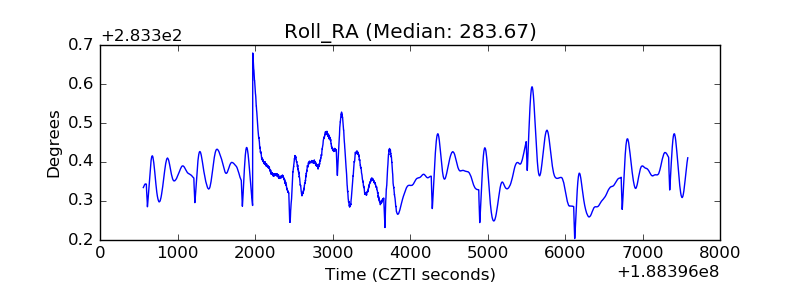 |
| Veto Counter | 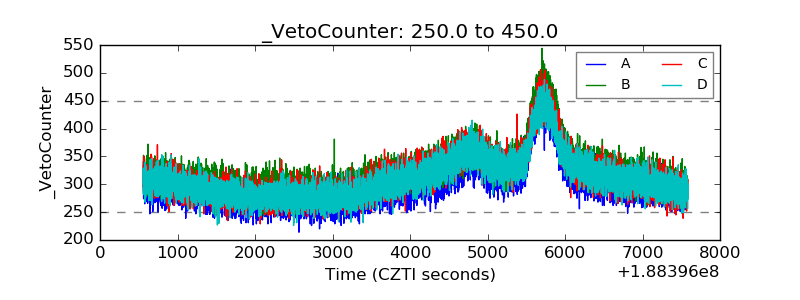 |