| Param | Original file | Final file |
|---|---|---|
| Filename | modeM0/AS1G04_011T02_9000000226_01251cztM0_level2.evt | modeM0/AS1G04_011T02_9000000226_01251cztM0_level2_quad_clean.evt |
| Size (bytes) | 1,311,321,600 | 92,718,720 |
| Size | 1.2 GB | 88.4 MB |
| Events in quadrant A | 8,195,826 | 635,480 |
| Events in quadrant B | 14,013,515 | 503,170 |
| Events in quadrant C | 7,777,361 | 620,129 |
| Events in quadrant D | 9,293,139 | 589,454 |
| Mode SS | |||
|---|---|---|---|
| Quadrant | BADHDUFLAG | Total packets | Discarded packets |
| A | 0 | 134 | 0 |
| B | 0 | 134 | 0 |
| C | 0 | 134 | 0 |
| D | 0 | 134 | 0 |
| Mode M9 | |||
|---|---|---|---|
| Quadrant | BADHDUFLAG | Total packets | Discarded packets |
| A | 0 | 3 | 0 |
| B | 0 | 3 | 0 |
| C | 0 | 3 | 0 |
| D | 0 | 3 | 0 |
| Mode M0 | |||
|---|---|---|---|
| Quadrant | BADHDUFLAG | Total packets | Discarded packets |
| A | 0 | 29011 | 2 |
| B | 0 | 46668 | 1 |
| C | 0 | 27799 | 1 |
| D | 0 | 32369 | 1 |
| Quadrant | Total seconds | Saturated seconds | Saturation percentage |
|---|---|---|---|
| A | 6570 | 37 | 0.563166% |
| B | 6570 | 2287 | 34.809741% |
| C | 6570 | 18 | 0.273973% |
| D | 6570 | 488 | 7.427702% |
Noise dominated data is calculated using 1-second bins in cleaned event files. If a bin has >2000 counts, and if more than 50% of those come from <1% of pixels, then it is considered to be noise-dominated and hence unusable.
| Quadrant | # 1 sec bins | Bins with >0 counts | Bins with >2000 counts | High rate bins dominated by noise | Noise dominated (total time) | Noise dominated (detector-on time) | Marked lightcurve |
|---|---|---|---|---|---|---|---|
| A | 6924 | 6569 | 365 | 365 | 5.27% | 5.56% | 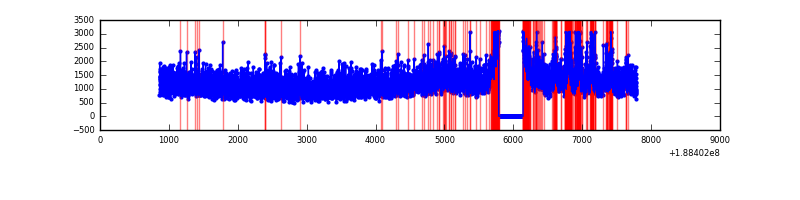 |
| B | 6925 | 6570 | 3324 | 3324 | 48.00% | 50.59% | 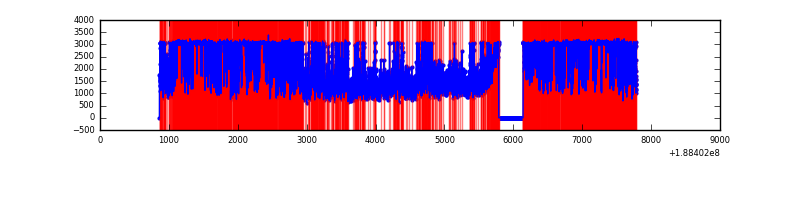 |
| C | 6925 | 6570 | 178 | 178 | 2.57% | 2.71% | 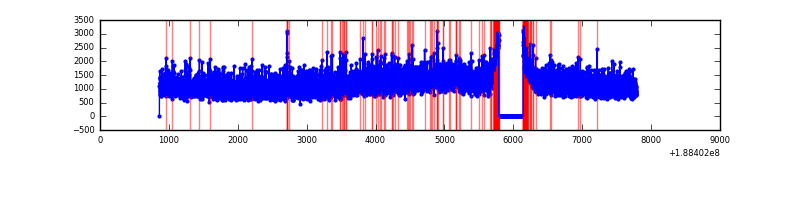 |
| D | 6924 | 6569 | 945 | 945 | 13.65% | 14.39% | 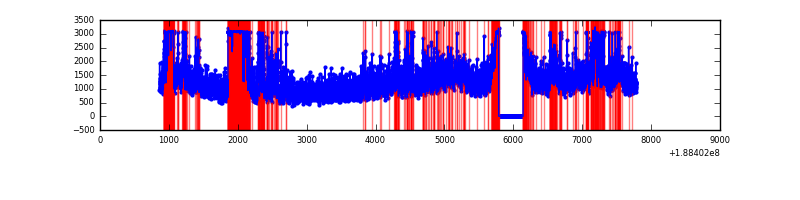 |
Top three noisy pixels from each quadrant. If the there are fewer than three noisy pixels in the level2.evt file, extra rows are filled as -1
| Pixel properties | Quadrant properties | ||||||
|---|---|---|---|---|---|---|---|
| Quadrant | DetID | PixID | Counts | Sigma | Mean | Median | Sigma |
| A | 8 | 14 | 349053 | 712.08 | 2023 | 2039 | 487.3 |
| A | 12 | 243 | 33303 | 64.15 | 2023 | 2039 | 487.3 |
| A | 4 | 32 | 15282 | 27.17 | 2023 | 2039 | 487.3 |
| B | 2 | 32 | 6744072 | 16078.68 | 1765 | 1775 | 419.3 |
| B | 5 | 191 | 197573 | 466.93 | 1765 | 1775 | 419.3 |
| B | 12 | 52 | 114186 | 268.07 | 1765 | 1775 | 419.3 |
| C | 15 | 241 | 301413 | 573.44 | 1875 | 1939 | 522.2 |
| C | 3 | 79 | 50518 | 93.02 | 1875 | 1939 | 522.2 |
| C | 3 | 111 | 32493 | 58.51 | 1875 | 1939 | 522.2 |
| D | 10 | 84 | 1829263 | 3293.85 | 1783 | 1853 | 554.8 |
| D | 12 | 22 | 761290 | 1368.86 | 1783 | 1853 | 554.8 |
| D | 10 | 85 | 18763 | 30.48 | 1783 | 1853 | 554.8 |
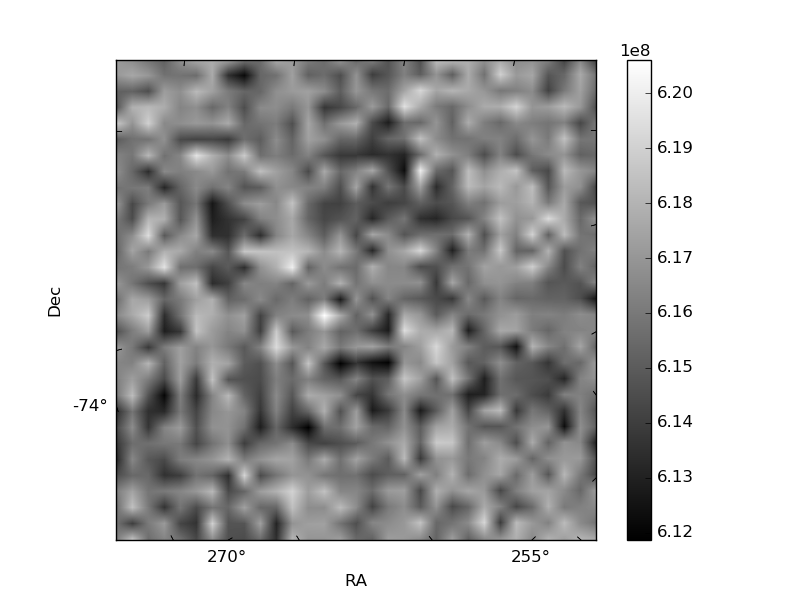
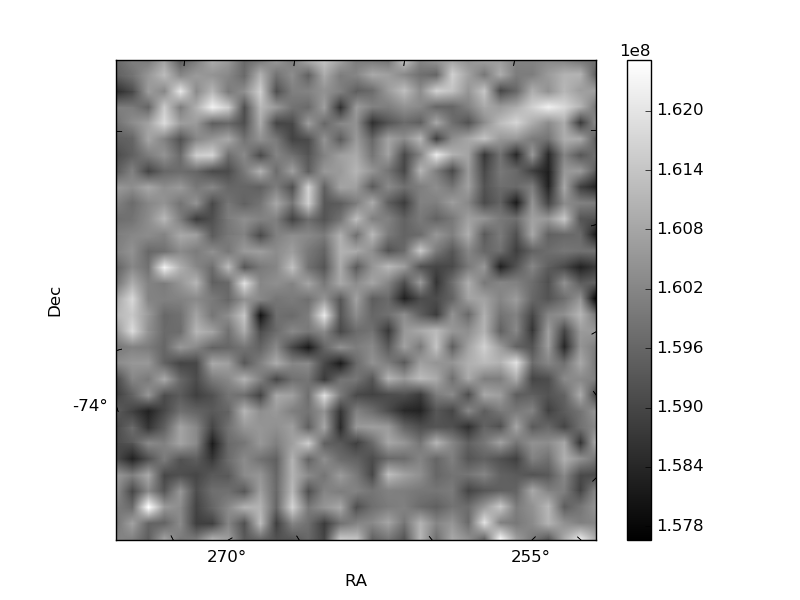
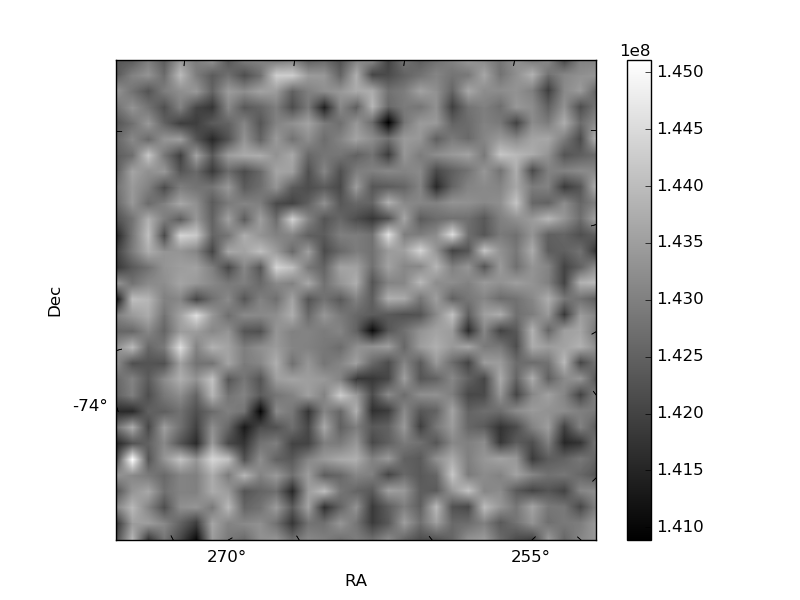
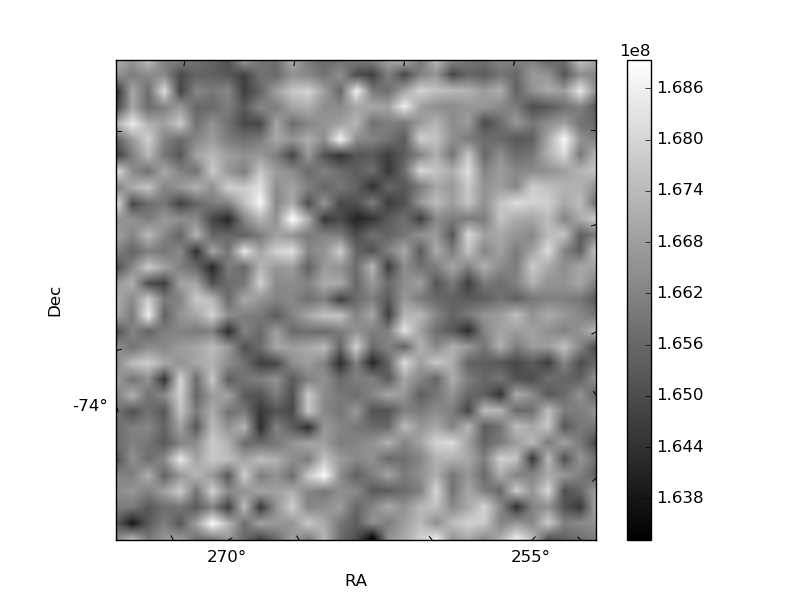
Histogram calculated using DETX and DETY for each event in the final _common_clean file
| Quadrant A | 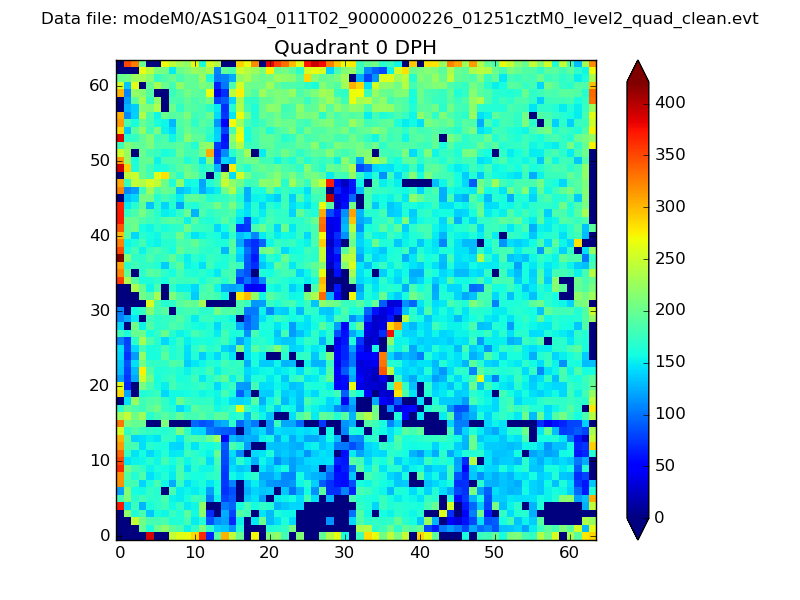 |
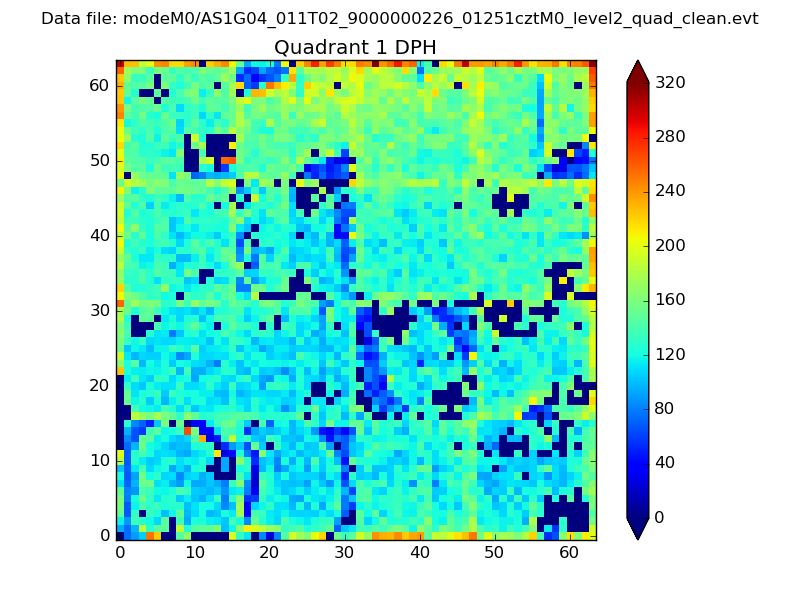 |
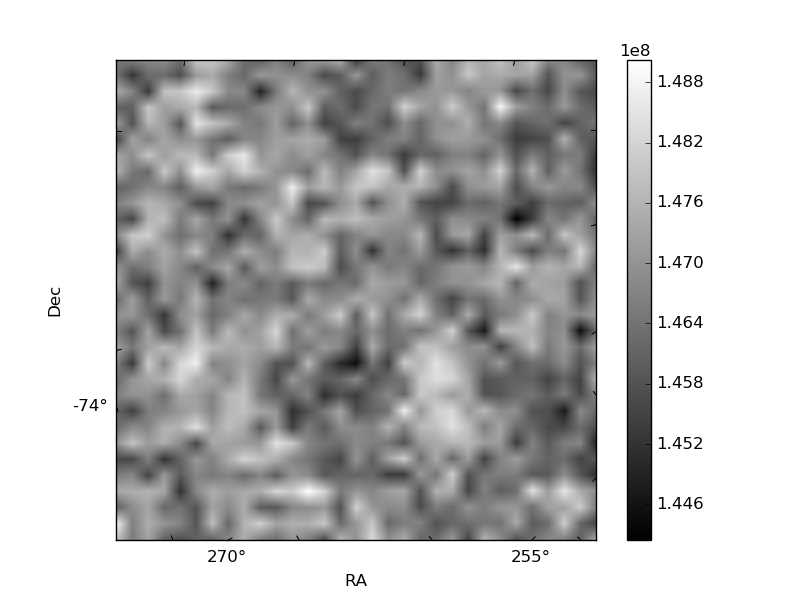
Quadrant B |
|---|---|---|---|
| Quadrant D | 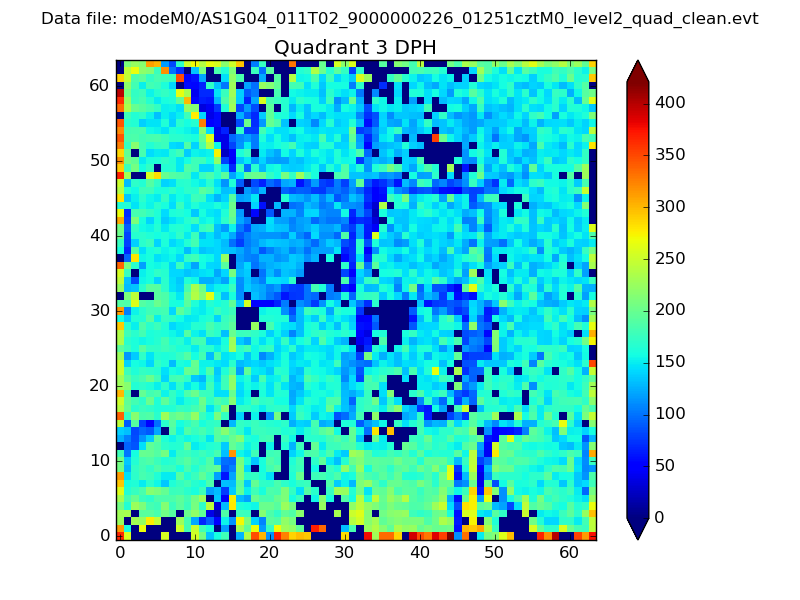 |
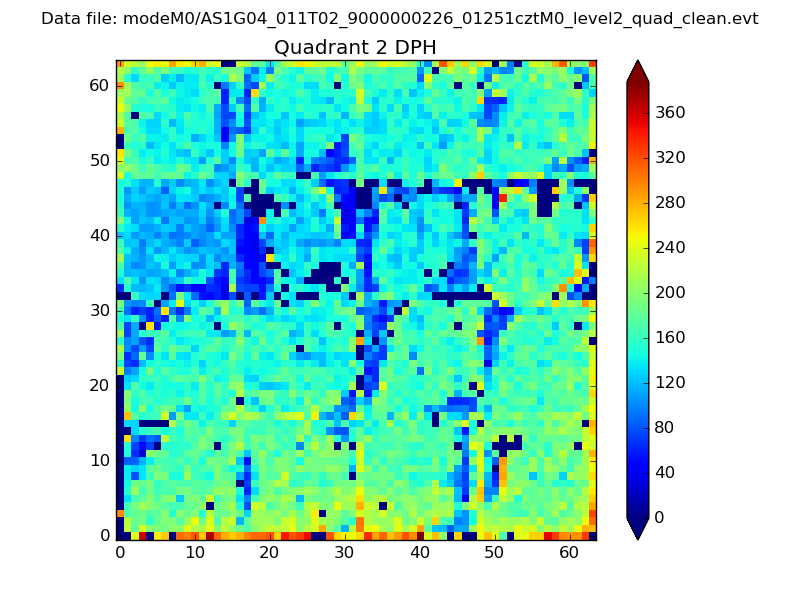 |
Quadrant C |
| Plot type | Count rate plots | Images |
|---|---|---|
| Comparison with Poisson distribution Blue bars denote a histogram of data divided into 1 sec bins. Red curve is a Poisson curve with rate = median count rate of data. |
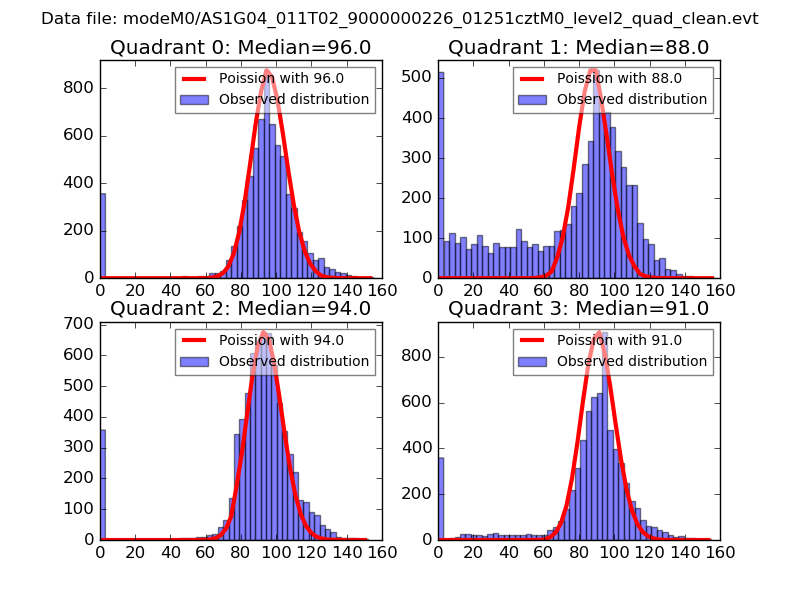 |
 |
| Quadrant-wise count rates Data is divided into 100 sec bins |
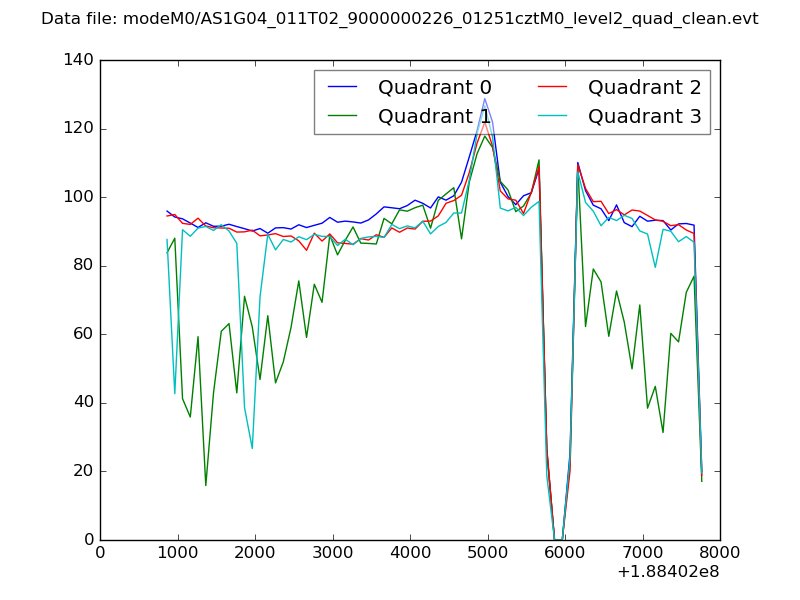 |
|
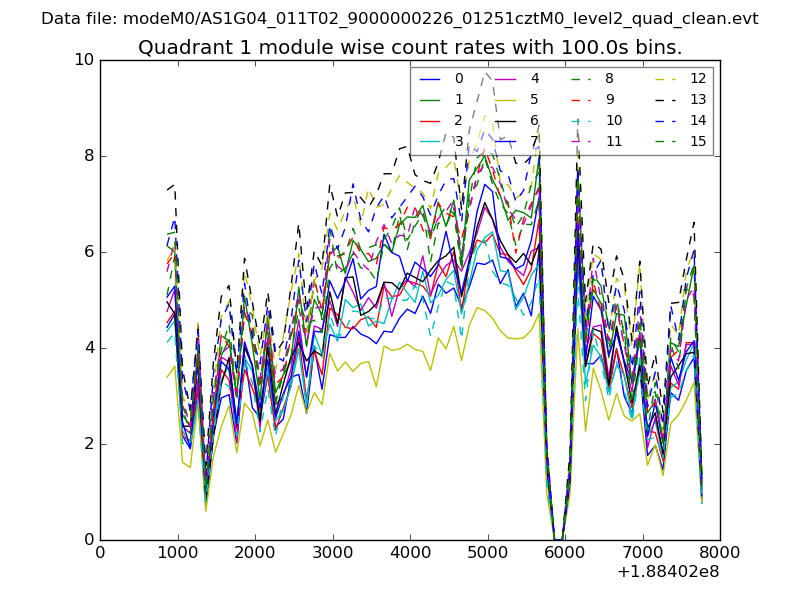
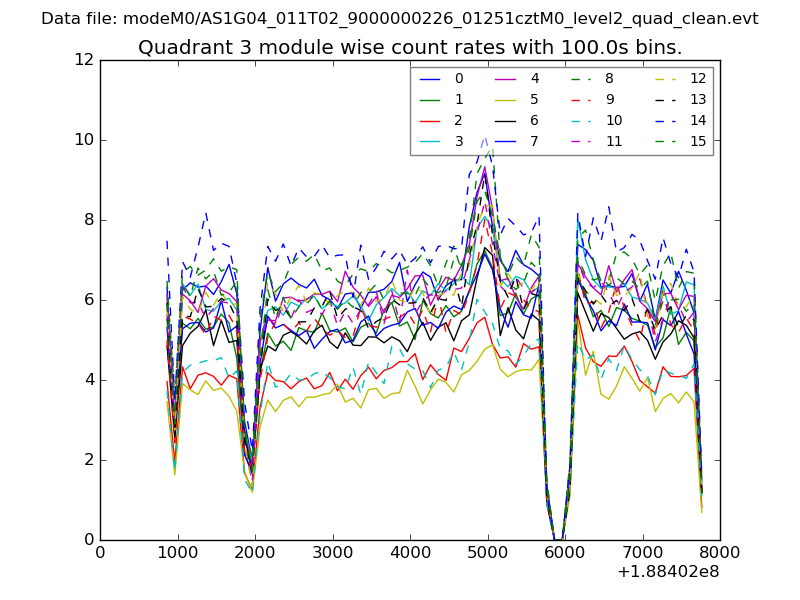
| Module-wise count rates for Quadrant A Data is divided into 100 sec bins |
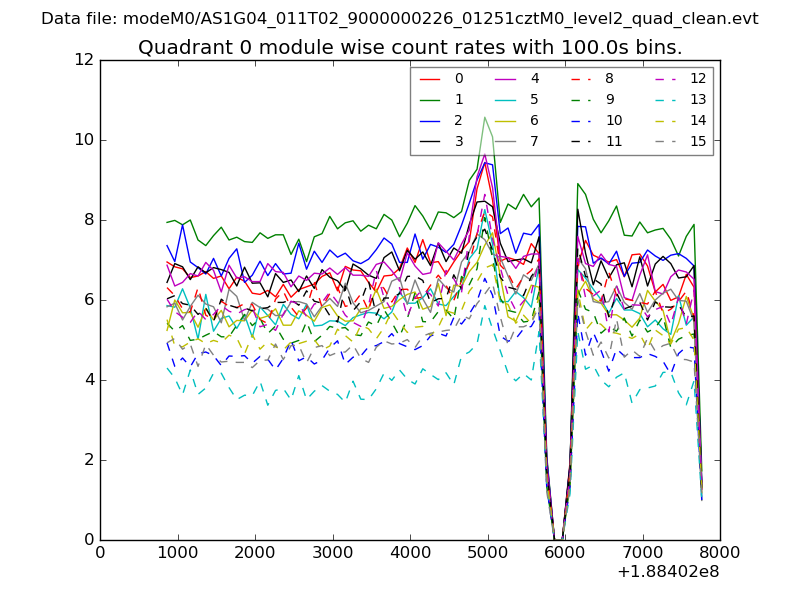 |
 |
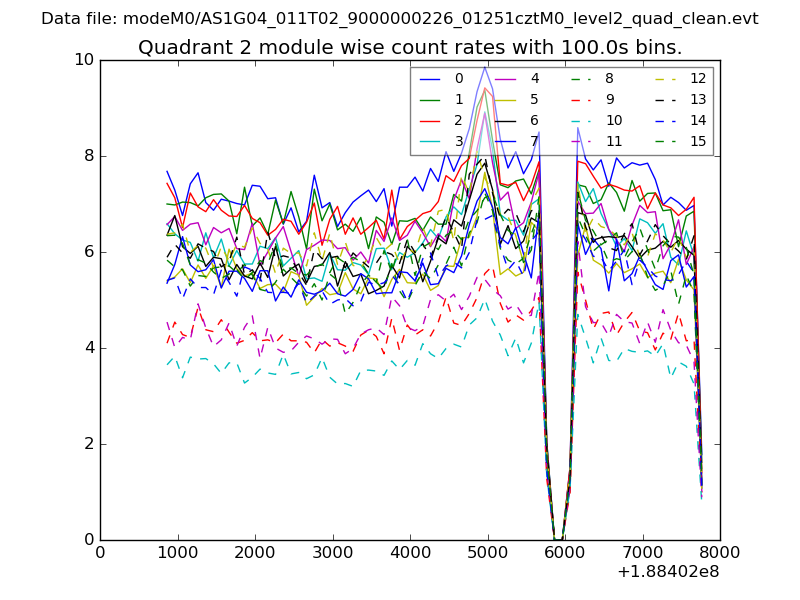
| Module-wise count rates for Quadrant B Data is divided into 100 sec bins |
 |
 |
| Module-wise count rates for Quadrant C Data is divided into 100 sec bins |
 |
 |
| Module-wise count rates for Quadrant D Data is divided into 100 sec bins |
 |
 |
| Parameter | Plot |
|---|---|
| CZT HV Monitor | 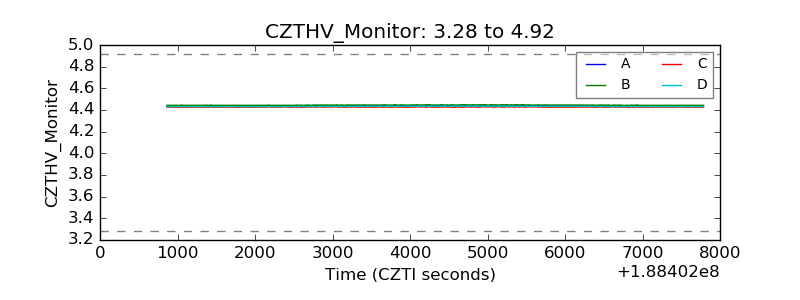 |
| D_VDD | 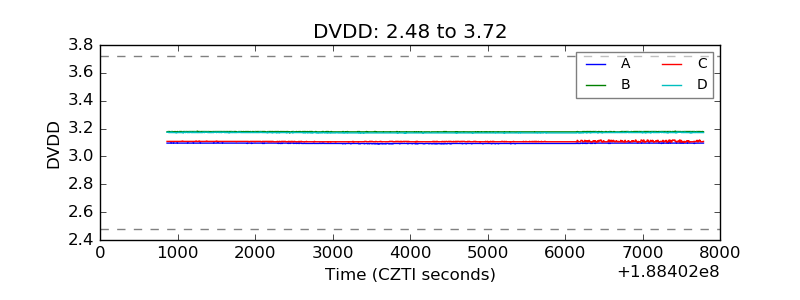 |
| Temperature 1 | 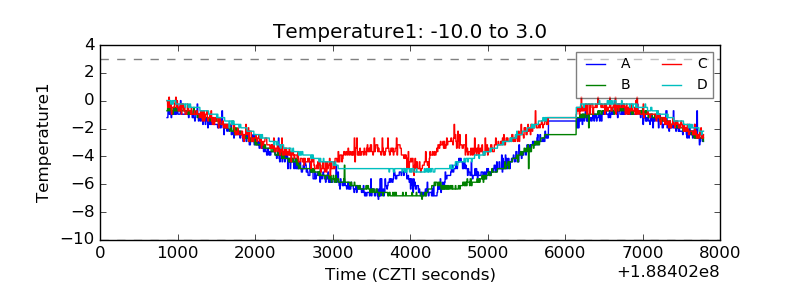 |
| Veto HV Monitor | 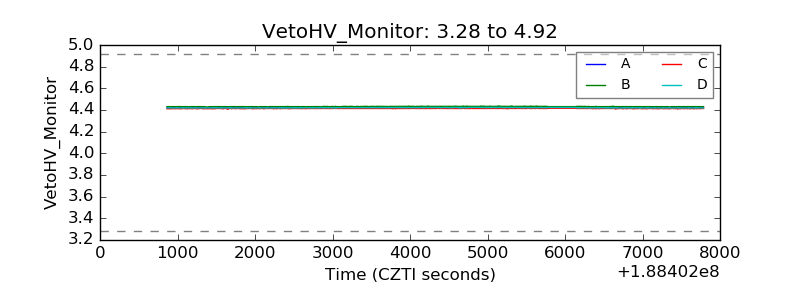 |
| Veto LLD | 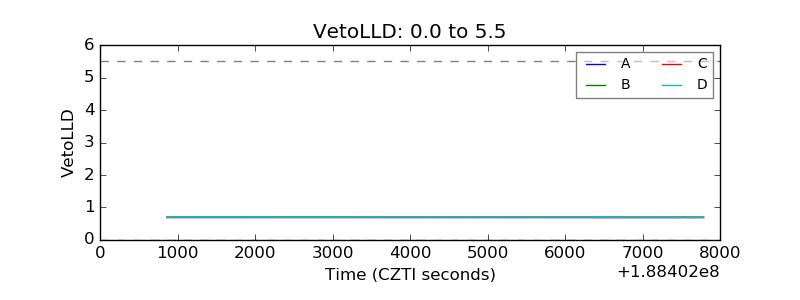 |
| Alpha Counter | 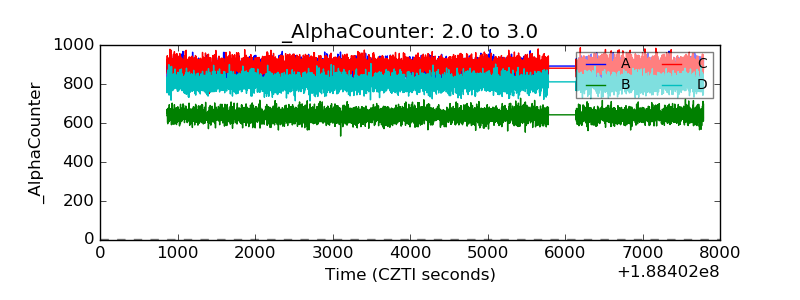 |
| _CPM_Rate | 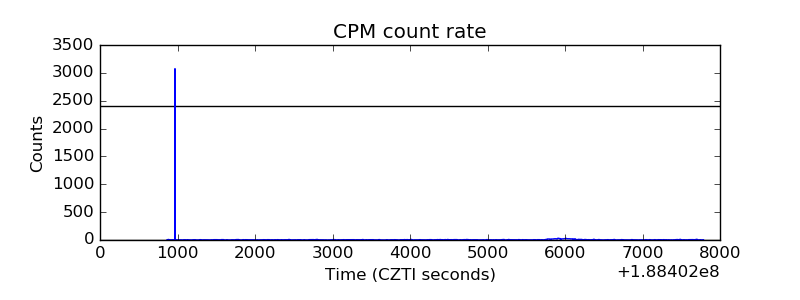 |
| CZT Counter | 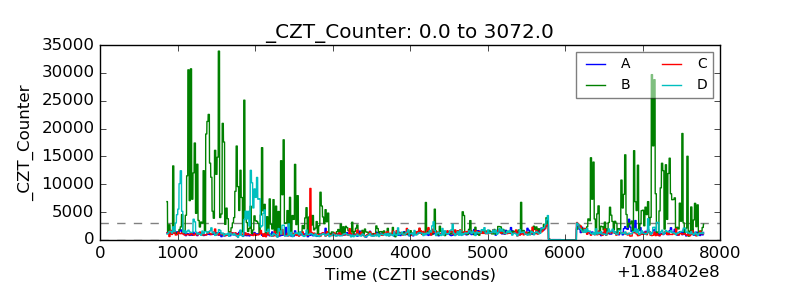 |
| +2.5 Volts monitor | 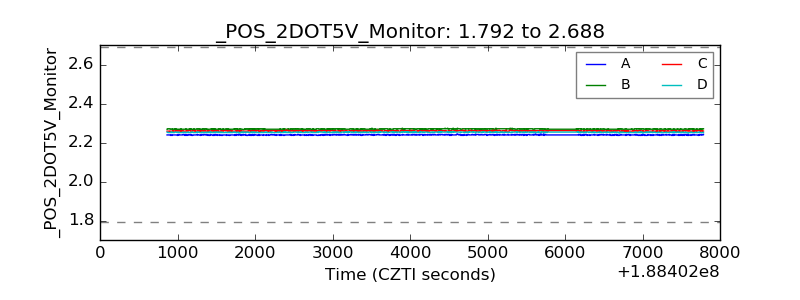 |
| +5 Volts monitor |  |
| _ROLL_ROT | 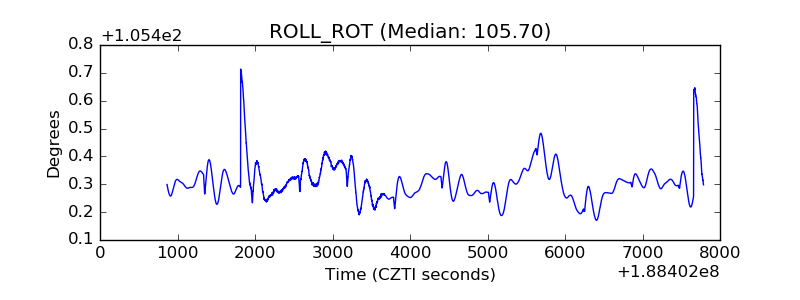 |
| _Roll_DEC | 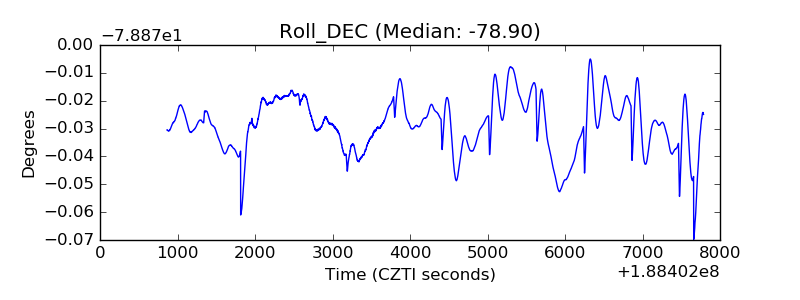 |
| _Roll_RA | 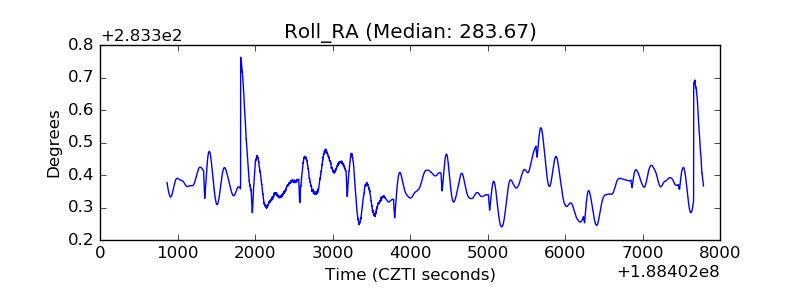 |
| Veto Counter | 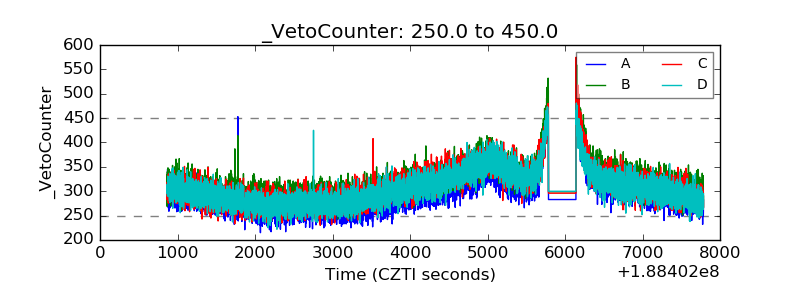 |