| Param | Original file | Final file |
|---|---|---|
| Filename | modeM0/AS1G04_011T02_9000000226_01252cztM0_level2.evt | modeM0/AS1G04_011T02_9000000226_01252cztM0_level2_quad_clean.evt |
| Size (bytes) | 1,294,891,200 | 97,303,680 |
| Size | 1.2 GB | 92.8 MB |
| Events in quadrant A | 8,638,148 | 655,631 |
| Events in quadrant B | 12,665,666 | 569,201 |
| Events in quadrant C | 7,928,413 | 639,447 |
| Events in quadrant D | 9,534,851 | 607,798 |
| Mode SS | |||
|---|---|---|---|
| Quadrant | BADHDUFLAG | Total packets | Discarded packets |
| A | 0 | 138 | 0 |
| B | 0 | 138 | 0 |
| C | 0 | 138 | 0 |
| D | 0 | 138 | 0 |
| Mode M9 | |||
|---|---|---|---|
| Quadrant | BADHDUFLAG | Total packets | Discarded packets |
| A | 0 | 6 | 0 |
| B | 0 | 6 | 0 |
| C | 0 | 6 | 0 |
| D | 0 | 6 | 0 |
| Mode M0 | |||
|---|---|---|---|
| Quadrant | BADHDUFLAG | Total packets | Discarded packets |
| A | 0 | 30499 | 2 |
| B | 0 | 42704 | 1 |
| C | 0 | 28418 | 1 |
| D | 0 | 33206 | 1 |
| Quadrant | Total seconds | Saturated seconds | Saturation percentage |
|---|---|---|---|
| A | 6798 | 58 | 0.853192% |
| B | 6798 | 1529 | 22.491909% |
| C | 6798 | 3 | 0.044131% |
| D | 6798 | 478 | 7.031480% |
Noise dominated data is calculated using 1-second bins in cleaned event files. If a bin has >2000 counts, and if more than 50% of those come from <1% of pixels, then it is considered to be noise-dominated and hence unusable.
| Quadrant | # 1 sec bins | Bins with >0 counts | Bins with >2000 counts | High rate bins dominated by noise | Noise dominated (total time) | Noise dominated (detector-on time) | Marked lightcurve |
|---|---|---|---|---|---|---|---|
| A | 7398 | 6798 | 395 | 395 | 5.34% | 5.81% | 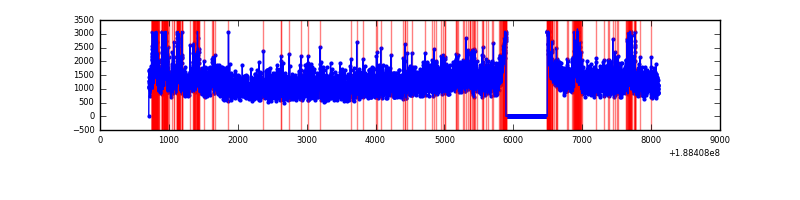 |
| B | 7398 | 6798 | 2396 | 2396 | 32.39% | 35.25% | 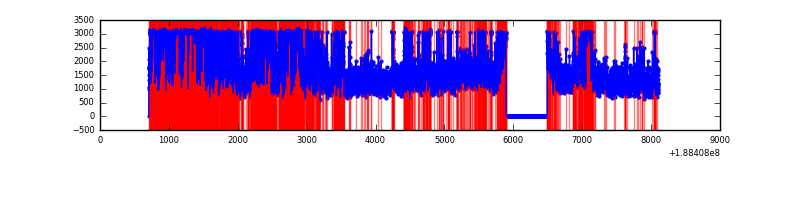 |
| C | 7398 | 6798 | 120 | 120 | 1.62% | 1.77% | 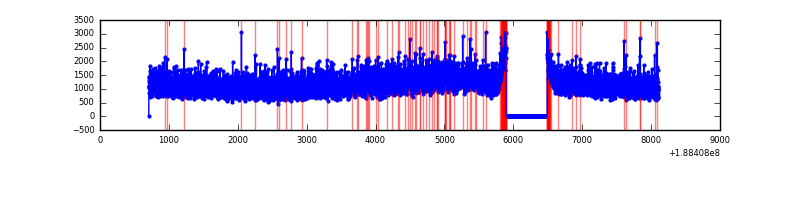 |
| D | 7397 | 6797 | 962 | 962 | 13.01% | 14.15% | 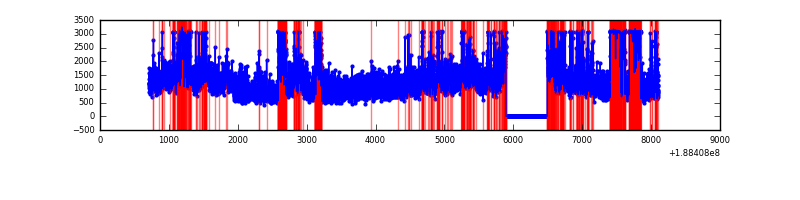 |
Top three noisy pixels from each quadrant. If the there are fewer than three noisy pixels in the level2.evt file, extra rows are filled as -1
| Pixel properties | Quadrant properties | ||||||
|---|---|---|---|---|---|---|---|
| Quadrant | DetID | PixID | Counts | Sigma | Mean | Median | Sigma |
| A | 8 | 14 | 586324 | 1167.38 | 2069 | 2090 | 500.5 |
| A | 8 | 15 | 31408 | 58.58 | 2069 | 2090 | 500.5 |
| A | 12 | 243 | 31072 | 57.91 | 2069 | 2090 | 500.5 |
| B | 2 | 32 | 4438150 | 9576.23 | 1948 | 1955 | 463.3 |
| B | 5 | 191 | 332834 | 714.25 | 1948 | 1955 | 463.3 |
| B | 8 | 4 | 204856 | 437.99 | 1948 | 1955 | 463.3 |
| C | 15 | 241 | 305264 | 564.7 | 1924 | 1988 | 537.1 |
| C | 3 | 79 | 49400 | 88.28 | 1924 | 1988 | 537.1 |
| C | 3 | 111 | 35431 | 62.27 | 1924 | 1988 | 537.1 |
| D | 10 | 84 | 1761374 | 3133.58 | 1808 | 1870 | 561.5 |
| D | 12 | 22 | 384436 | 681.33 | 1808 | 1870 | 561.5 |
| D | 2 | 88 | 295031 | 522.1 | 1808 | 1870 | 561.5 |
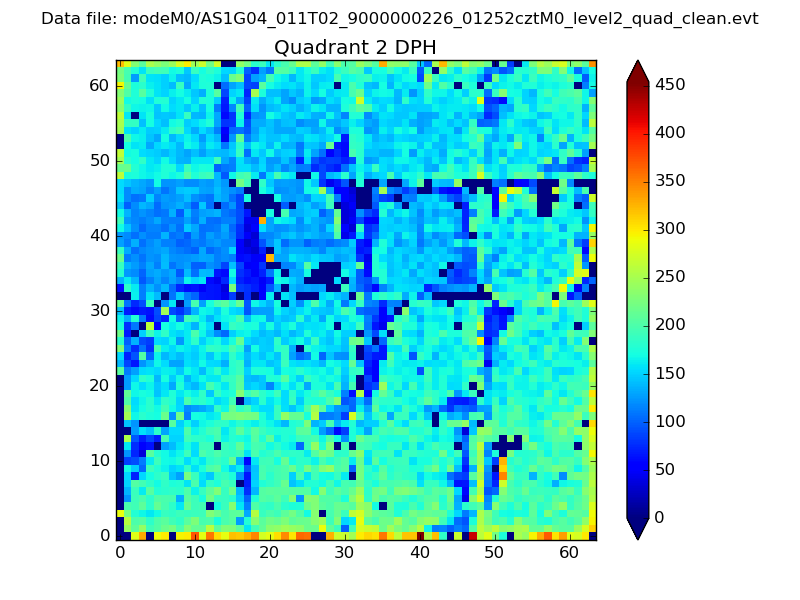
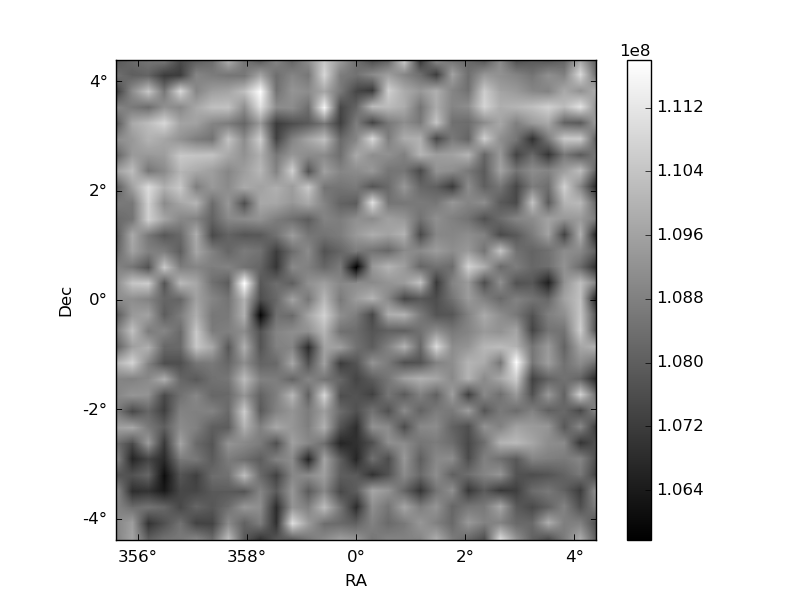
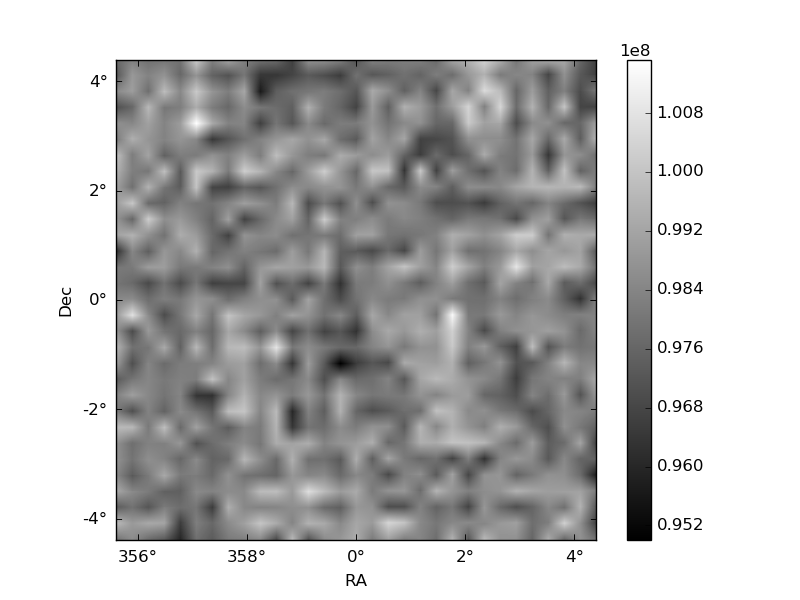
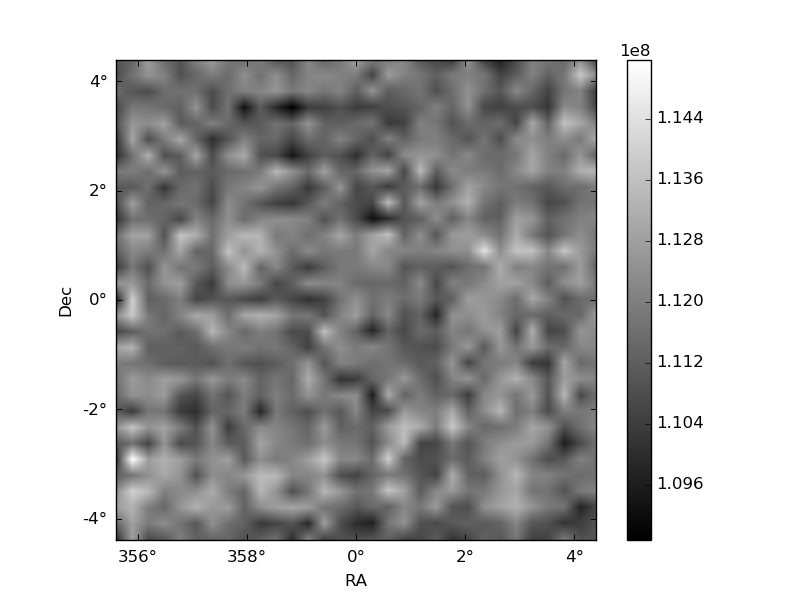
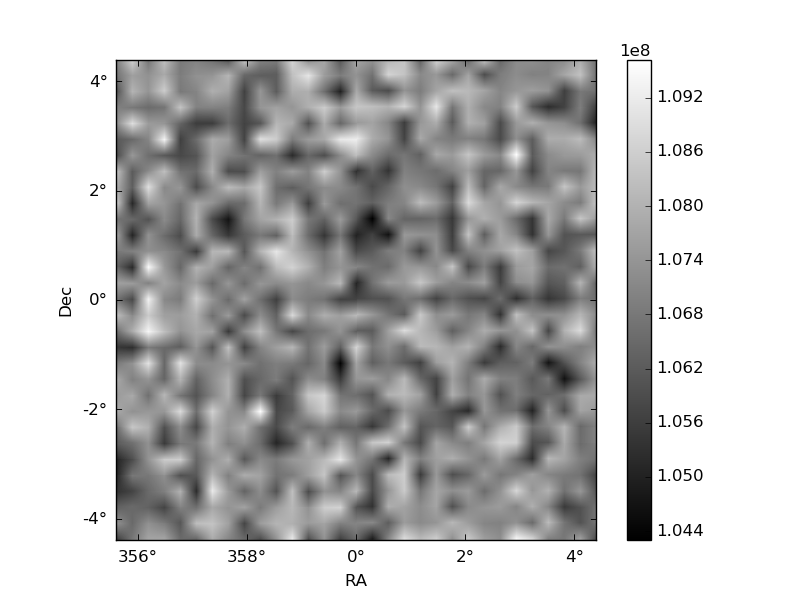
Histogram calculated using DETX and DETY for each event in the final _common_clean file
| Quadrant A | 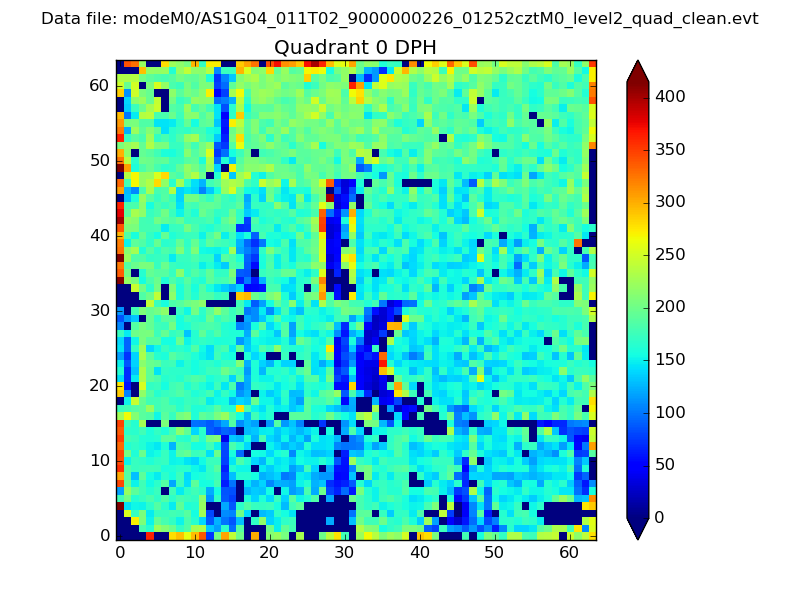 |
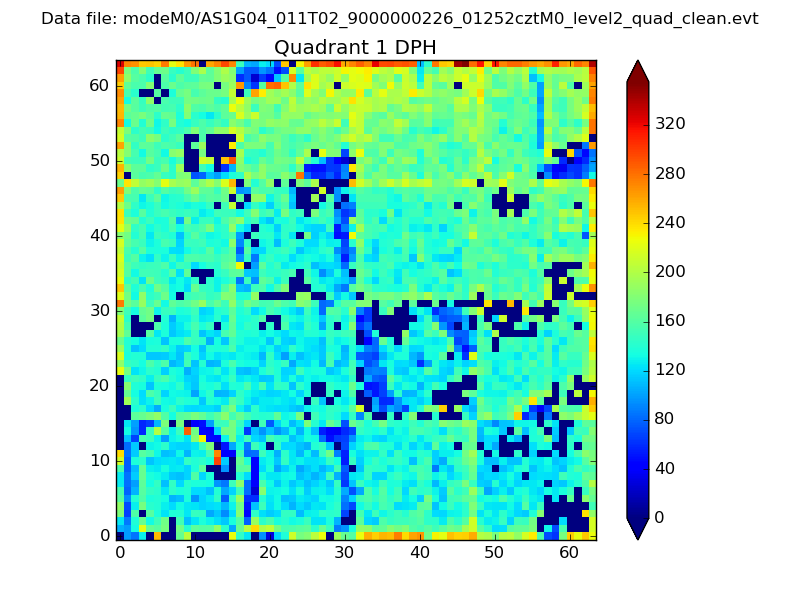 |
Quadrant B |
|---|---|---|---|
| Quadrant D | 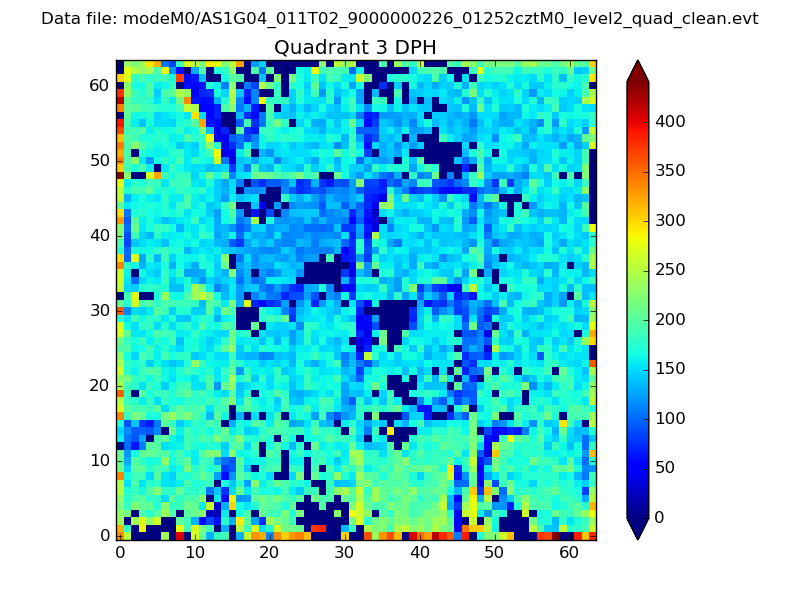 |
 |
Quadrant C |
| Plot type | Count rate plots | Images |
|---|---|---|
| Comparison with Poisson distribution Blue bars denote a histogram of data divided into 1 sec bins. Red curve is a Poisson curve with rate = median count rate of data. |
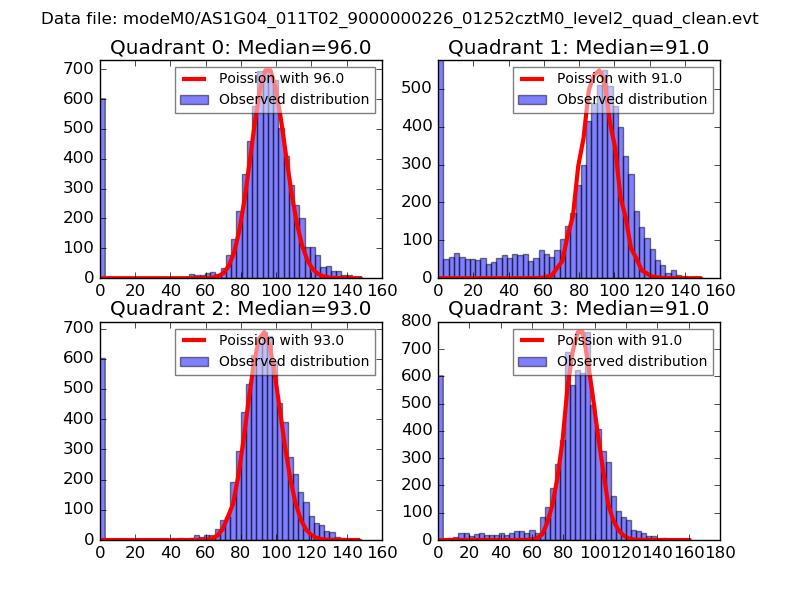 |
 |
| Quadrant-wise count rates Data is divided into 100 sec bins |
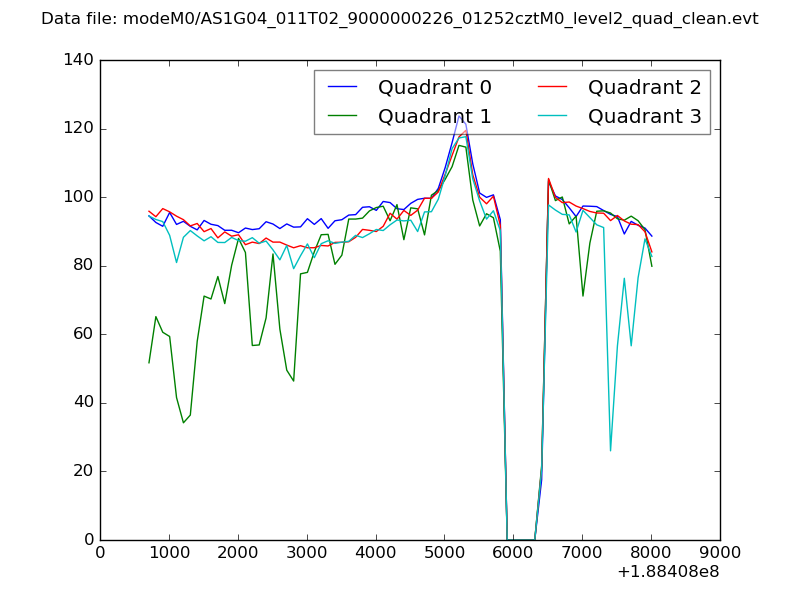 |
|
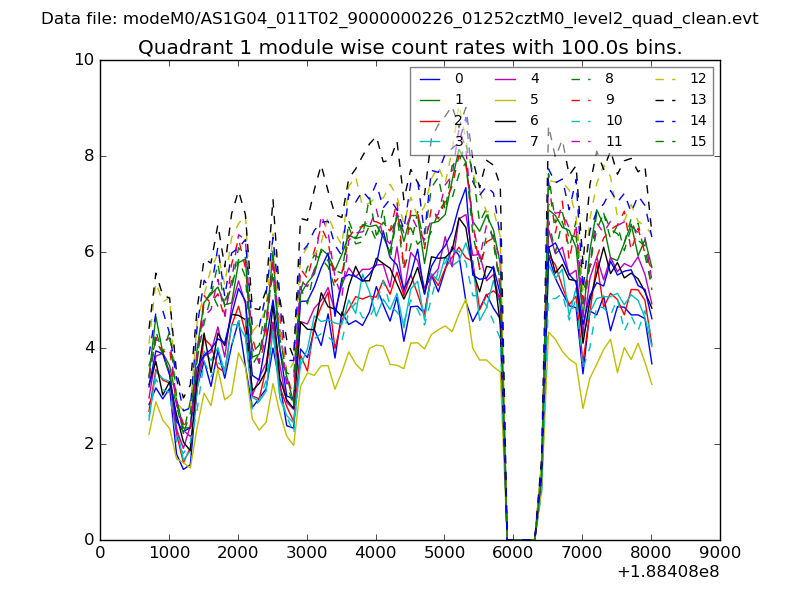
| Module-wise count rates for Quadrant A Data is divided into 100 sec bins |
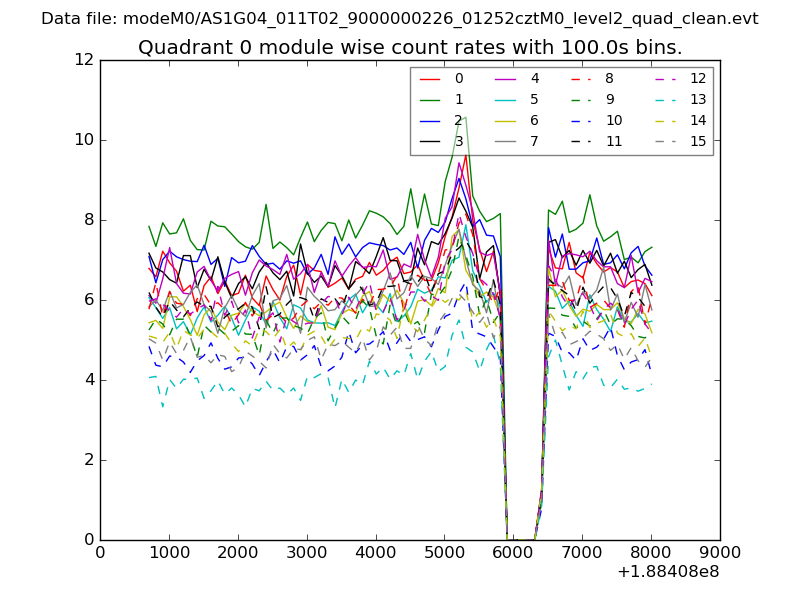 |
 |
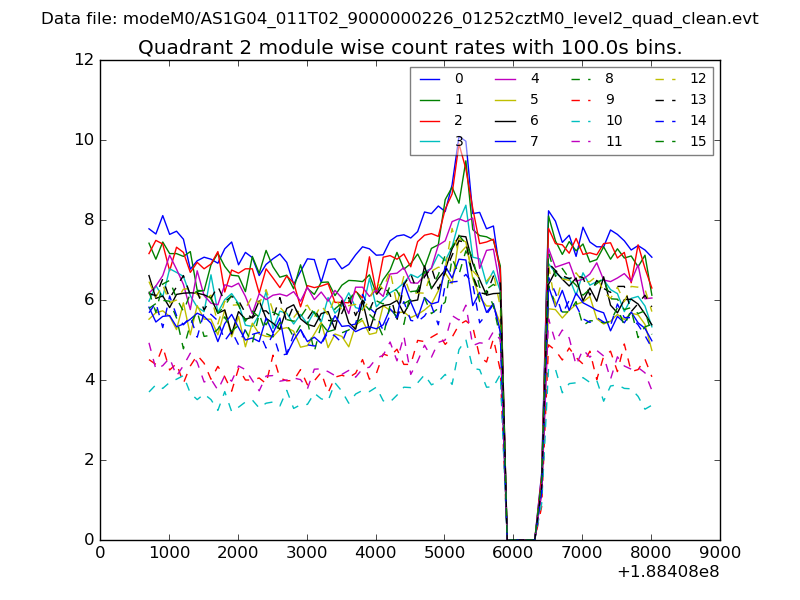
| Module-wise count rates for Quadrant B Data is divided into 100 sec bins |
 |
 |
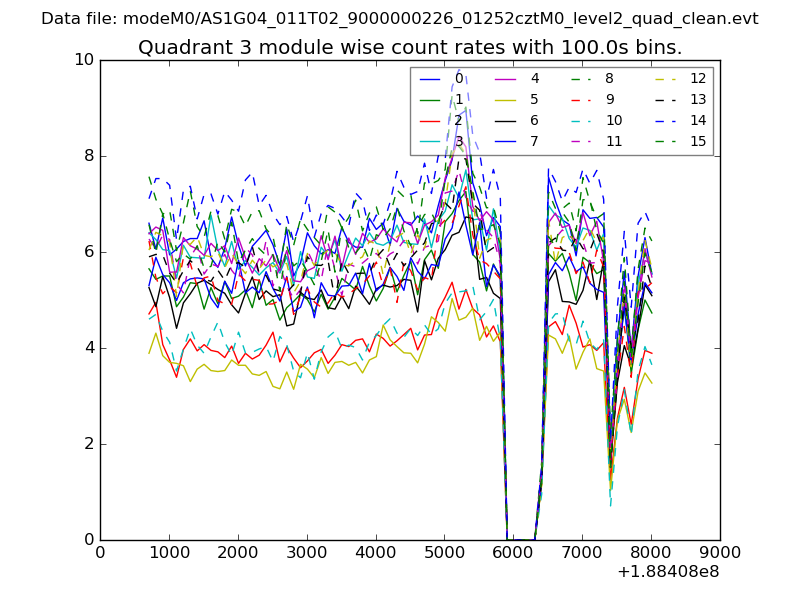
| Module-wise count rates for Quadrant C Data is divided into 100 sec bins |
 |
 |
| Module-wise count rates for Quadrant D Data is divided into 100 sec bins |
 |
 |
| Parameter | Plot |
|---|---|
| CZT HV Monitor | 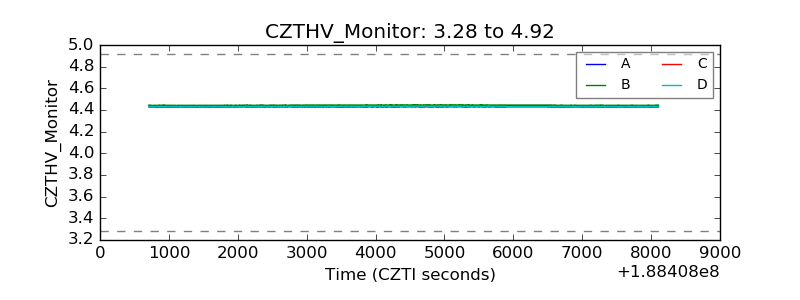 |
| D_VDD | 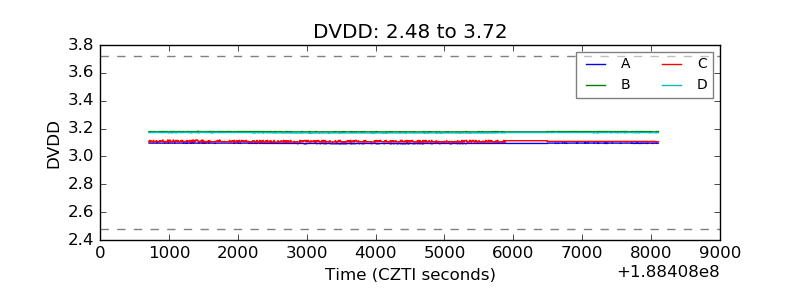 |
| Temperature 1 | 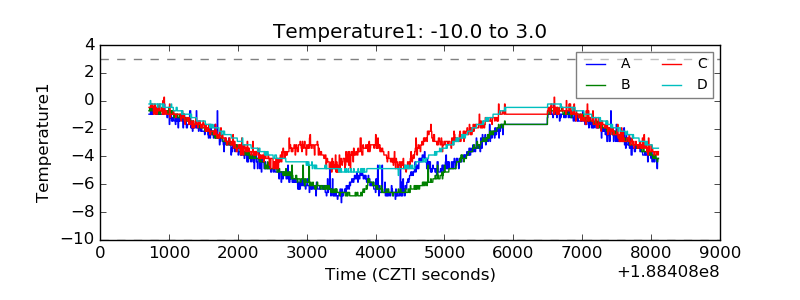 |
| Veto HV Monitor | 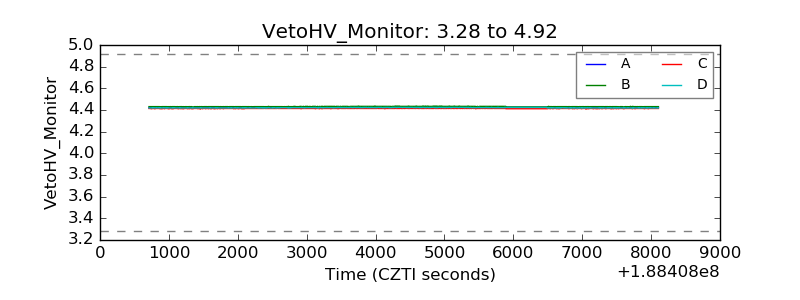 |
| Veto LLD | 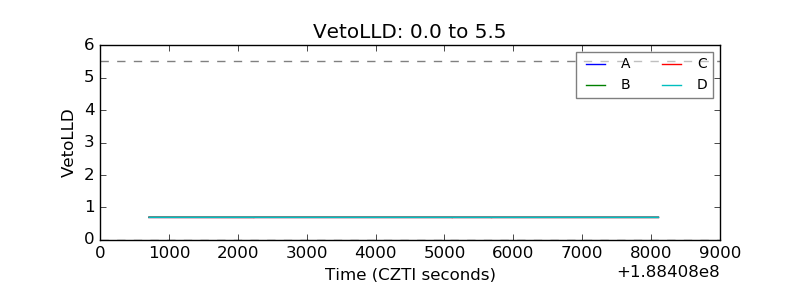 |
| Alpha Counter | 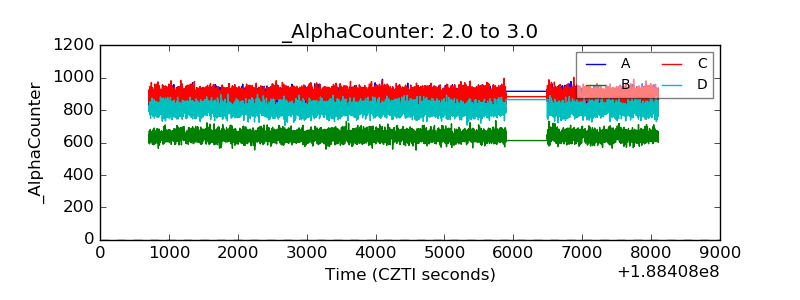 |
| _CPM_Rate | 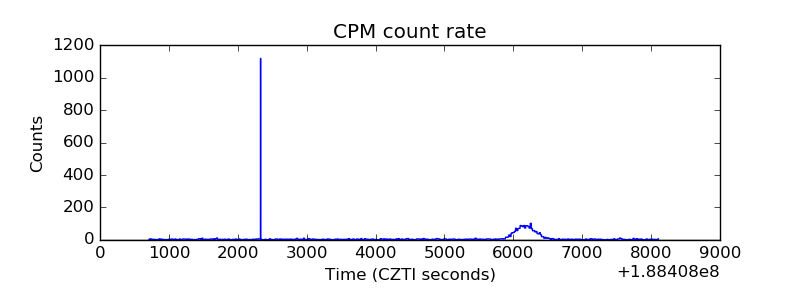 |
| CZT Counter | 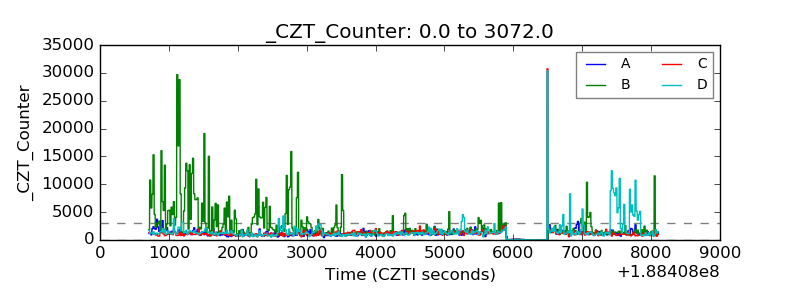 |
| +2.5 Volts monitor | 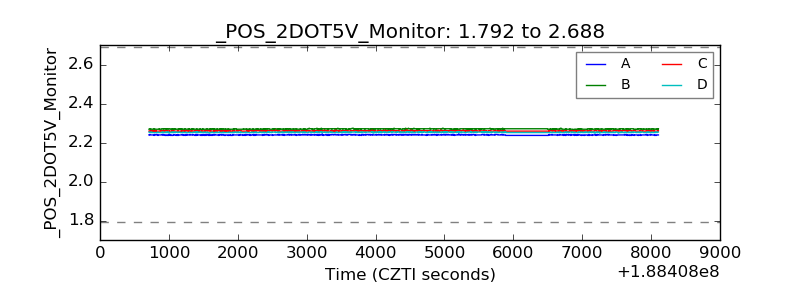 |
| +5 Volts monitor | 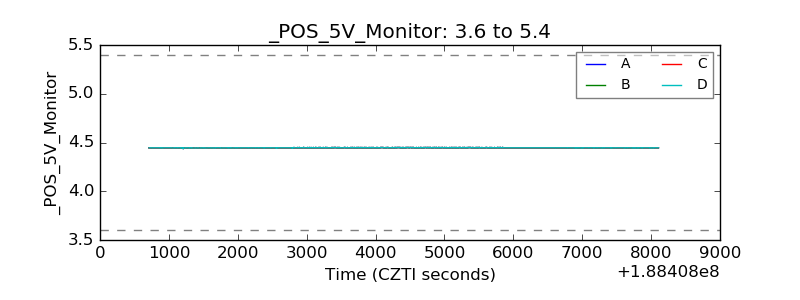 |
| _ROLL_ROT | 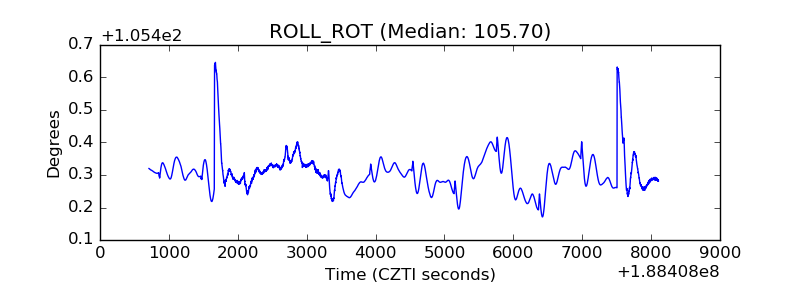 |
| _Roll_DEC | 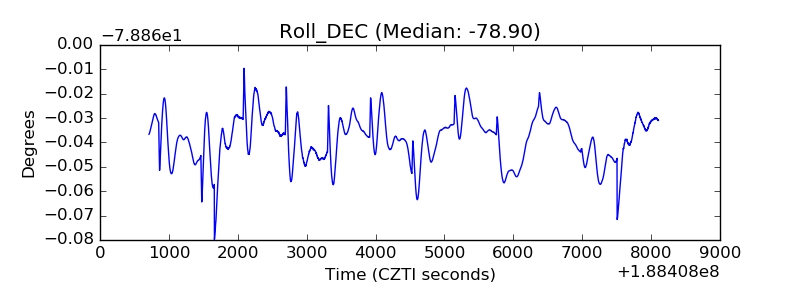 |
| _Roll_RA | 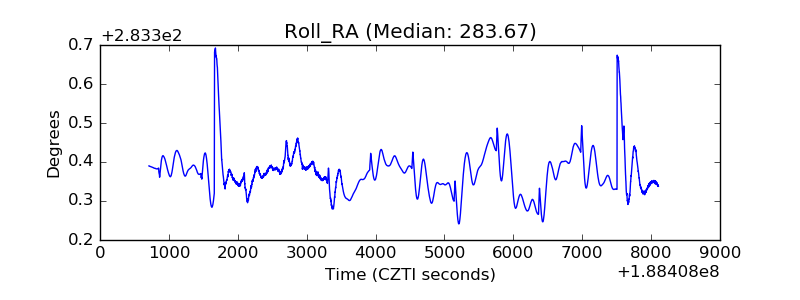 |
| Veto Counter | 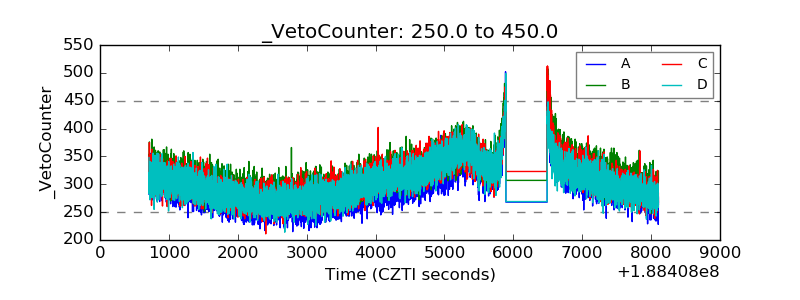 |