| Param | Original file | Final file |
|---|---|---|
| Filename | modeM0/AS1G04_011T02_9000000226_01253cztM0_level2.evt | modeM0/AS1G04_011T02_9000000226_01253cztM0_level2_quad_clean.evt |
| Size (bytes) | 1,213,286,400 | 99,578,880 |
| Size | 1.1 GB | 95.0 MB |
| Events in quadrant A | 8,348,547 | 672,350 |
| Events in quadrant B | 9,512,512 | 653,883 |
| Events in quadrant C | 7,951,664 | 650,755 |
| Events in quadrant D | 10,478,986 | 561,238 |
| Mode SS | |||
|---|---|---|---|
| Quadrant | BADHDUFLAG | Total packets | Discarded packets |
| A | 0 | 138 | 0 |
| B | 0 | 138 | 0 |
| C | 0 | 138 | 0 |
| D | 0 | 138 | 0 |
| Mode M9 | |||
|---|---|---|---|
| Quadrant | BADHDUFLAG | Total packets | Discarded packets |
| A | 0 | 8 | 0 |
| B | 0 | 8 | 0 |
| C | 0 | 8 | 0 |
| D | 0 | 8 | 0 |
| Mode M0 | |||
|---|---|---|---|
| Quadrant | BADHDUFLAG | Total packets | Discarded packets |
| A | 0 | 29696 | 2 |
| B | 0 | 33109 | 1 |
| C | 0 | 28507 | 1 |
| D | 0 | 36221 | 1 |
| Quadrant | Total seconds | Saturated seconds | Saturation percentage |
|---|---|---|---|
| A | 6846 | 42 | 0.613497% |
| B | 6846 | 199 | 2.906807% |
| C | 6846 | 11 | 0.160678% |
| D | 6846 | 1335 | 19.500438% |
Noise dominated data is calculated using 1-second bins in cleaned event files. If a bin has >2000 counts, and if more than 50% of those come from <1% of pixels, then it is considered to be noise-dominated and hence unusable.
| Quadrant | # 1 sec bins | Bins with >0 counts | Bins with >2000 counts | High rate bins dominated by noise | Noise dominated (total time) | Noise dominated (detector-on time) | Marked lightcurve |
|---|---|---|---|---|---|---|---|
| A | 7631 | 6846 | 262 | 262 | 3.43% | 3.83% |  |
| B | 7630 | 6845 | 642 | 642 | 8.41% | 9.38% |  |
| C | 7631 | 6846 | 114 | 114 | 1.49% | 1.67% | 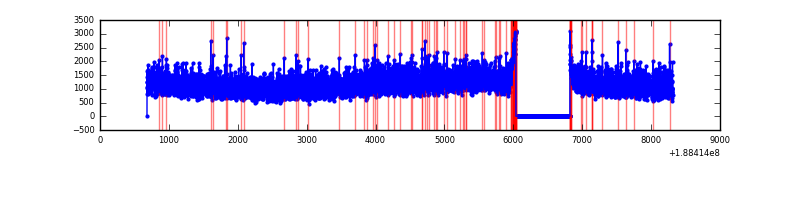 |
| D | 7630 | 6845 | 1585 | 1585 | 20.77% | 23.16% |  |
Top three noisy pixels from each quadrant. If the there are fewer than three noisy pixels in the level2.evt file, extra rows are filled as -1
| Pixel properties | Quadrant properties | ||||||
|---|---|---|---|---|---|---|---|
| Quadrant | DetID | PixID | Counts | Sigma | Mean | Median | Sigma |
| A | 8 | 14 | 210996 | 411.35 | 2101 | 2117 | 507.8 |
| A | 4 | 32 | 36233 | 67.19 | 2101 | 2117 | 507.8 |
| A | 12 | 243 | 18157 | 31.59 | 2101 | 2117 | 507.8 |
| B | 8 | 4 | 511906 | 995.23 | 2161 | 2170 | 512.2 |
| B | 5 | 191 | 346419 | 672.13 | 2161 | 2170 | 512.2 |
| B | 12 | 52 | 115091 | 220.47 | 2161 | 2170 | 512.2 |
| C | 15 | 241 | 307700 | 565.28 | 1935 | 1999 | 540.8 |
| C | 3 | 79 | 33061 | 57.44 | 1935 | 1999 | 540.8 |
| C | 3 | 111 | 28951 | 49.84 | 1935 | 1999 | 540.8 |
| D | 10 | 84 | 3325837 | 6409.07 | 1675 | 1731 | 518.7 |
| D | 13 | 169 | 427670 | 821.23 | 1675 | 1731 | 518.7 |
| D | 2 | 88 | 162165 | 309.33 | 1675 | 1731 | 518.7 |
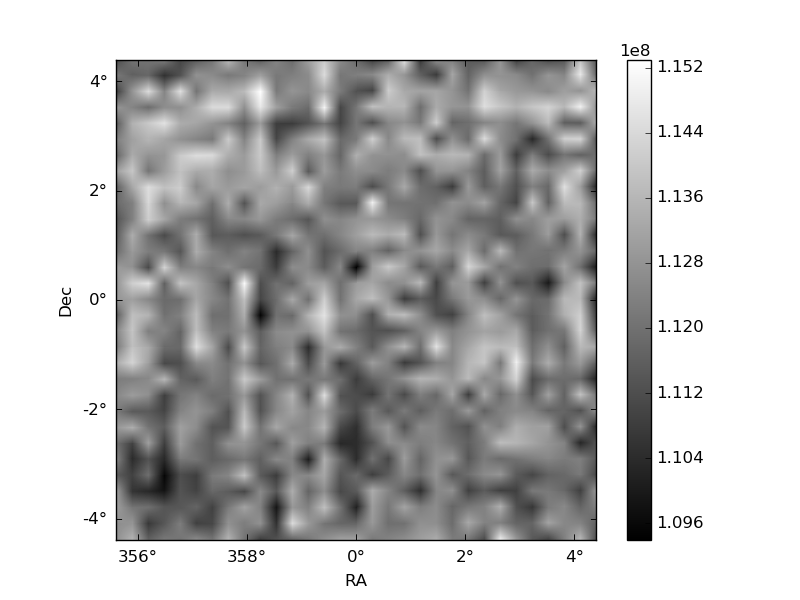
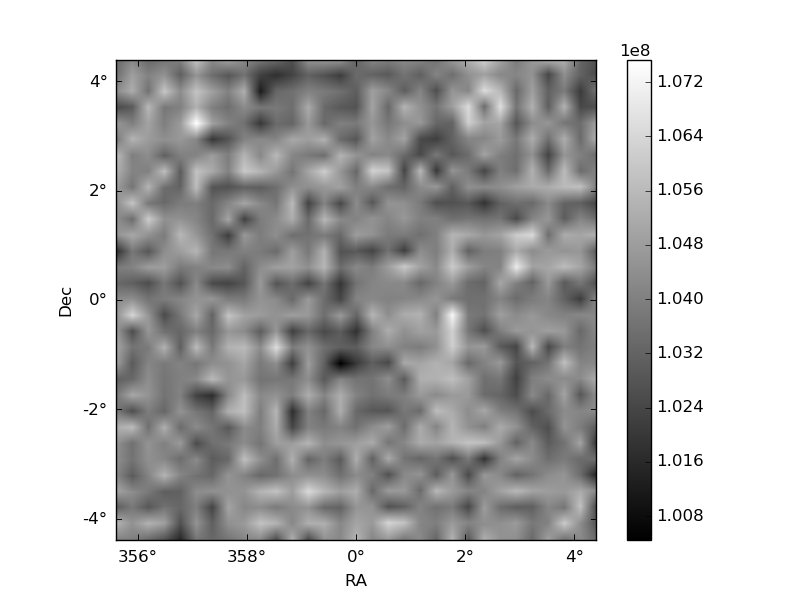
Histogram calculated using DETX and DETY for each event in the final _common_clean file
| Quadrant A | 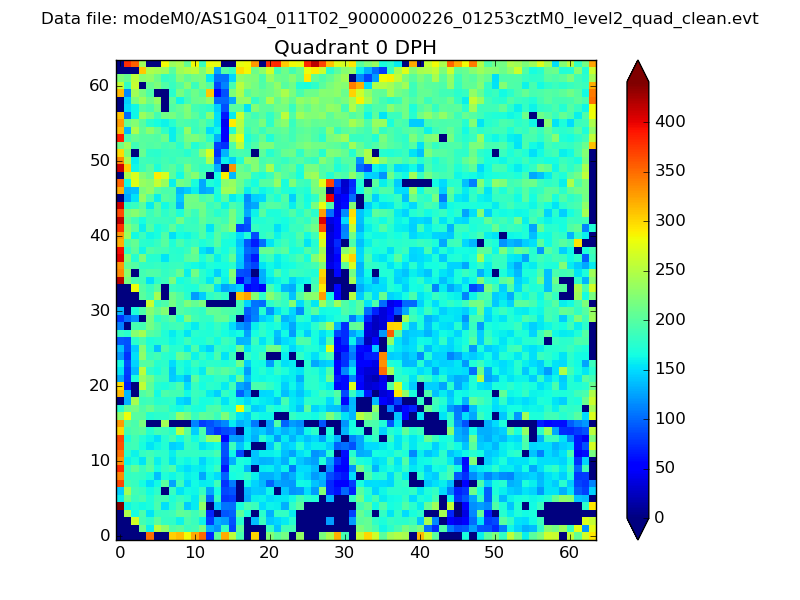 |
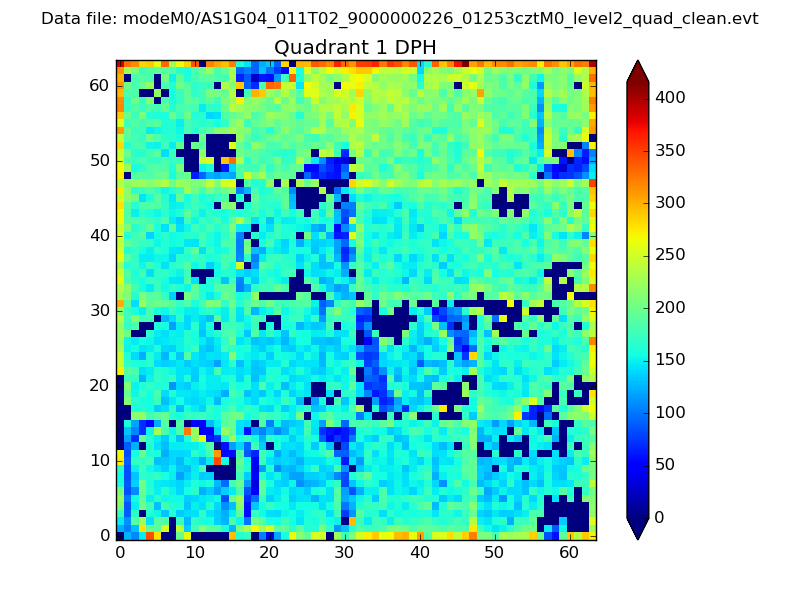 |
Quadrant B |
|---|---|---|---|
| Quadrant D | 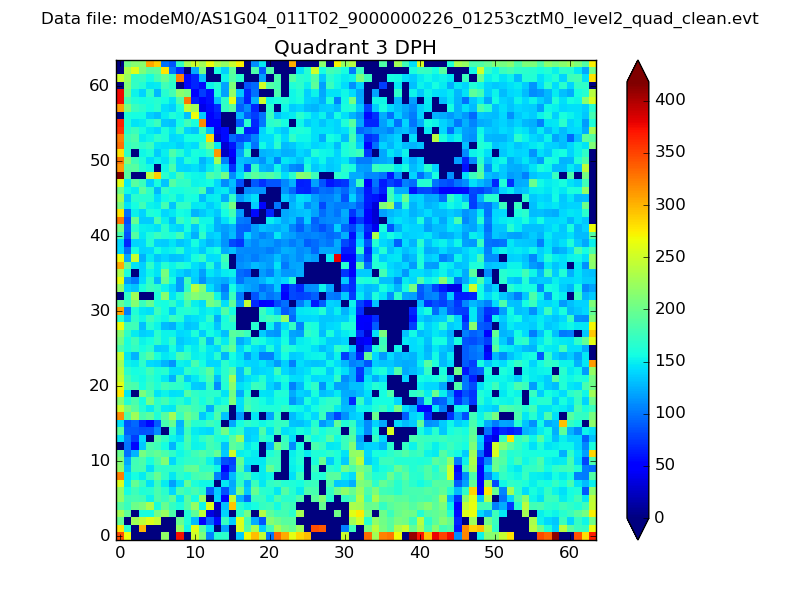 |
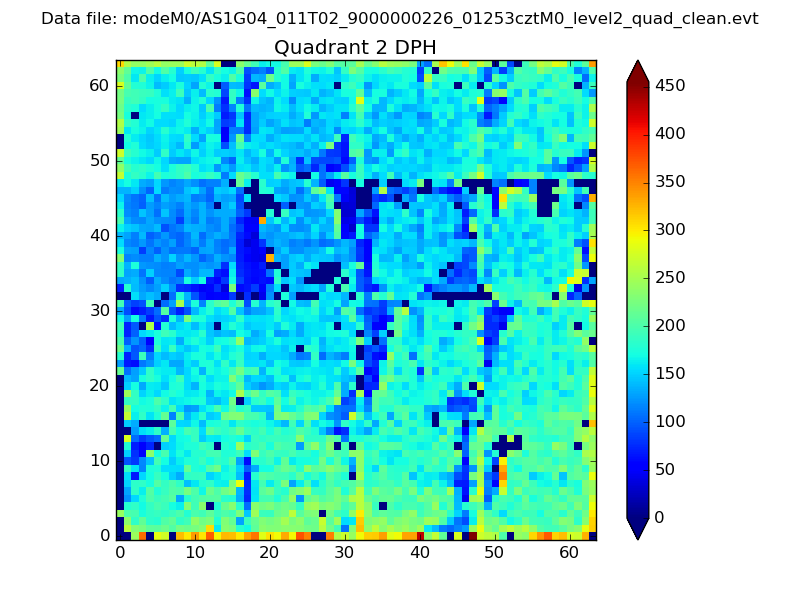 |
Quadrant C |
| Plot type | Count rate plots | Images |
|---|---|---|
| Comparison with Poisson distribution Blue bars denote a histogram of data divided into 1 sec bins. Red curve is a Poisson curve with rate = median count rate of data. |
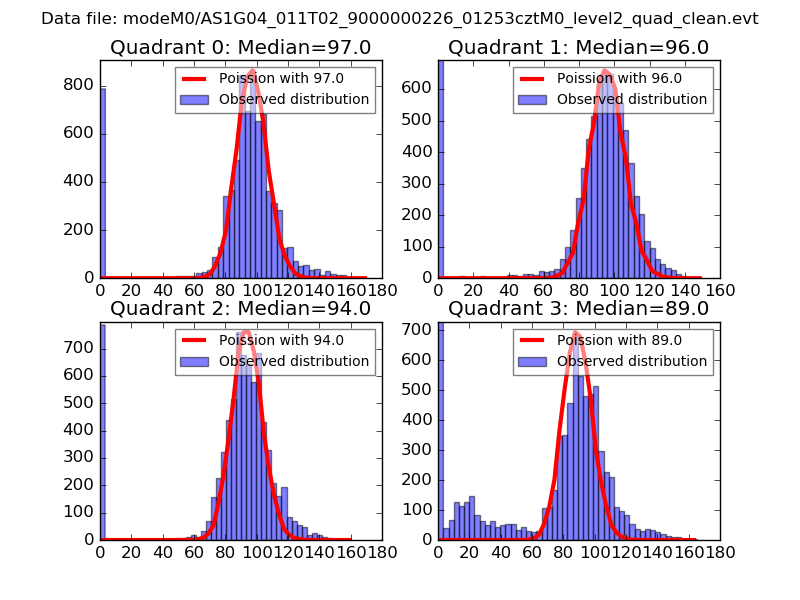 |
 |
| Quadrant-wise count rates Data is divided into 100 sec bins |
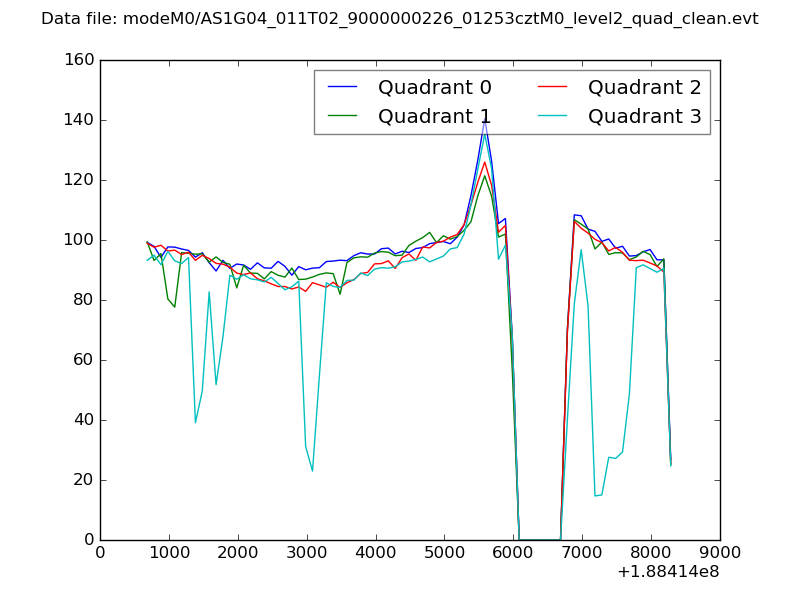 |
|
| Module-wise count rates for Quadrant A Data is divided into 100 sec bins |
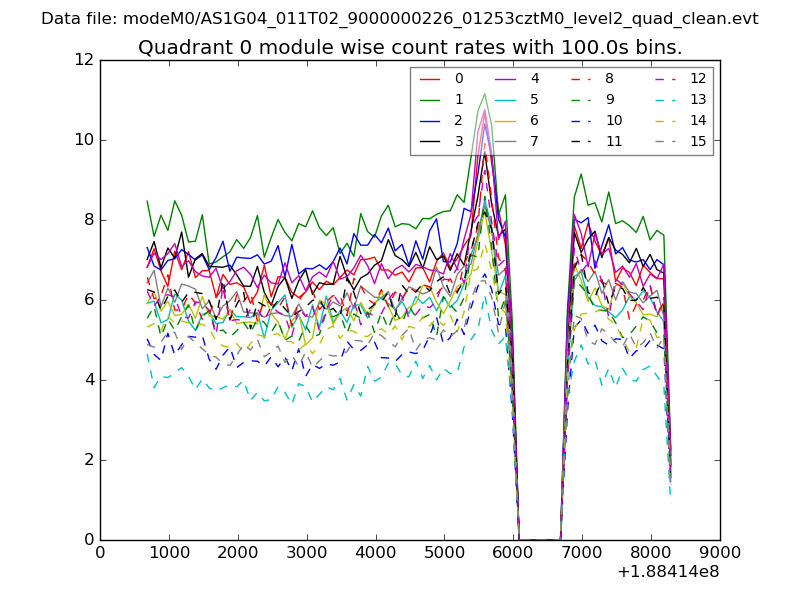 |
 |
| Module-wise count rates for Quadrant B Data is divided into 100 sec bins |
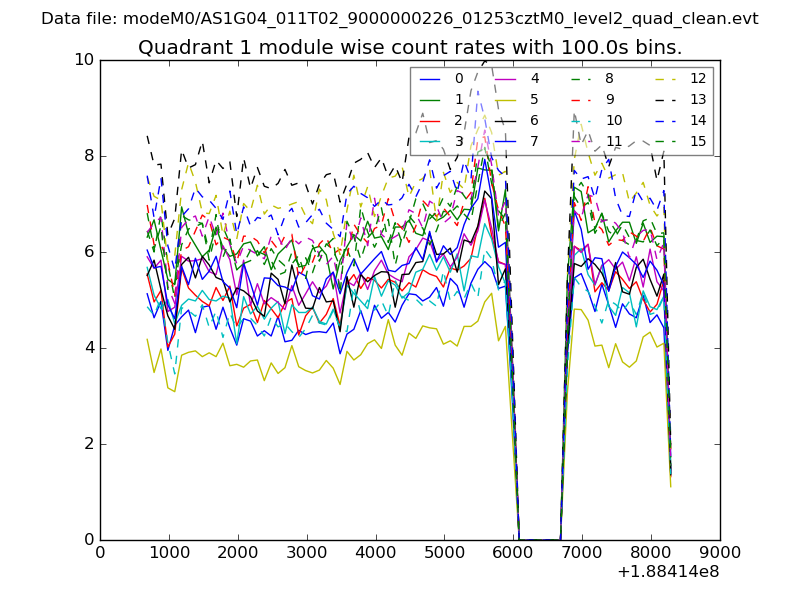 |
 |
| Module-wise count rates for Quadrant C Data is divided into 100 sec bins |
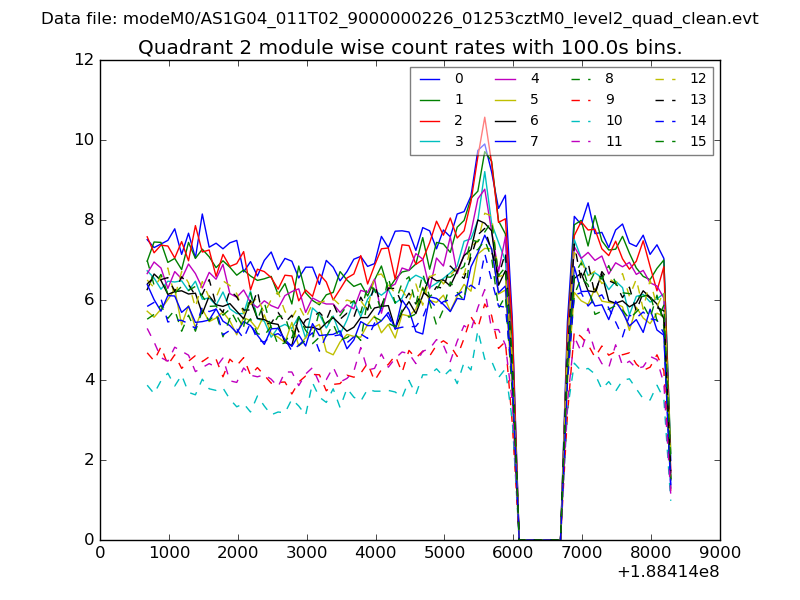 |
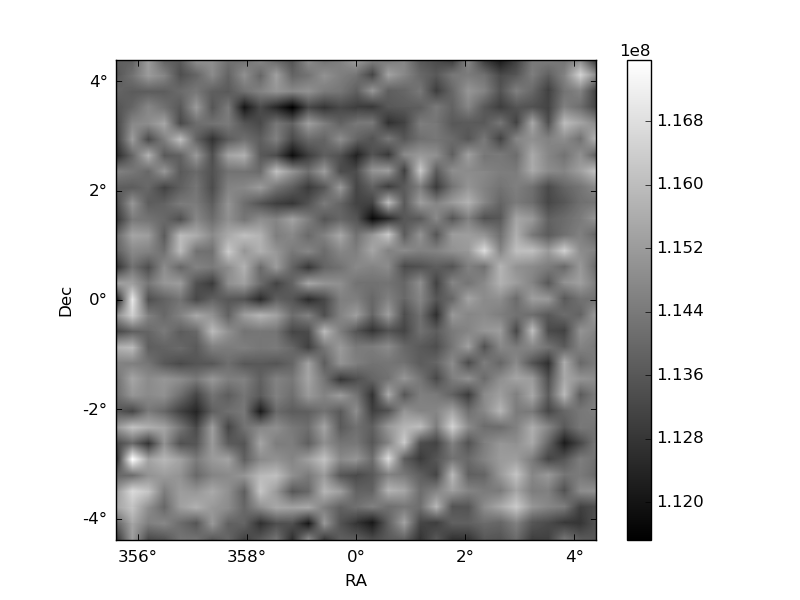 |
| Module-wise count rates for Quadrant D Data is divided into 100 sec bins |
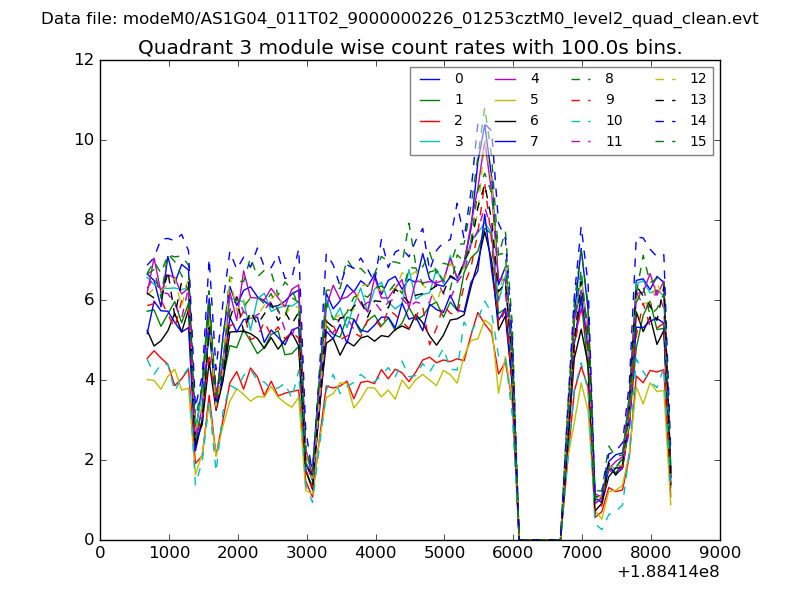 |
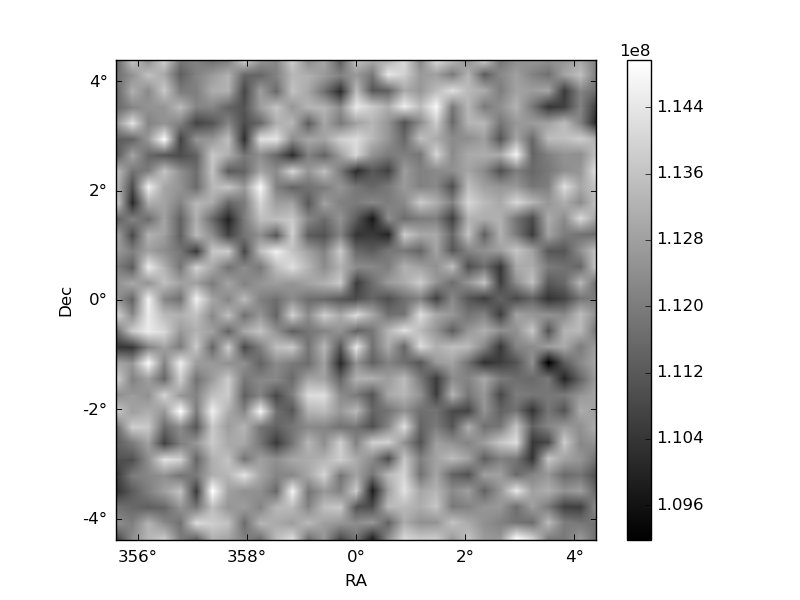 |
| Parameter | Plot |
|---|---|
| CZT HV Monitor | 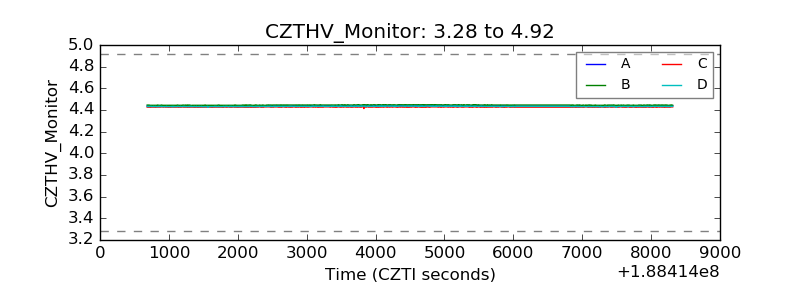 |
| D_VDD | 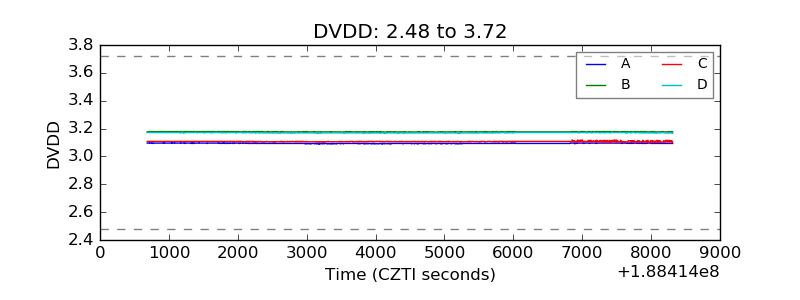 |
| Temperature 1 | 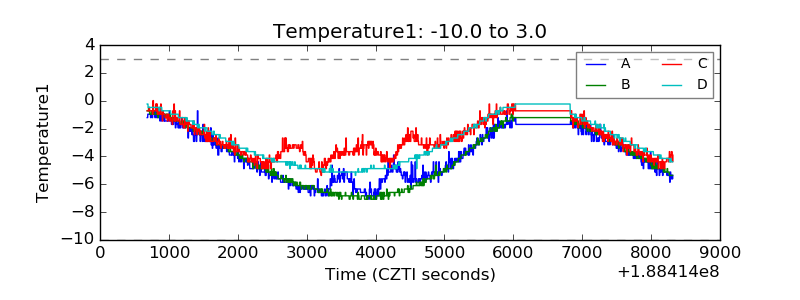 |
| Veto HV Monitor | 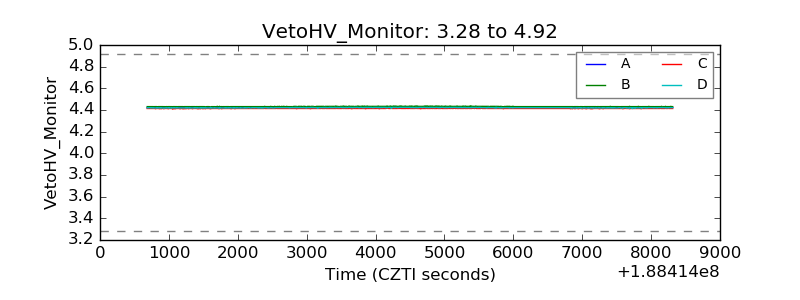 |
| Veto LLD | 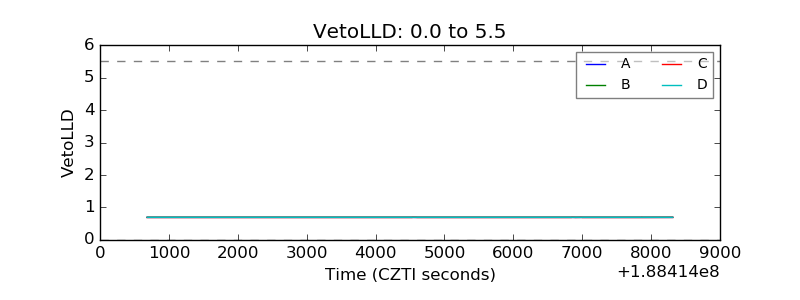 |
| Alpha Counter | 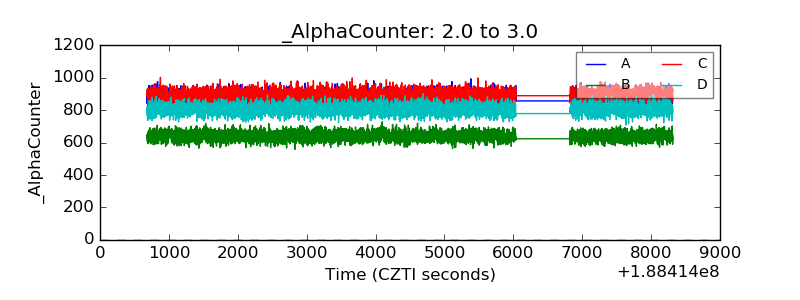 |
| _CPM_Rate | 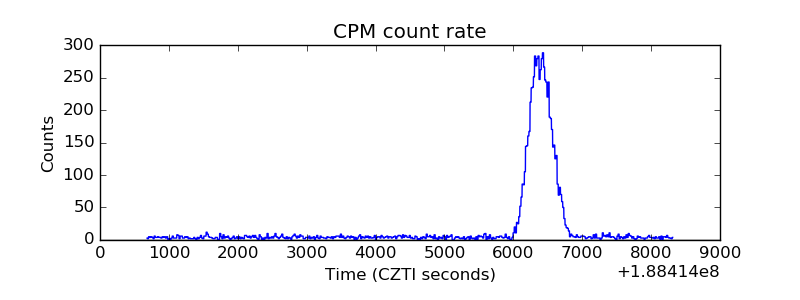 |
| CZT Counter | 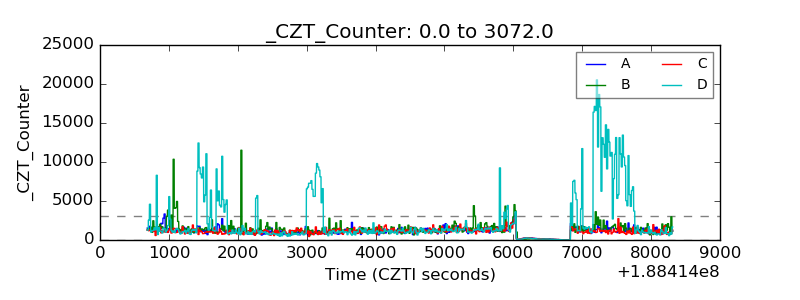 |
| +2.5 Volts monitor | 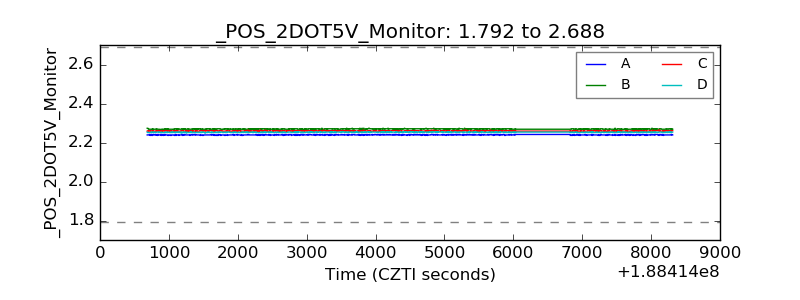 |
| +5 Volts monitor |  |
| _ROLL_ROT | 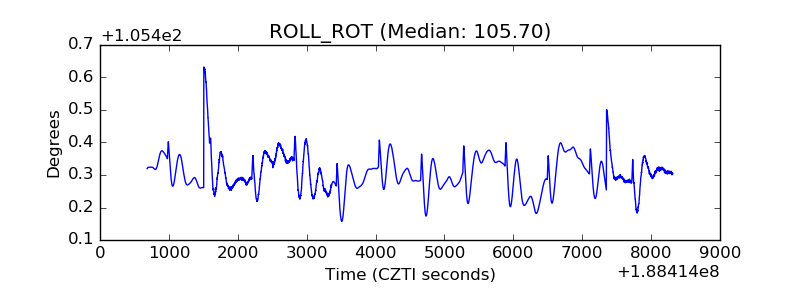 |
| _Roll_DEC | 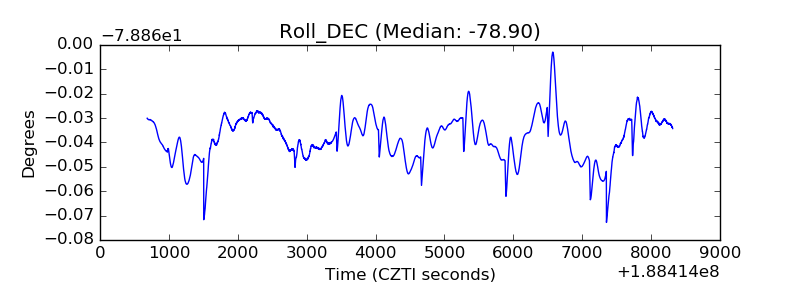 |
| _Roll_RA | 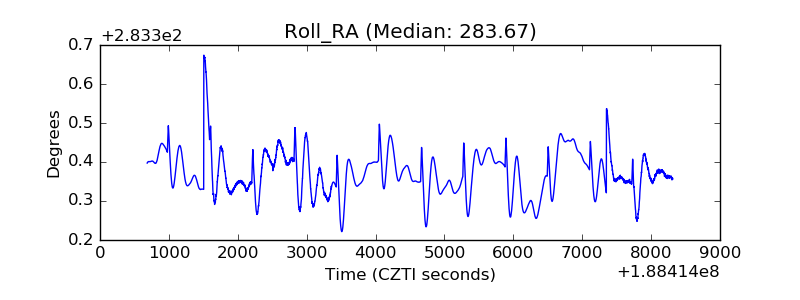 |
| Veto Counter | 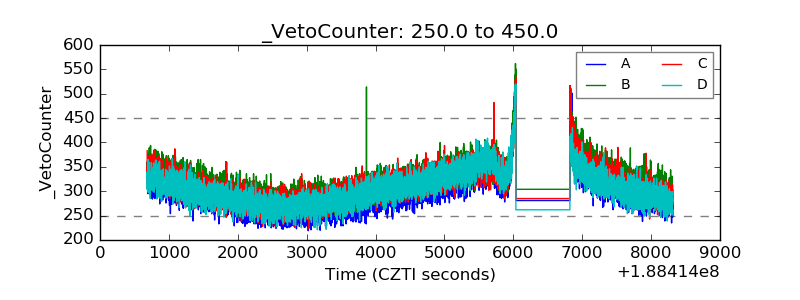 |