| Param | Original file | Final file |
|---|---|---|
| Filename | modeM0/AS1G04_011T02_9000000226_01254cztM0_level2.evt | modeM0/AS1G04_011T02_9000000226_01254cztM0_level2_quad_clean.evt |
| Size (bytes) | 1,195,102,080 | 100,408,320 |
| Size | 1.1 GB | 95.8 MB |
| Events in quadrant A | 7,890,374 | 683,100 |
| Events in quadrant B | 8,815,569 | 666,579 |
| Events in quadrant C | 7,891,671 | 652,729 |
| Events in quadrant D | 11,154,907 | 572,896 |
| Mode SS | |||
|---|---|---|---|
| Quadrant | BADHDUFLAG | Total packets | Discarded packets |
| A | 0 | 136 | 0 |
| B | 0 | 136 | 0 |
| C | 0 | 136 | 0 |
| D | 0 | 136 | 0 |
| Mode M9 | |||
|---|---|---|---|
| Quadrant | BADHDUFLAG | Total packets | Discarded packets |
| A | 0 | 9 | 0 |
| B | 0 | 9 | 0 |
| C | 0 | 9 | 0 |
| D | 0 | 9 | 0 |
| Mode M0 | |||
|---|---|---|---|
| Quadrant | BADHDUFLAG | Total packets | Discarded packets |
| A | 0 | 28188 | 2 |
| B | 0 | 30887 | 1 |
| C | 0 | 28202 | 1 |
| D | 0 | 38070 | 1 |
| Quadrant | Total seconds | Saturated seconds | Saturation percentage |
|---|---|---|---|
| A | 6667 | 30 | 0.449978% |
| B | 6667 | 75 | 1.124944% |
| C | 6667 | 23 | 0.344983% |
| D | 6667 | 1387 | 20.803960% |
Noise dominated data is calculated using 1-second bins in cleaned event files. If a bin has >2000 counts, and if more than 50% of those come from <1% of pixels, then it is considered to be noise-dominated and hence unusable.
| Quadrant | # 1 sec bins | Bins with >0 counts | Bins with >2000 counts | High rate bins dominated by noise | Noise dominated (total time) | Noise dominated (detector-on time) | Marked lightcurve |
|---|---|---|---|---|---|---|---|
| A | 7607 | 6667 | 176 | 176 | 2.31% | 2.64% | 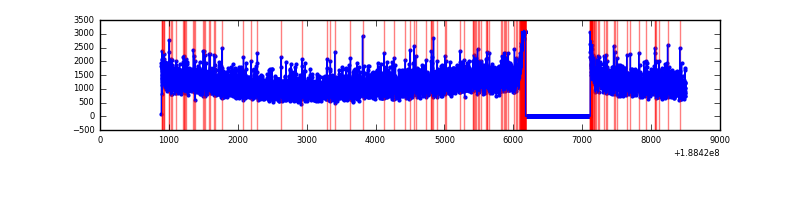 |
| B | 7606 | 6666 | 390 | 390 | 5.13% | 5.85% |  |
| C | 7606 | 6666 | 137 | 137 | 1.80% | 2.06% |  |
| D | 7607 | 6667 | 2072 | 2072 | 27.24% | 31.08% | 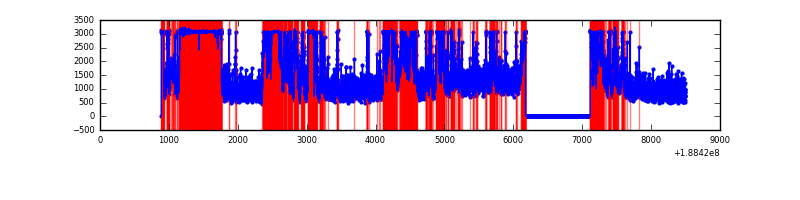 |
Top three noisy pixels from each quadrant. If the there are fewer than three noisy pixels in the level2.evt file, extra rows are filled as -1
| Pixel properties | Quadrant properties | ||||||
|---|---|---|---|---|---|---|---|
| Quadrant | DetID | PixID | Counts | Sigma | Mean | Median | Sigma |
| A | 4 | 32 | 23090 | 42.68 | 2046 | 2058 | 492.7 |
| A | 11 | 79 | 9883 | 15.88 | 2046 | 2058 | 492.7 |
| A | 13 | 9 | 9180 | 14.45 | 2046 | 2058 | 492.7 |
| B | 8 | 4 | 256038 | 501.77 | 2134 | 2140 | 506.0 |
| B | 12 | 52 | 206943 | 404.75 | 2134 | 2140 | 506.0 |
| B | 15 | 22 | 70402 | 134.9 | 2134 | 2140 | 506.0 |
| C | 15 | 241 | 298012 | 554.92 | 1917 | 1983 | 533.5 |
| C | 9 | 52 | 41452 | 73.99 | 1917 | 1983 | 533.5 |
| C | 3 | 111 | 28587 | 49.87 | 1917 | 1983 | 533.5 |
| D | 10 | 84 | 2665243 | 5209.74 | 1647 | 1703 | 511.3 |
| D | 13 | 169 | 2053831 | 4013.85 | 1647 | 1703 | 511.3 |
| D | 2 | 88 | 101350 | 194.9 | 1647 | 1703 | 511.3 |
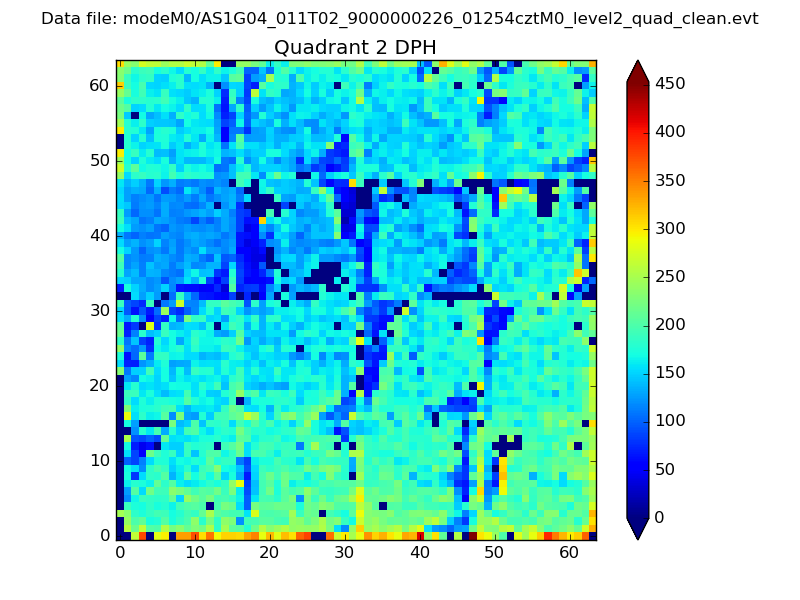
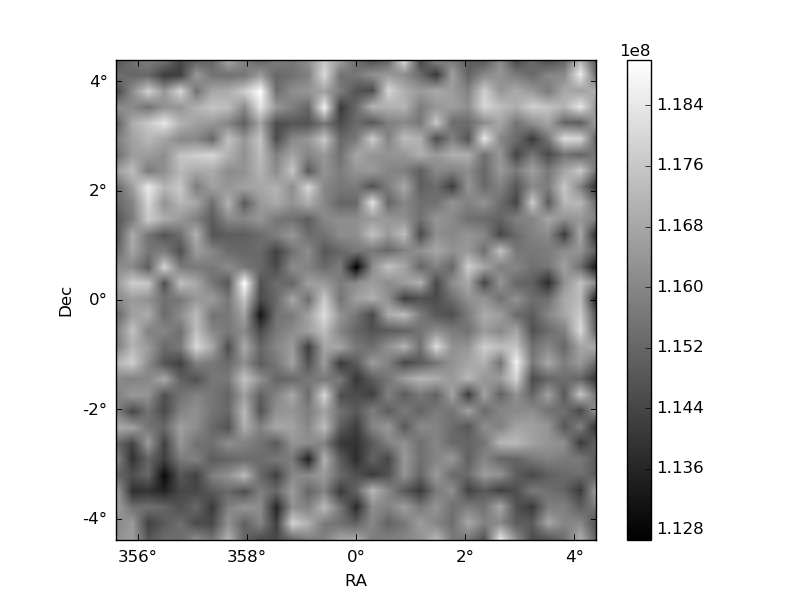
Histogram calculated using DETX and DETY for each event in the final _common_clean file
| Quadrant A | 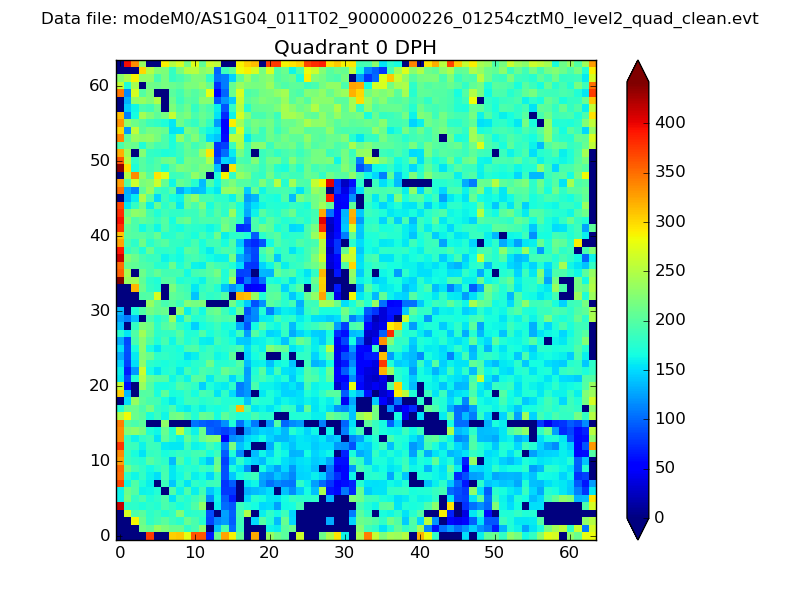 |
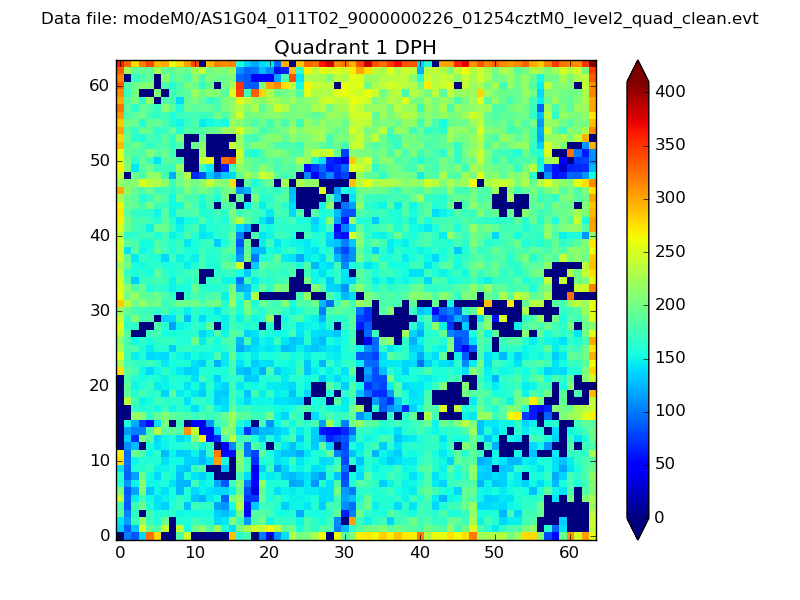 |
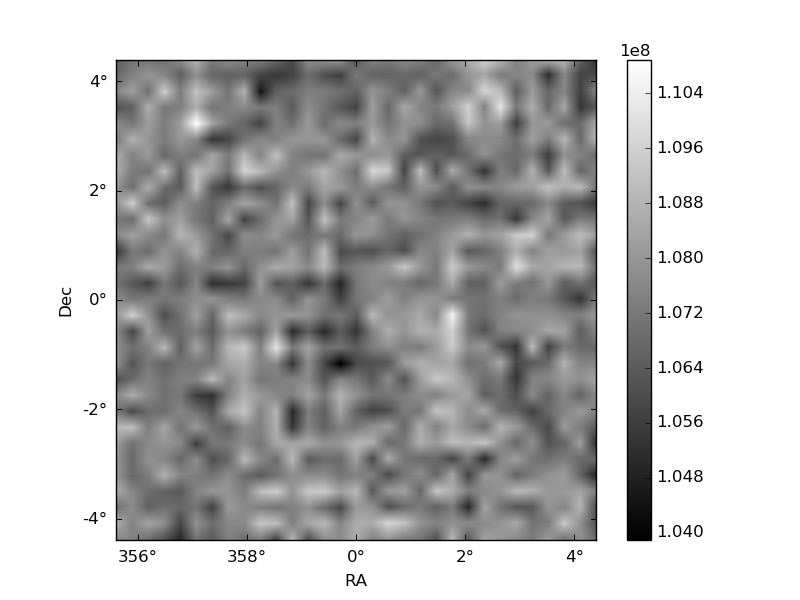
Quadrant B |
|---|---|---|---|
| Quadrant D |  |
 |
Quadrant C |
| Plot type | Count rate plots | Images |
|---|---|---|
| Comparison with Poisson distribution Blue bars denote a histogram of data divided into 1 sec bins. Red curve is a Poisson curve with rate = median count rate of data. |
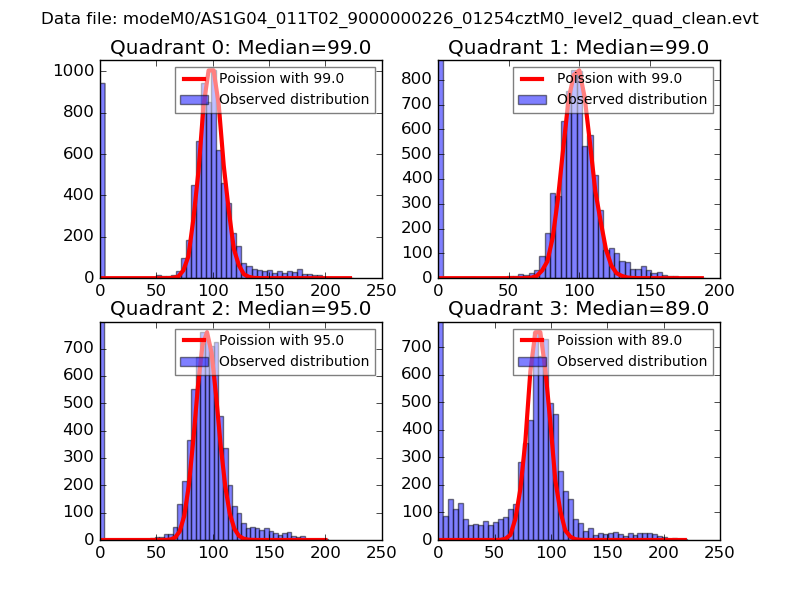 |
 |
| Quadrant-wise count rates Data is divided into 100 sec bins |
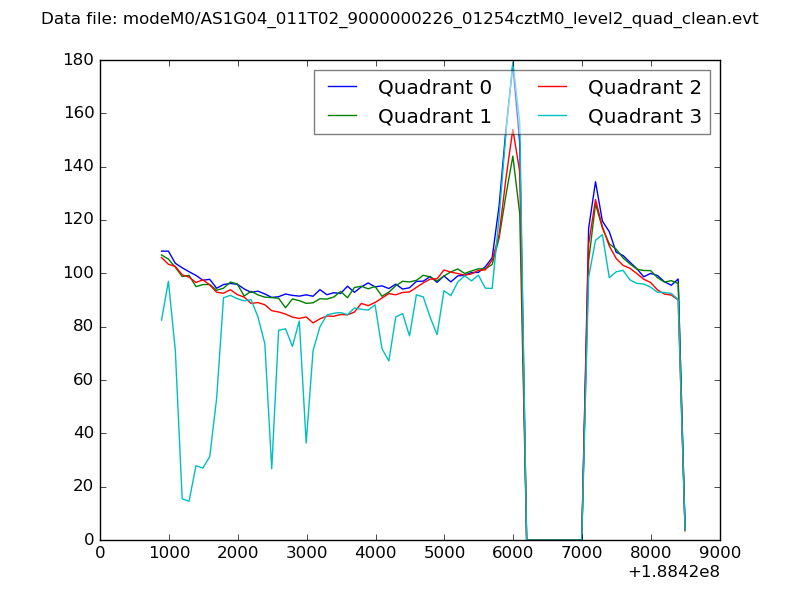 |
|
| Module-wise count rates for Quadrant A Data is divided into 100 sec bins |
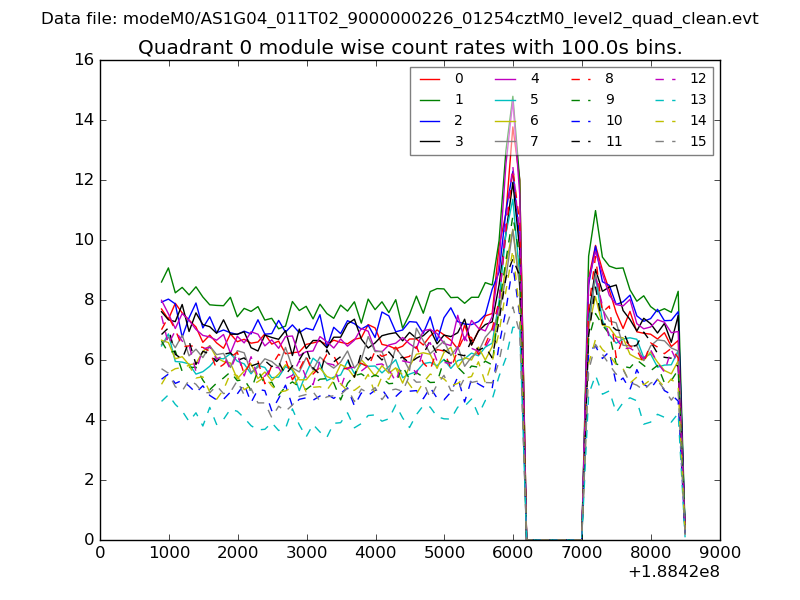 |
 |
| Module-wise count rates for Quadrant B Data is divided into 100 sec bins |
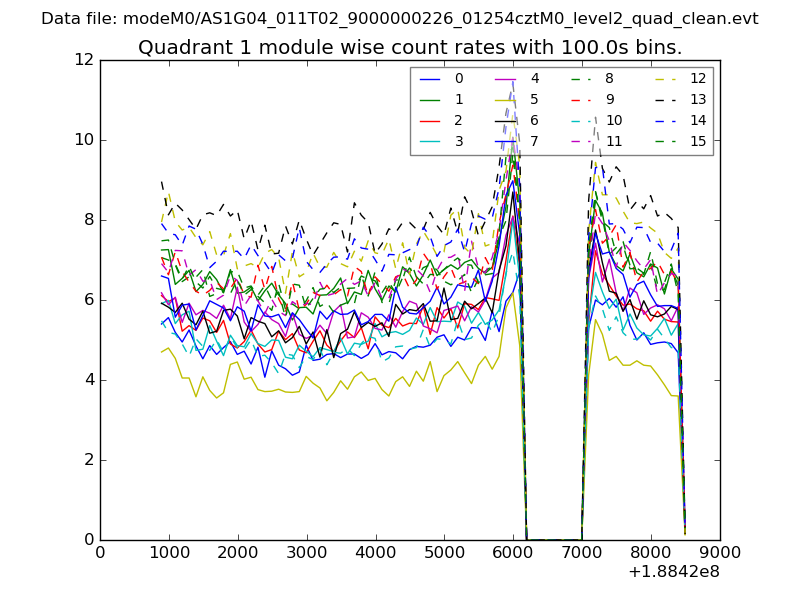 |
 |
| Module-wise count rates for Quadrant C Data is divided into 100 sec bins |
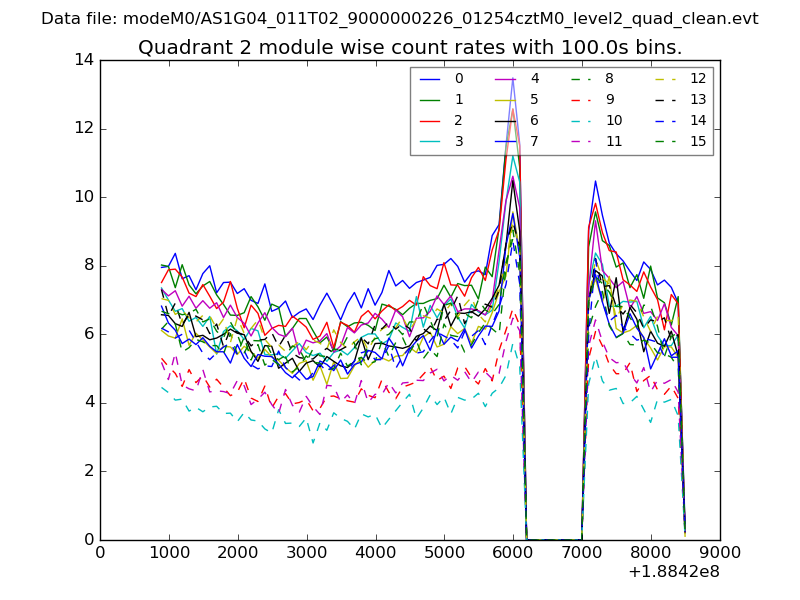 |
 |
| Module-wise count rates for Quadrant D Data is divided into 100 sec bins |
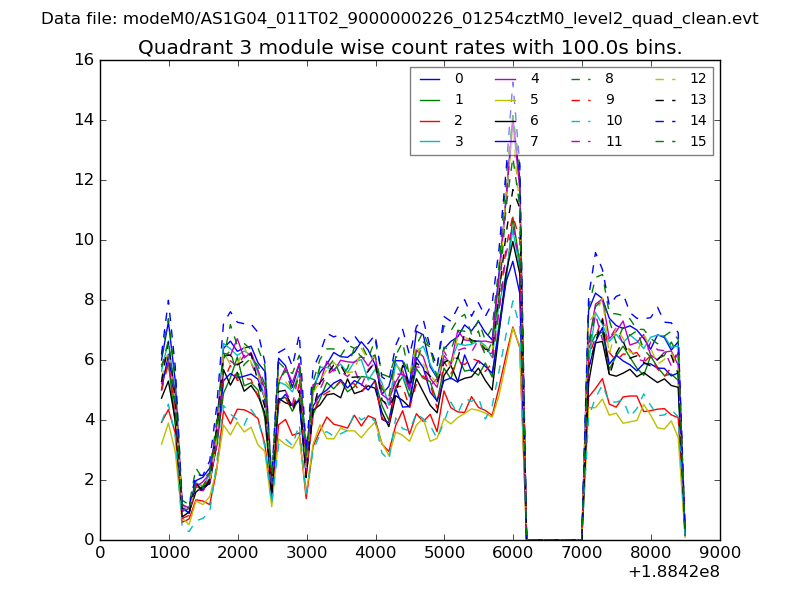 |
 |
| Parameter | Plot |
|---|---|
| CZT HV Monitor | 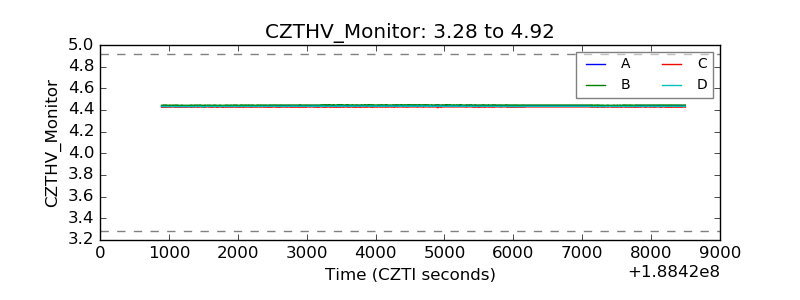 |
| D_VDD | 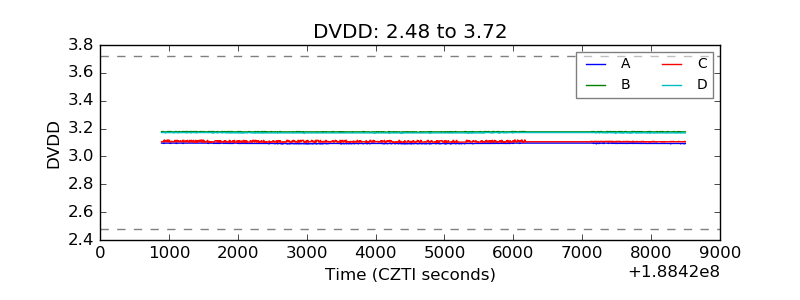 |
| Temperature 1 | 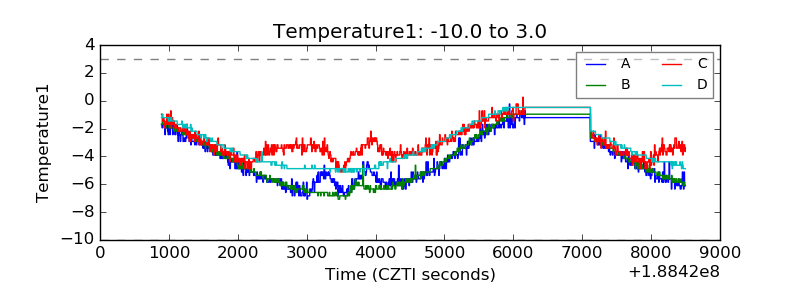 |
| Veto HV Monitor | 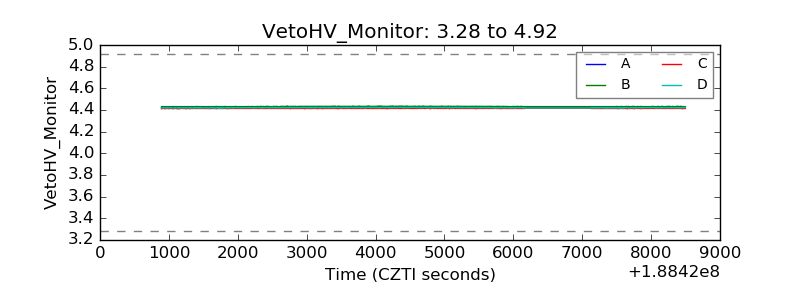 |
| Veto LLD | 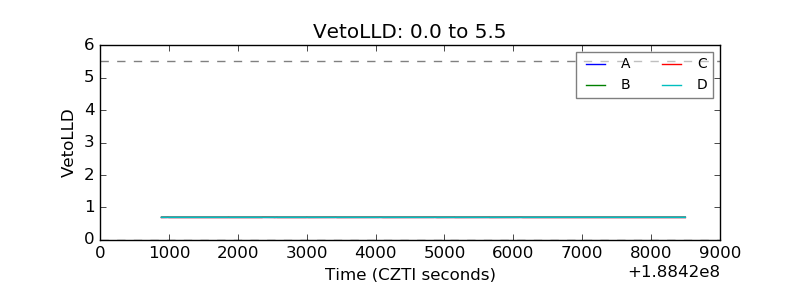 |
| Alpha Counter | 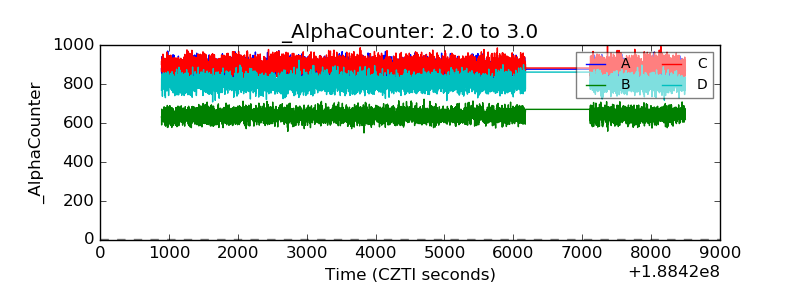 |
| _CPM_Rate | 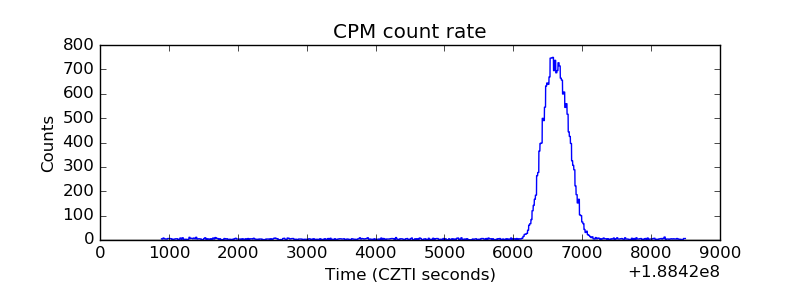 |
| CZT Counter | 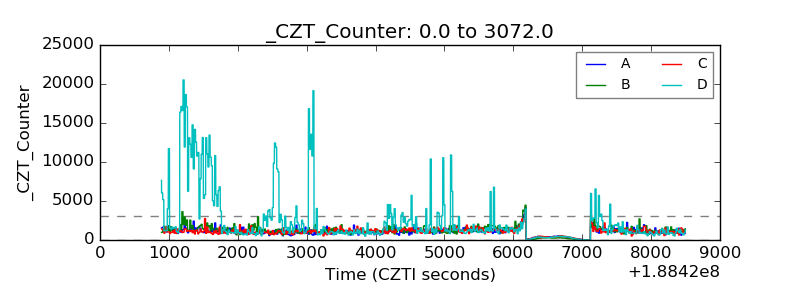 |
| +2.5 Volts monitor |  |
| +5 Volts monitor |  |
| _ROLL_ROT | 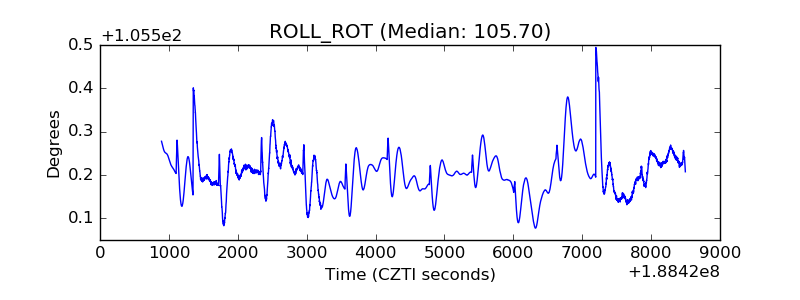 |
| _Roll_DEC | 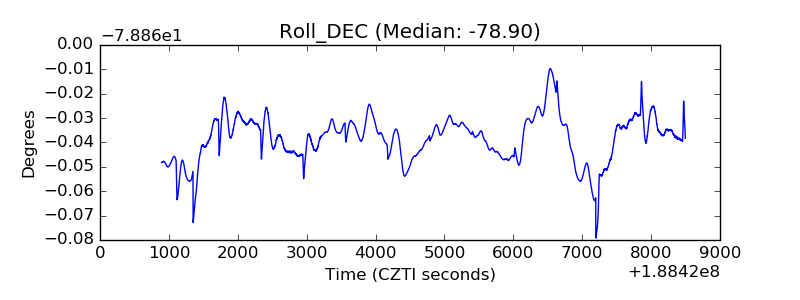 |
| _Roll_RA | 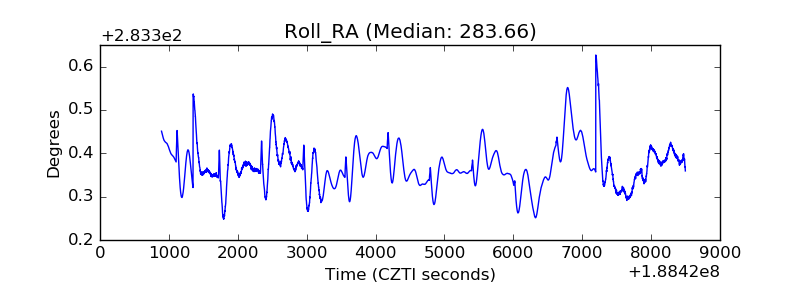 |
| Veto Counter | 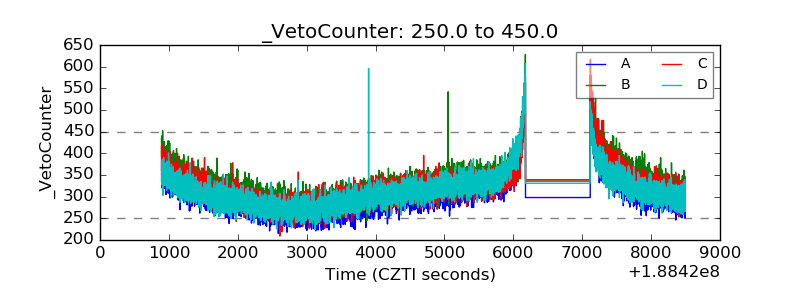 |