| Param | Original file | Final file |
|---|---|---|
| Filename | modeM0/AS1G04_011T02_9000000226_01258cztM0_level2.evt | modeM0/AS1G04_011T02_9000000226_01258cztM0_level2_quad_clean.evt |
| Size (bytes) | 1,335,133,440 | 93,922,560 |
| Size | 1.2 GB | 89.6 MB |
| Events in quadrant A | 7,083,451 | 658,212 |
| Events in quadrant B | 8,399,380 | 663,843 |
| Events in quadrant C | 7,399,793 | 648,349 |
| Events in quadrant D | 17,153,093 | 448,986 |
| Mode SS | |||
|---|---|---|---|
| Quadrant | BADHDUFLAG | Total packets | Discarded packets |
| A | 0 | 124 | 0 |
| B | 0 | 124 | 0 |
| C | 0 | 124 | 0 |
| D | 0 | 124 | 0 |
| Mode M9 | |||
|---|---|---|---|
| Quadrant | BADHDUFLAG | Total packets | Discarded packets |
| A | 0 | 13 | 0 |
| B | 0 | 13 | 0 |
| C | 0 | 13 | 0 |
| D | 0 | 13 | 0 |
| Mode M0 | |||
|---|---|---|---|
| Quadrant | BADHDUFLAG | Total packets | Discarded packets |
| A | 0 | 25329 | 2 |
| B | 0 | 29260 | 1 |
| C | 0 | 26267 | 1 |
| D | 0 | 55709 | 1 |
| Quadrant | Total seconds | Saturated seconds | Saturation percentage |
|---|---|---|---|
| A | 6062 | 2 | 0.032992% |
| B | 6062 | 115 | 1.897064% |
| C | 6062 | 22 | 0.362917% |
| D | 6062 | 3360 | 55.427252% |
Noise dominated data is calculated using 1-second bins in cleaned event files. If a bin has >2000 counts, and if more than 50% of those come from <1% of pixels, then it is considered to be noise-dominated and hence unusable.
| Quadrant | # 1 sec bins | Bins with >0 counts | Bins with >2000 counts | High rate bins dominated by noise | Noise dominated (total time) | Noise dominated (detector-on time) | Marked lightcurve |
|---|---|---|---|---|---|---|---|
| A | 7352 | 6062 | 106 | 106 | 1.44% | 1.75% | 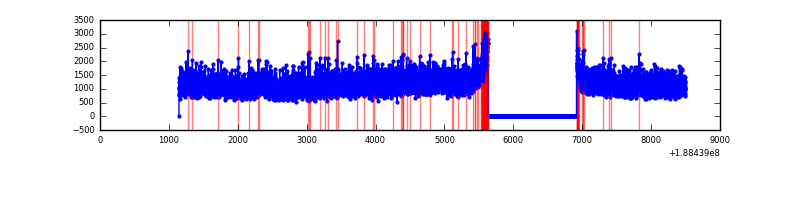 |
| B | 7352 | 6062 | 538 | 538 | 7.32% | 8.87% | 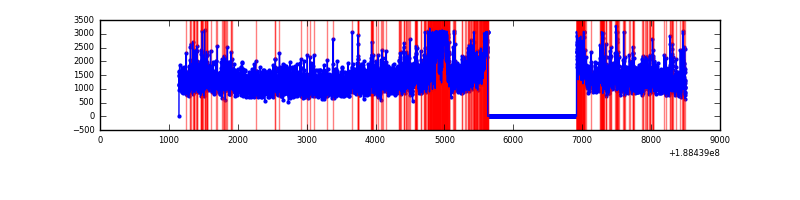 |
| C | 7352 | 6062 | 133 | 133 | 1.81% | 2.19% | 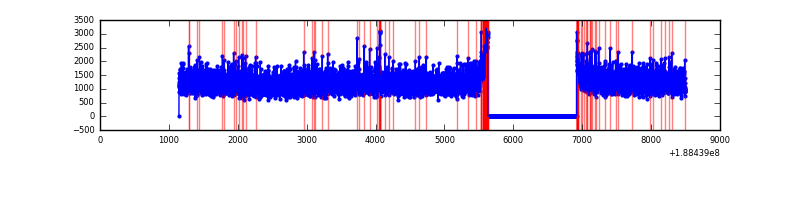 |
| D | 7352 | 6062 | 5888 | 5888 | 80.09% | 97.13% | 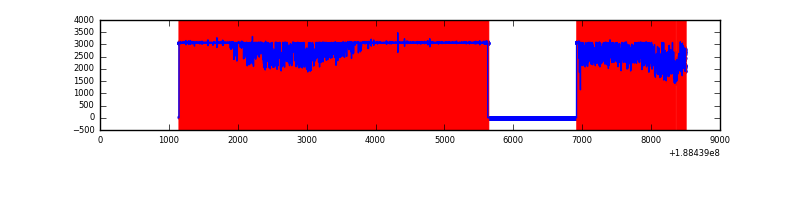 |
Top three noisy pixels from each quadrant. If the there are fewer than three noisy pixels in the level2.evt file, extra rows are filled as -1
| Pixel properties | Quadrant properties | ||||||
|---|---|---|---|---|---|---|---|
| Quadrant | DetID | PixID | Counts | Sigma | Mean | Median | Sigma |
| A | 12 | 133 | 53204 | 118.7 | 1826 | 1837 | 432.8 |
| A | 14 | 234 | 12029 | 23.55 | 1826 | 1837 | 432.8 |
| A | 13 | 9 | 9291 | 17.22 | 1826 | 1837 | 432.8 |
| B | 8 | 4 | 416146 | 923.74 | 1932 | 1936 | 448.4 |
| B | 15 | 188 | 241731 | 534.77 | 1932 | 1936 | 448.4 |
| B | 6 | 53 | 186735 | 412.13 | 1932 | 1936 | 448.4 |
| C | 15 | 241 | 259998 | 521.94 | 1801 | 1866 | 494.6 |
| C | 9 | 52 | 30804 | 58.51 | 1801 | 1866 | 494.6 |
| C | 8 | 208 | 28660 | 54.18 | 1801 | 1866 | 494.6 |
| D | 12 | 22 | 9615945 | 22612.65 | 1382 | 1427 | 425.2 |
| D | 13 | 169 | 1484567 | 3488.24 | 1382 | 1427 | 425.2 |
| D | 10 | 84 | 709359 | 1665.01 | 1382 | 1427 | 425.2 |
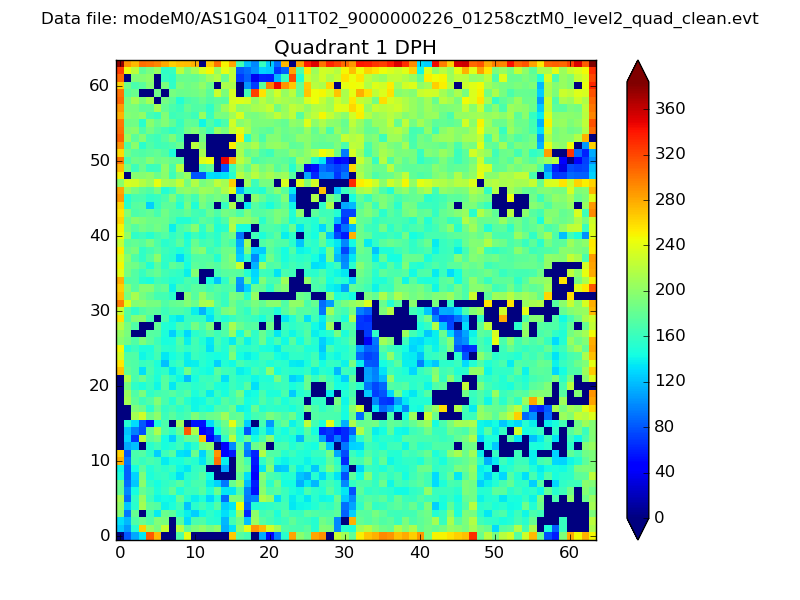
Histogram calculated using DETX and DETY for each event in the final _common_clean file
| Quadrant A |  |
 |
Quadrant B |
|---|---|---|---|
| Quadrant D |  |
 |
Quadrant C |
| Plot type | Count rate plots | Images |
|---|---|---|
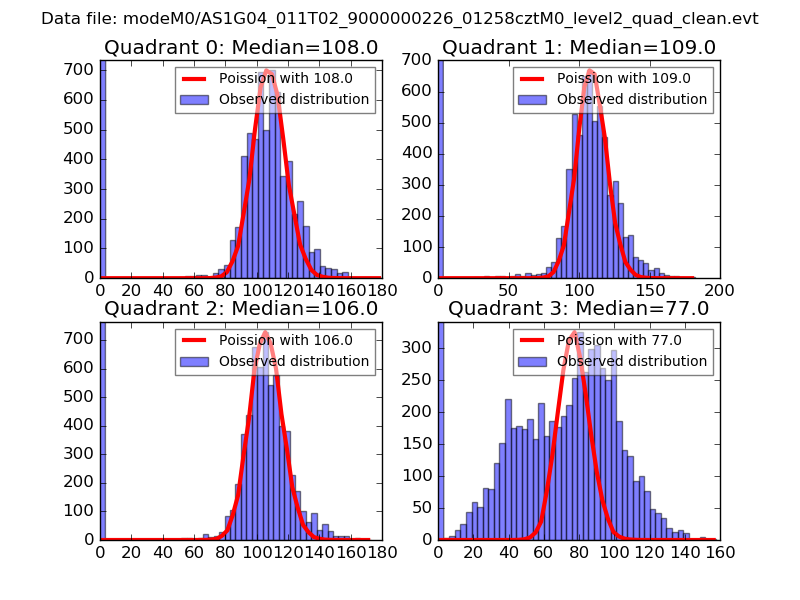
| Comparison with Poisson distribution Blue bars denote a histogram of data divided into 1 sec bins. Red curve is a Poisson curve with rate = median count rate of data. |
 |
 |
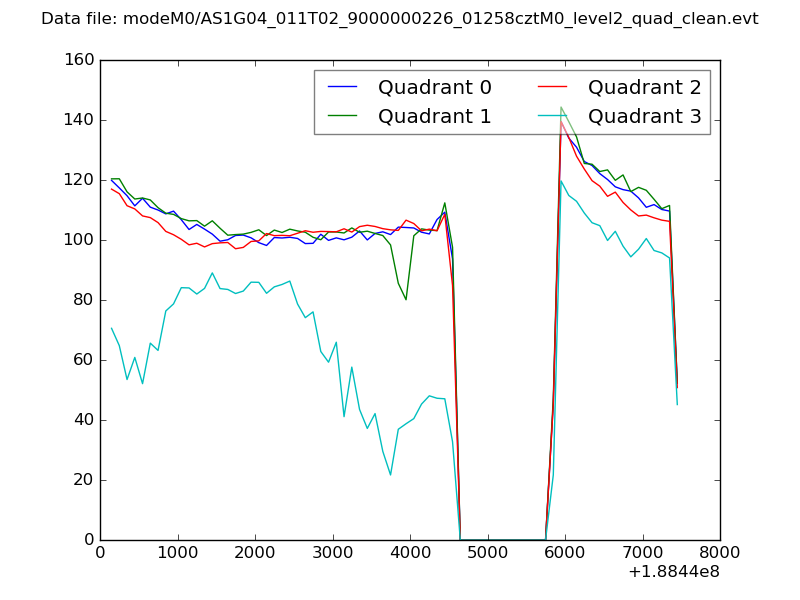
| Quadrant-wise count rates Data is divided into 100 sec bins |
 |
|
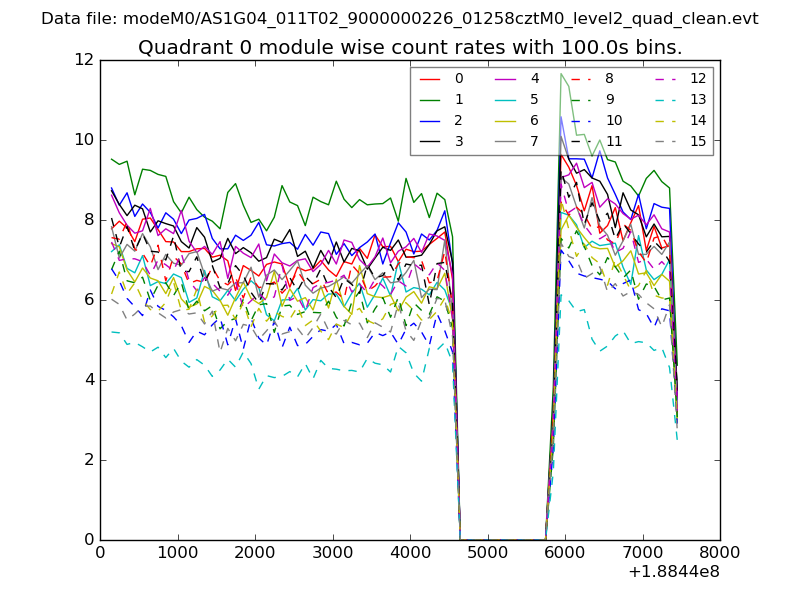
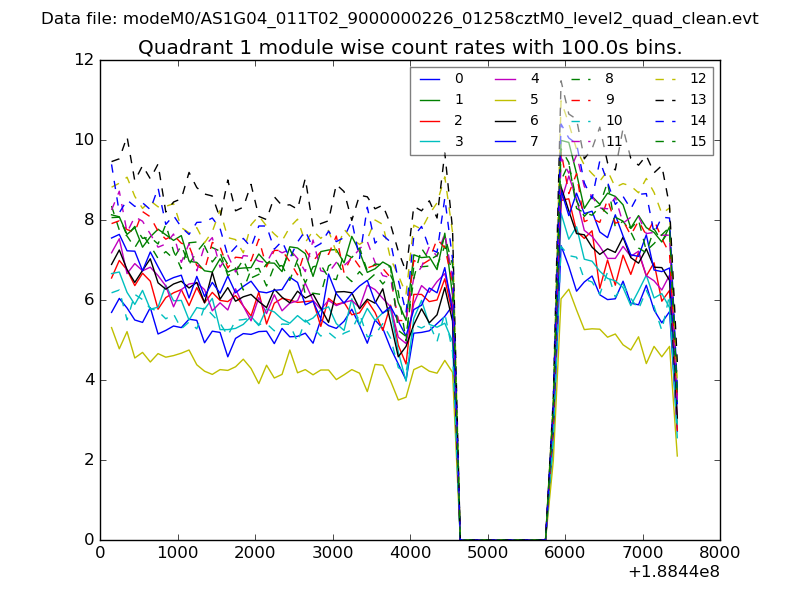
| Module-wise count rates for Quadrant A Data is divided into 100 sec bins |
 |
 |
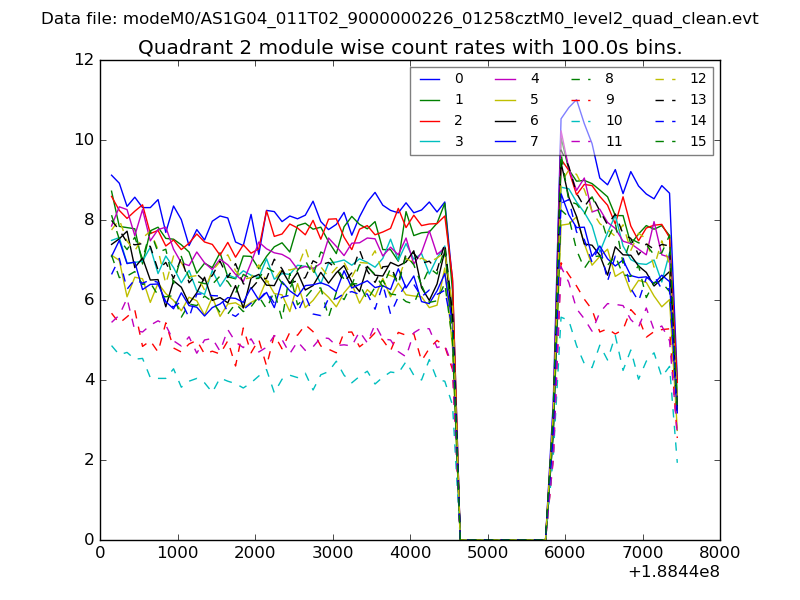
| Module-wise count rates for Quadrant B Data is divided into 100 sec bins |
 |
 |
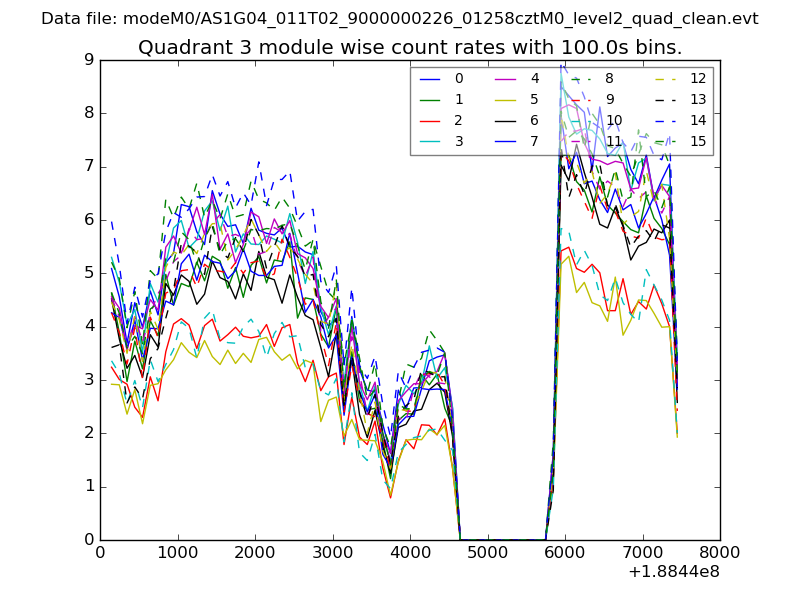
| Module-wise count rates for Quadrant C Data is divided into 100 sec bins |
 |
 |
| Module-wise count rates for Quadrant D Data is divided into 100 sec bins |
 |
 |
| Parameter | Plot |
|---|---|
| CZT HV Monitor | 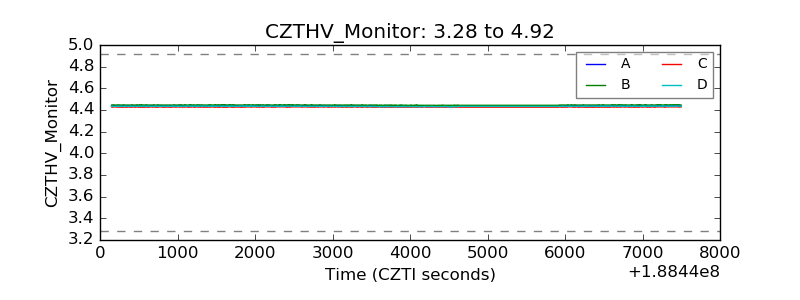 |
| D_VDD | 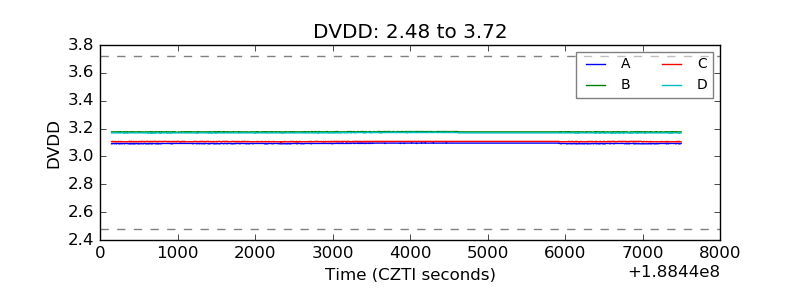 |
| Temperature 1 | 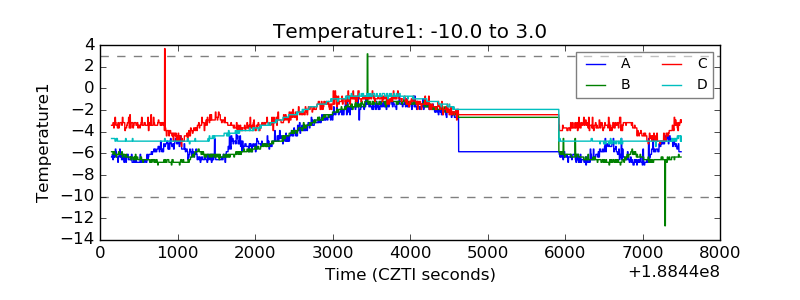 |
| Veto HV Monitor | 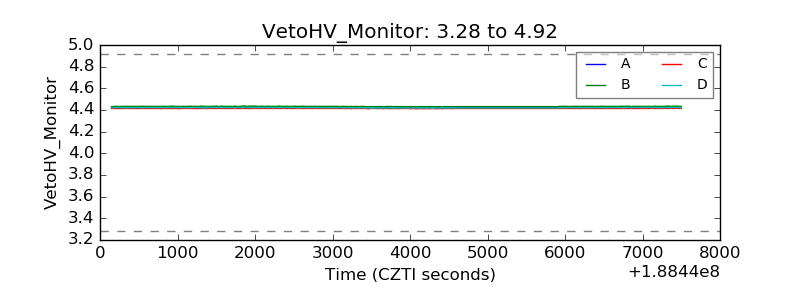 |
| Veto LLD | 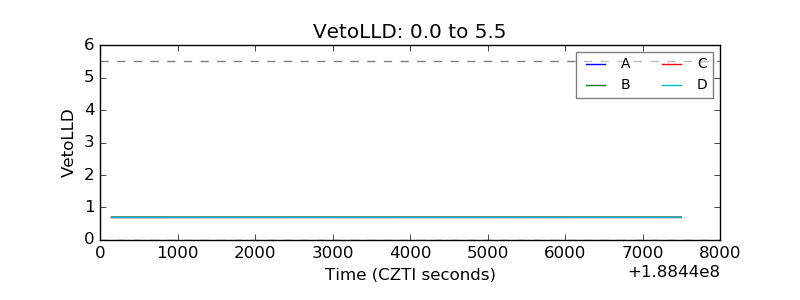 |
| Alpha Counter | 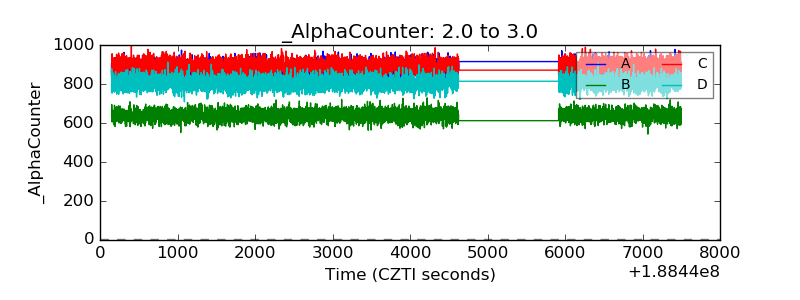 |
| _CPM_Rate | 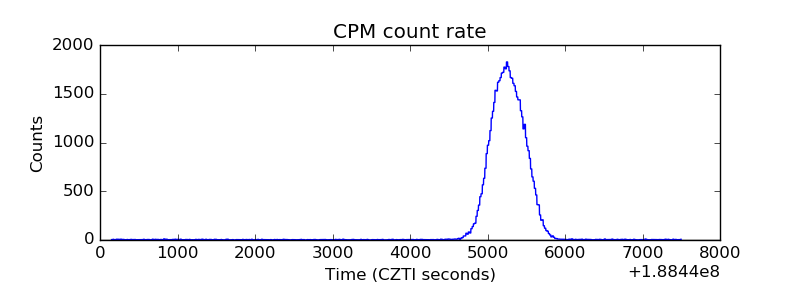 |
| CZT Counter | 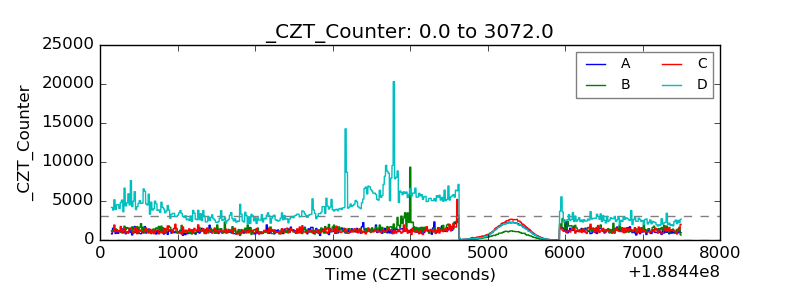 |
| +2.5 Volts monitor |  |
| +5 Volts monitor | 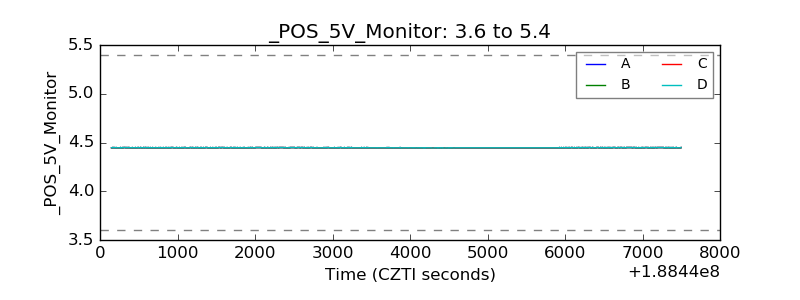 |
| _ROLL_ROT | 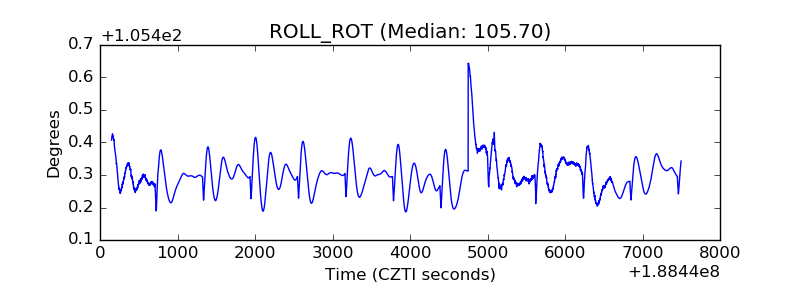 |
| _Roll_DEC | 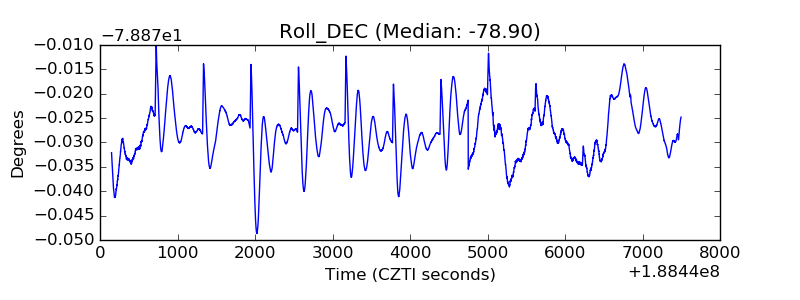 |
| _Roll_RA |  |
| Veto Counter | 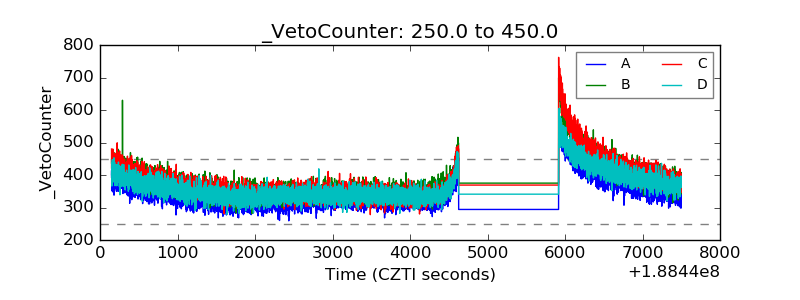 |