| Param | Original file | Final file |
|---|---|---|
| Filename | modeM0/AS1G04_011T02_9000000226_01260cztM0_level2.evt | modeM0/AS1G04_011T02_9000000226_01260cztM0_level2_quad_clean.evt |
| Size (bytes) | 1,149,341,760 | 94,109,760 |
| Size | 1.1 GB | 89.8 MB |
| Events in quadrant A | 7,491,160 | 632,358 |
| Events in quadrant B | 7,734,472 | 643,174 |
| Events in quadrant C | 7,333,093 | 628,558 |
| Events in quadrant D | 11,854,095 | 527,496 |
| Mode SS | |||
|---|---|---|---|
| Quadrant | BADHDUFLAG | Total packets | Discarded packets |
| A | 0 | 124 | 0 |
| B | 0 | 124 | 0 |
| C | 0 | 124 | 0 |
| D | 0 | 124 | 0 |
| Mode M9 | |||
|---|---|---|---|
| Quadrant | BADHDUFLAG | Total packets | Discarded packets |
| A | 0 | 11 | 0 |
| B | 0 | 11 | 0 |
| C | 0 | 11 | 0 |
| D | 0 | 11 | 0 |
| Mode M0 | |||
|---|---|---|---|
| Quadrant | BADHDUFLAG | Total packets | Discarded packets |
| A | 0 | 26496 | 2 |
| B | 0 | 27228 | 1 |
| C | 0 | 25992 | 1 |
| D | 0 | 39667 | 1 |
| Quadrant | Total seconds | Saturated seconds | Saturation percentage |
|---|---|---|---|
| A | 5972 | 56 | 0.937709% |
| B | 5972 | 44 | 0.736772% |
| C | 5972 | 25 | 0.418620% |
| D | 5972 | 1612 | 26.992632% |
Noise dominated data is calculated using 1-second bins in cleaned event files. If a bin has >2000 counts, and if more than 50% of those come from <1% of pixels, then it is considered to be noise-dominated and hence unusable.
| Quadrant | # 1 sec bins | Bins with >0 counts | Bins with >2000 counts | High rate bins dominated by noise | Noise dominated (total time) | Noise dominated (detector-on time) | Marked lightcurve |
|---|---|---|---|---|---|---|---|
| A | 7146 | 5971 | 329 | 329 | 4.60% | 5.51% |  |
| B | 7146 | 5971 | 327 | 327 | 4.58% | 5.48% |  |
| C | 7147 | 5972 | 217 | 217 | 3.04% | 3.63% |  |
| D | 7147 | 5972 | 2625 | 2625 | 36.73% | 43.96% | 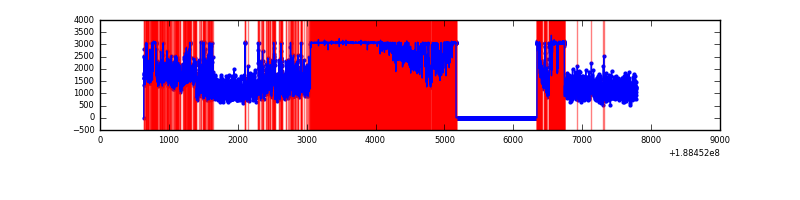 |
Top three noisy pixels from each quadrant. If the there are fewer than three noisy pixels in the level2.evt file, extra rows are filled as -1
| Pixel properties | Quadrant properties | ||||||
|---|---|---|---|---|---|---|---|
| Quadrant | DetID | PixID | Counts | Sigma | Mean | Median | Sigma |
| A | 4 | 32 | 314576 | 709.66 | 1864 | 1873 | 440.6 |
| A | 12 | 243 | 10544 | 19.68 | 1864 | 1873 | 440.6 |
| A | 13 | 9 | 10220 | 18.94 | 1864 | 1873 | 440.6 |
| B | 6 | 53 | 117329 | 256.26 | 1935 | 1936 | 450.3 |
| B | 8 | 4 | 101705 | 221.56 | 1935 | 1936 | 450.3 |
| B | 15 | 22 | 65339 | 140.8 | 1935 | 1936 | 450.3 |
| C | 15 | 241 | 253361 | 507.25 | 1793 | 1853 | 495.8 |
| C | 3 | 79 | 33577 | 63.98 | 1793 | 1853 | 495.8 |
| C | 3 | 111 | 25260 | 47.21 | 1793 | 1853 | 495.8 |
| D | 12 | 22 | 3794463 | 7676.23 | 1600 | 1657 | 494.1 |
| D | 13 | 169 | 942910 | 1904.99 | 1600 | 1657 | 494.1 |
| D | 10 | 84 | 669495 | 1351.63 | 1600 | 1657 | 494.1 |
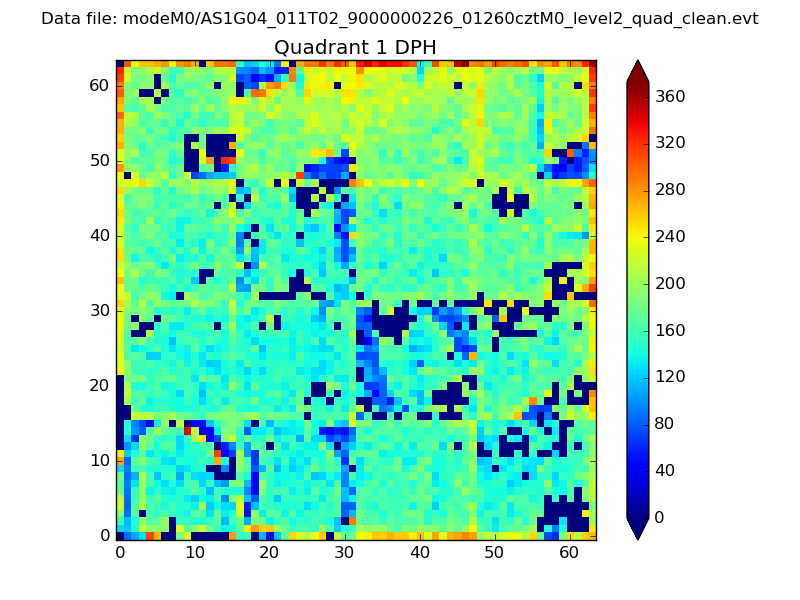
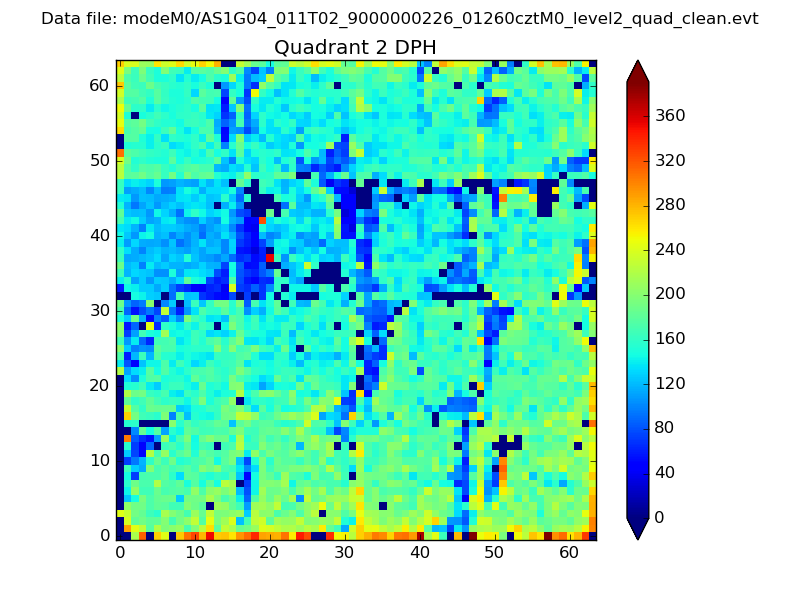
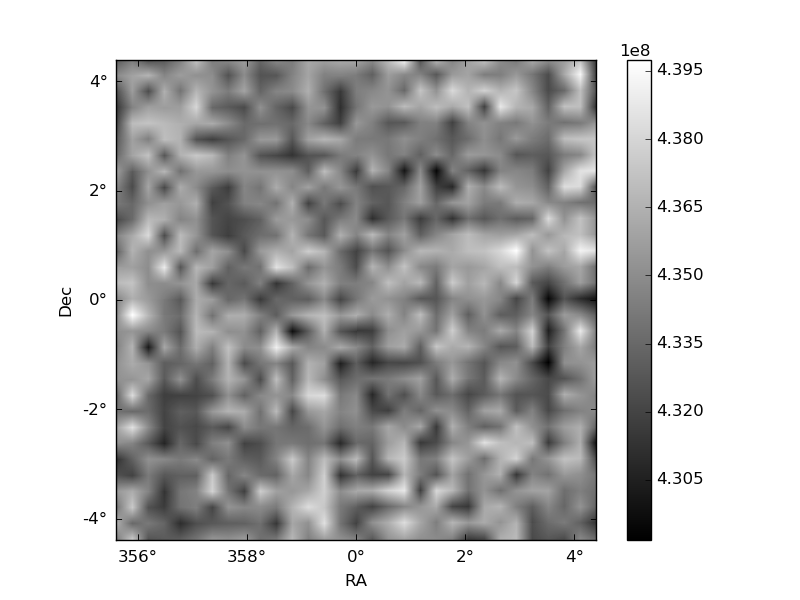
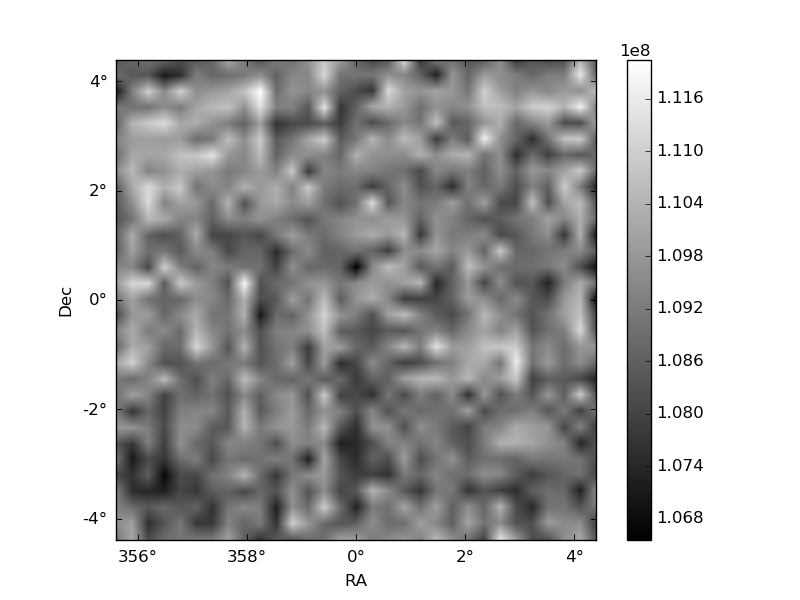
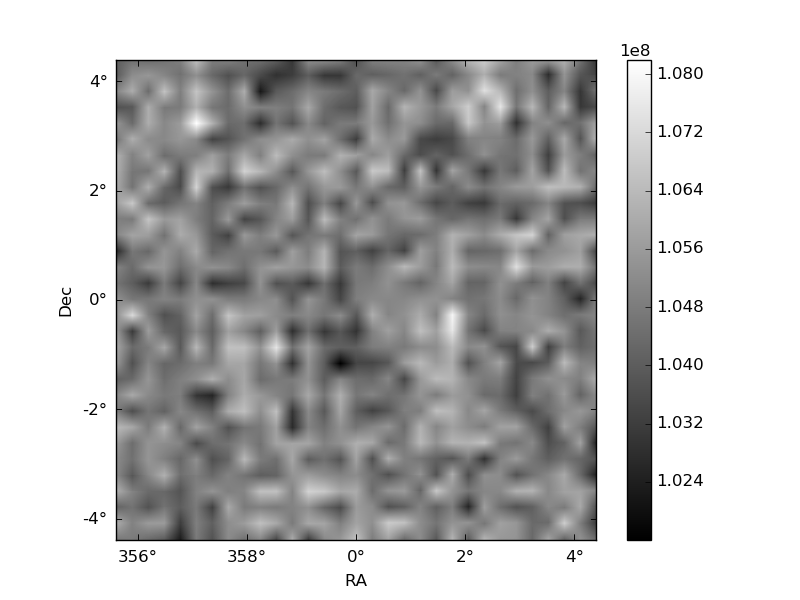
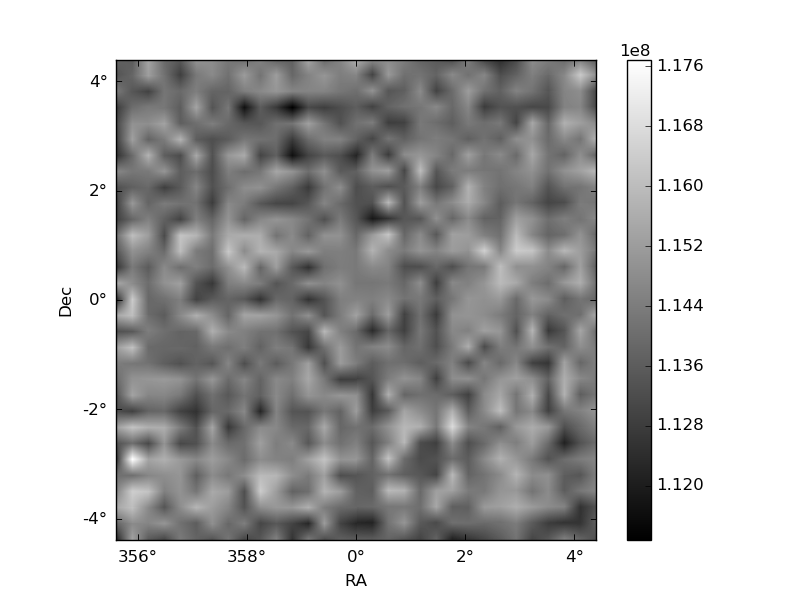
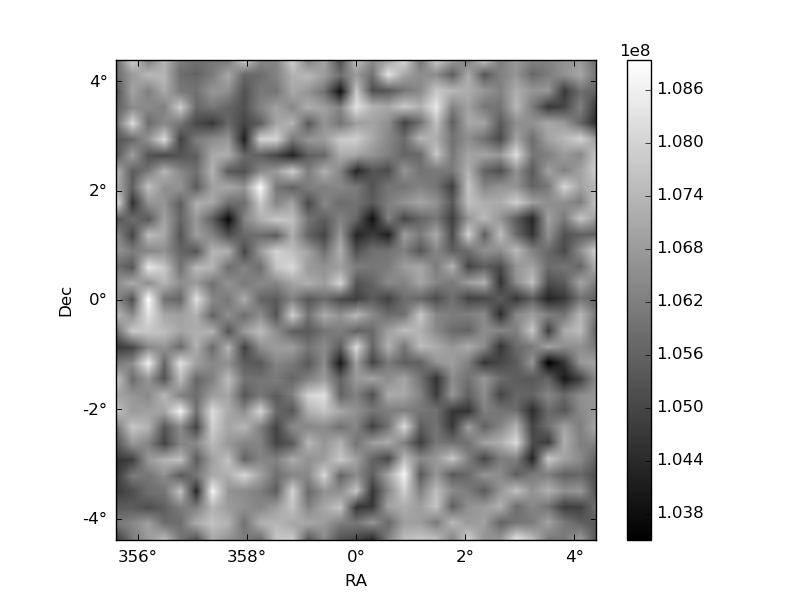
Histogram calculated using DETX and DETY for each event in the final _common_clean file
| Quadrant A |  |
 |
Quadrant B |
|---|---|---|---|
| Quadrant D | 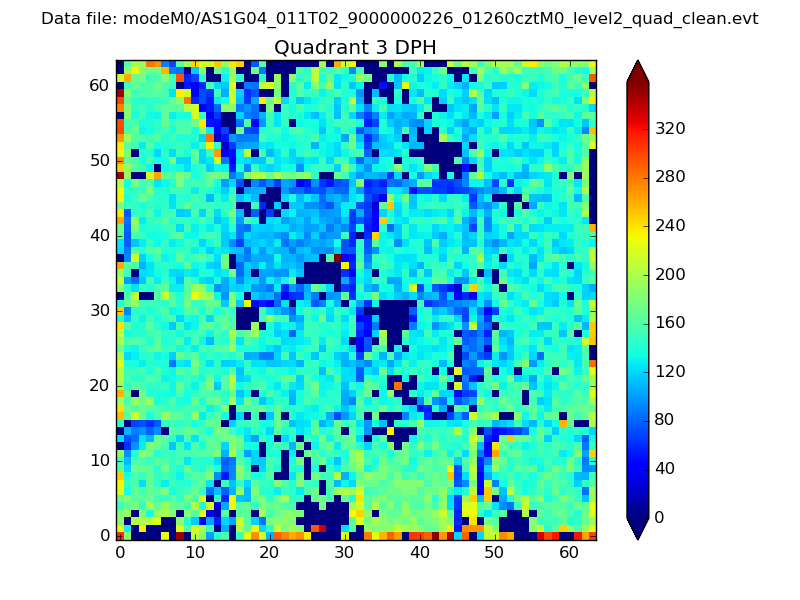 |
 |
Quadrant C |
| Plot type | Count rate plots | Images |
|---|---|---|
| Comparison with Poisson distribution Blue bars denote a histogram of data divided into 1 sec bins. Red curve is a Poisson curve with rate = median count rate of data. |
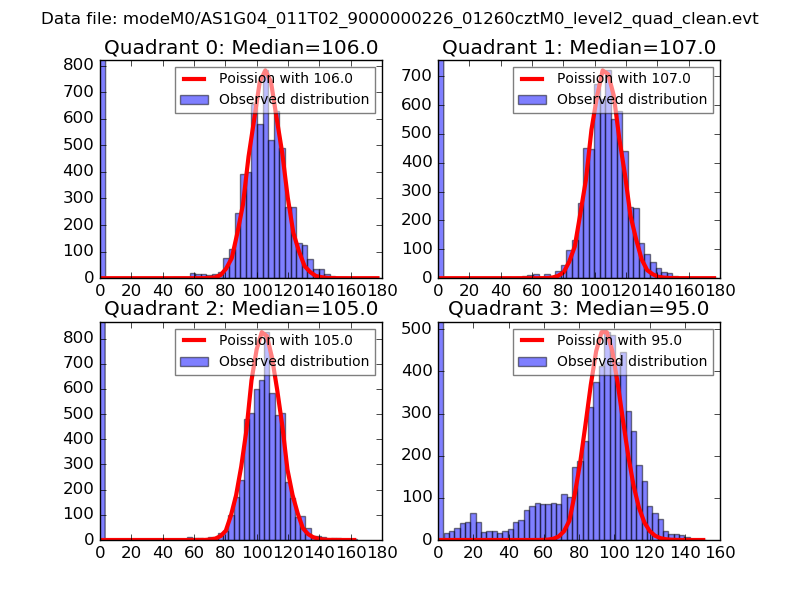 |
 |
| Quadrant-wise count rates Data is divided into 100 sec bins |
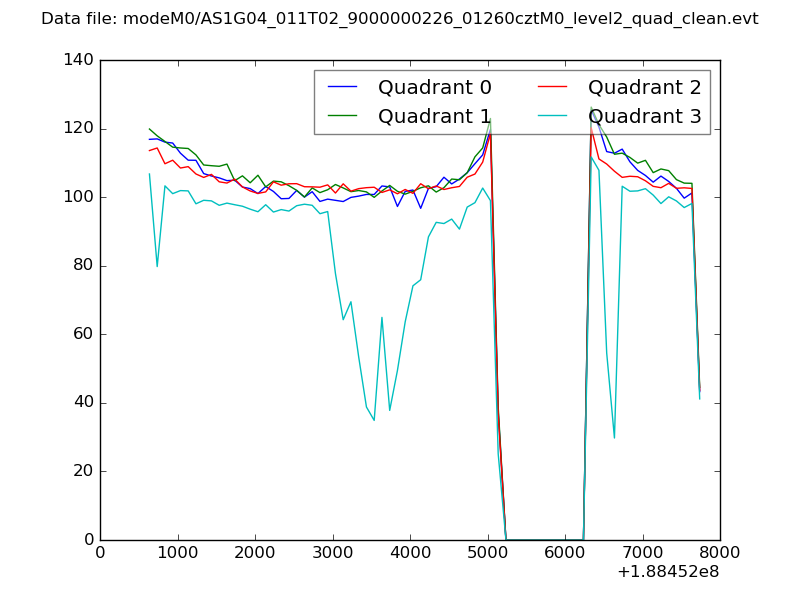 |
|
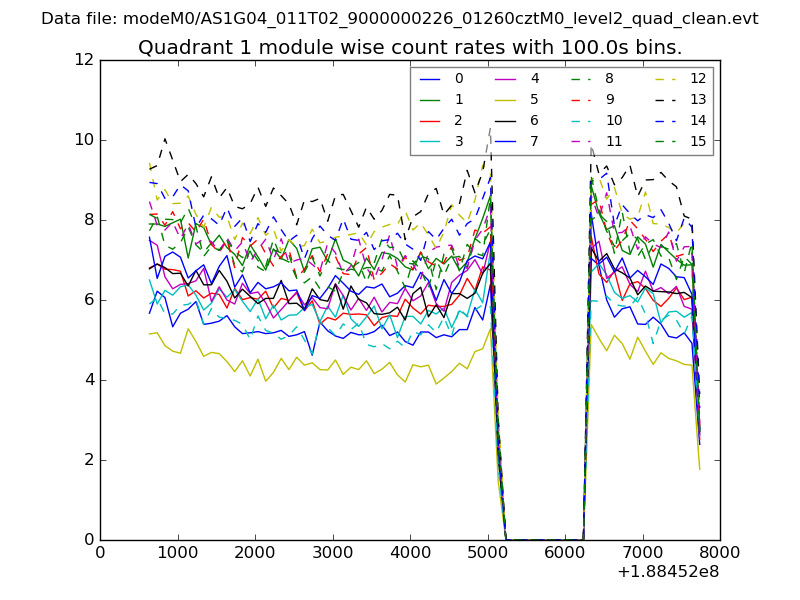
| Module-wise count rates for Quadrant A Data is divided into 100 sec bins |
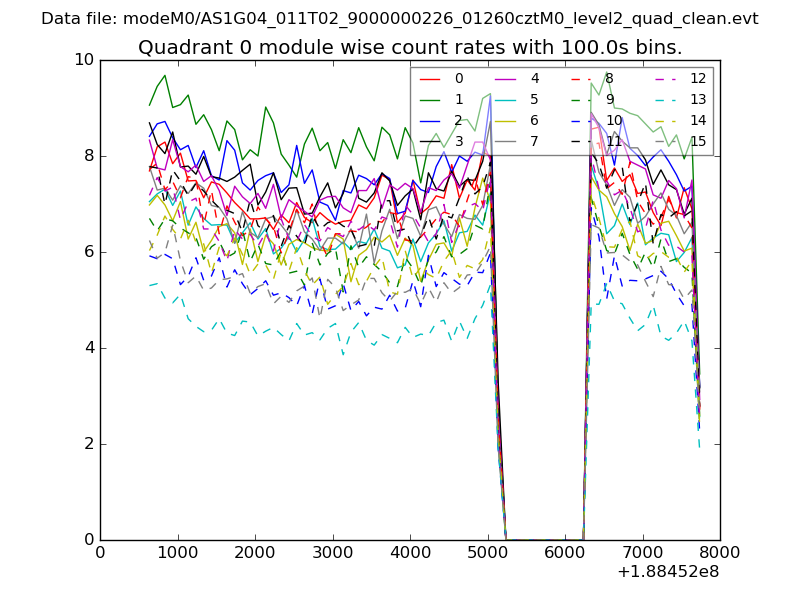 |
 |
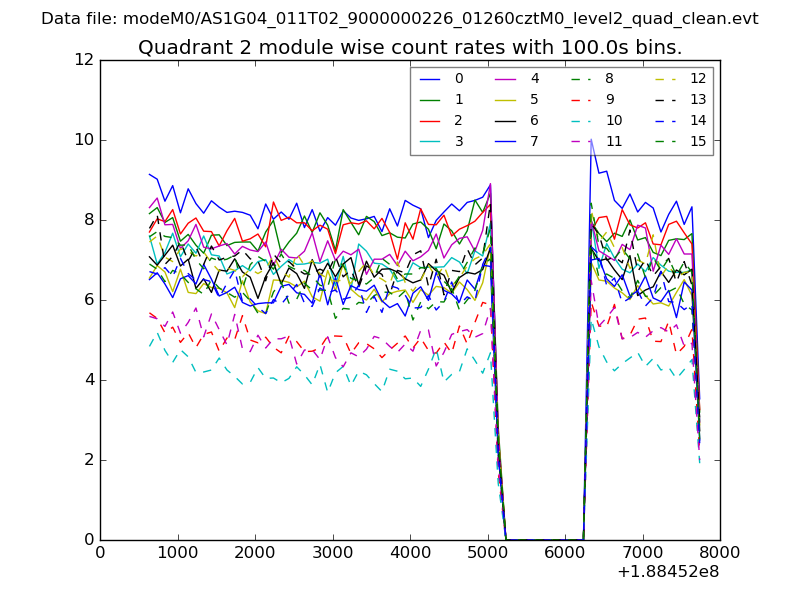
| Module-wise count rates for Quadrant B Data is divided into 100 sec bins |
 |
 |
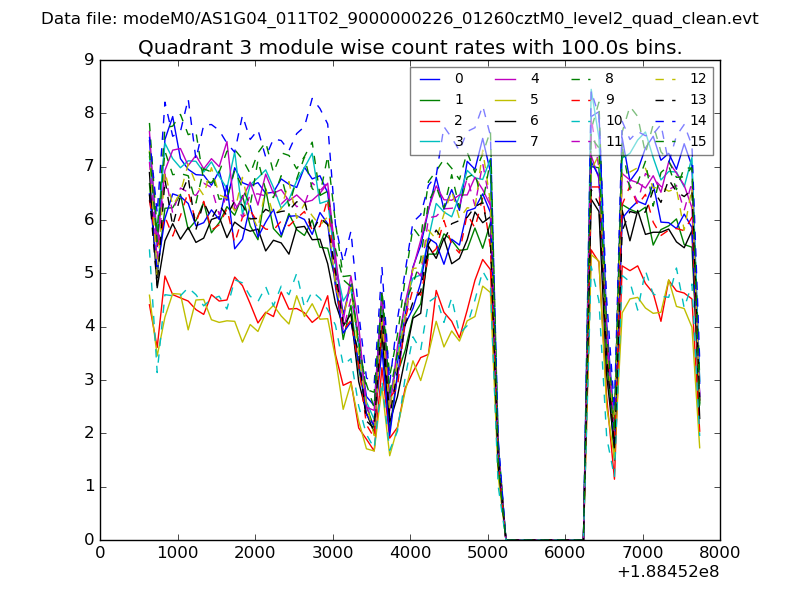
| Module-wise count rates for Quadrant C Data is divided into 100 sec bins |
 |
 |
| Module-wise count rates for Quadrant D Data is divided into 100 sec bins |
 |
 |
| Parameter | Plot |
|---|---|
| CZT HV Monitor | 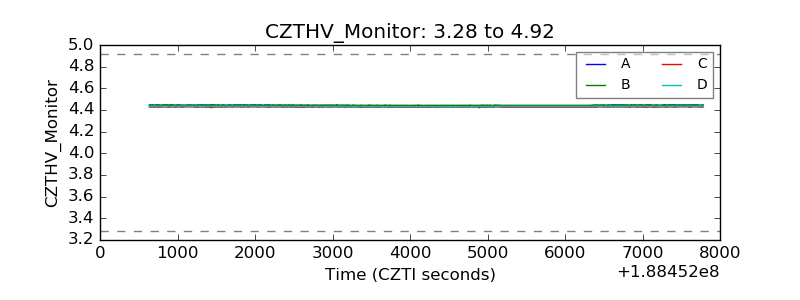 |
| D_VDD | 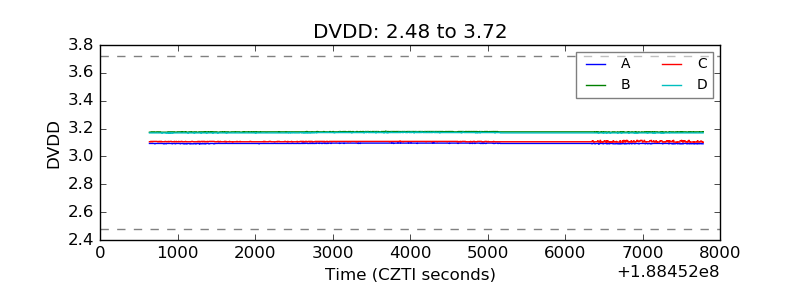 |
| Temperature 1 | 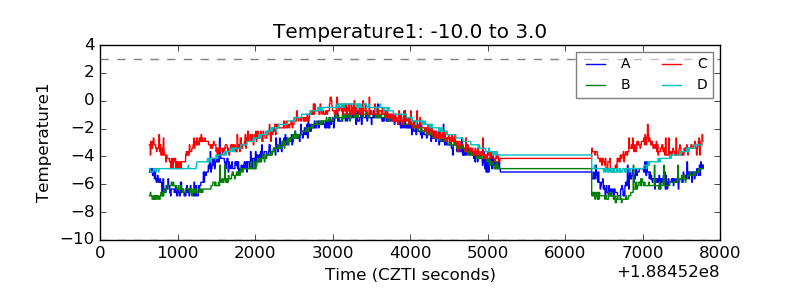 |
| Veto HV Monitor | 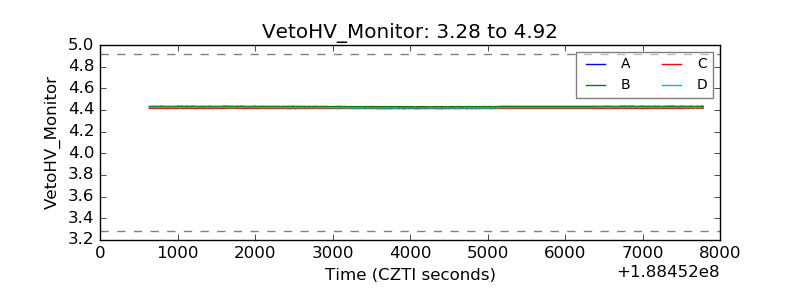 |
| Veto LLD | 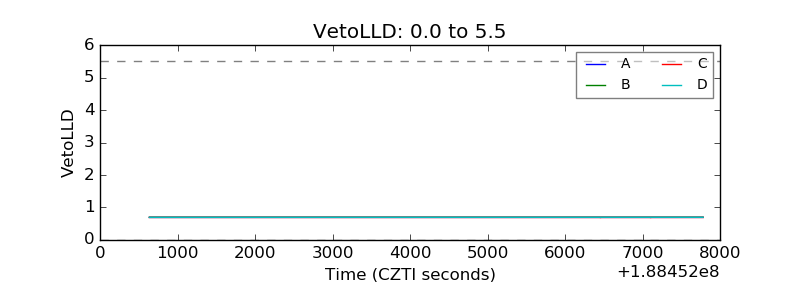 |
| Alpha Counter | 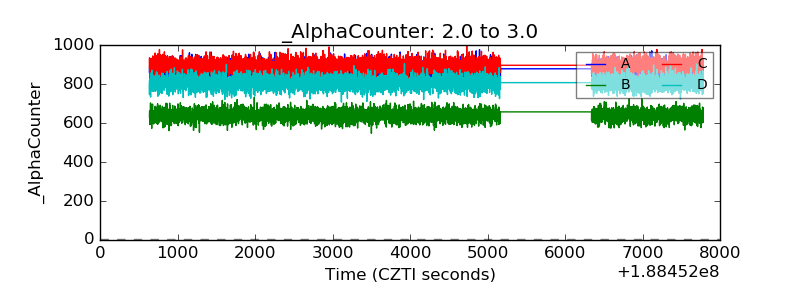 |
| _CPM_Rate | 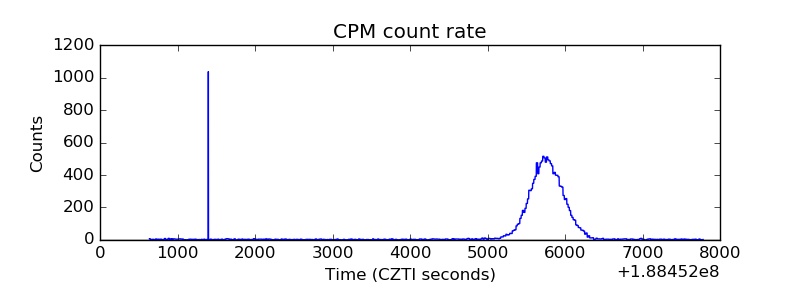 |
| CZT Counter | 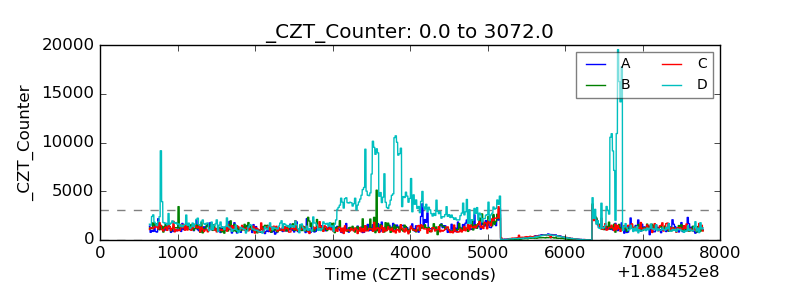 |
| +2.5 Volts monitor | 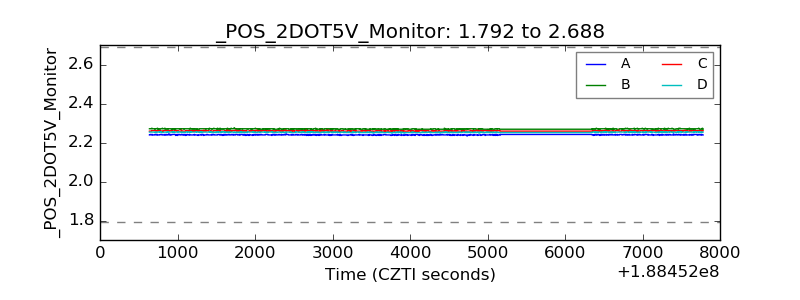 |
| +5 Volts monitor |  |
| _ROLL_ROT | 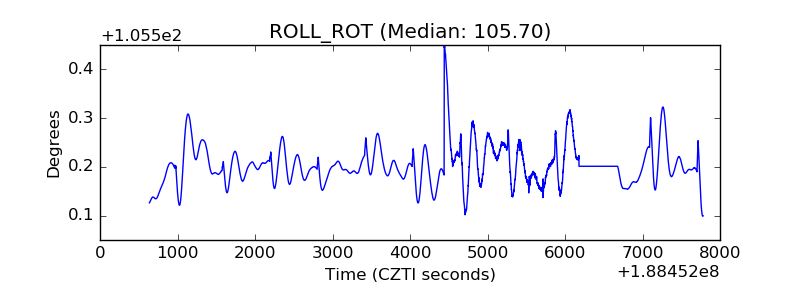 |
| _Roll_DEC | 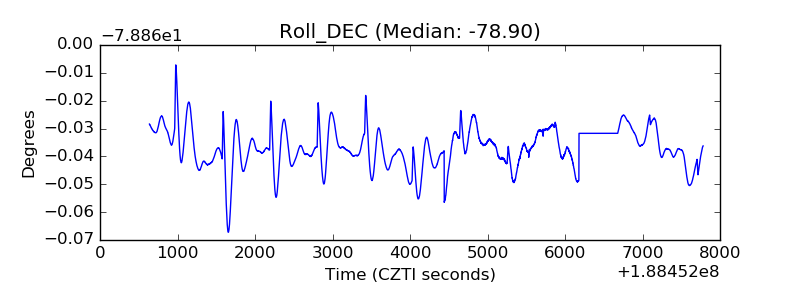 |
| _Roll_RA | 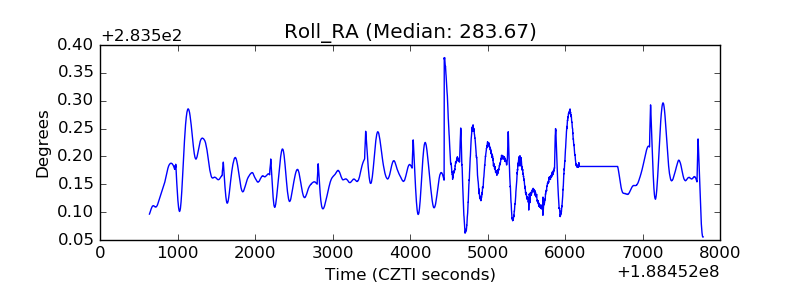 |
| Veto Counter | 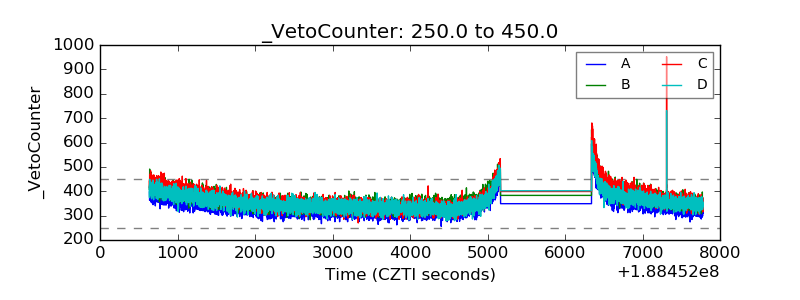 |