| Param | Original file | Final file |
|---|---|---|
| Filename | modeM0/AS1G04_011T02_9000000226_01261cztM0_level2.evt | modeM0/AS1G04_011T02_9000000226_01261cztM0_level2_quad_clean.evt |
| Size (bytes) | 1,117,918,080 | 99,912,960 |
| Size | 1.0 GB | 95.3 MB |
| Events in quadrant A | 8,711,887 | 647,959 |
| Events in quadrant B | 8,242,427 | 661,695 |
| Events in quadrant C | 7,885,254 | 652,939 |
| Events in quadrant D | 8,591,776 | 614,929 |
| Mode SS | |||
|---|---|---|---|
| Quadrant | BADHDUFLAG | Total packets | Discarded packets |
| A | 0 | 130 | 0 |
| B | 0 | 130 | 0 |
| C | 0 | 130 | 0 |
| D | 0 | 130 | 0 |
| Mode M9 | |||
|---|---|---|---|
| Quadrant | BADHDUFLAG | Total packets | Discarded packets |
| A | 0 | 9 | 0 |
| B | 0 | 9 | 0 |
| C | 0 | 9 | 0 |
| D | 0 | 9 | 0 |
| Mode M0 | |||
|---|---|---|---|
| Quadrant | BADHDUFLAG | Total packets | Discarded packets |
| A | 0 | 30499 | 2 |
| B | 0 | 29033 | 1 |
| C | 0 | 27982 | 1 |
| D | 0 | 30140 | 1 |
| Quadrant | Total seconds | Saturated seconds | Saturation percentage |
|---|---|---|---|
| A | 6425 | 277 | 4.311284% |
| B | 6425 | 66 | 1.027237% |
| C | 6425 | 78 | 1.214008% |
| D | 6425 | 359 | 5.587549% |
Noise dominated data is calculated using 1-second bins in cleaned event files. If a bin has >2000 counts, and if more than 50% of those come from <1% of pixels, then it is considered to be noise-dominated and hence unusable.
| Quadrant | # 1 sec bins | Bins with >0 counts | Bins with >2000 counts | High rate bins dominated by noise | Noise dominated (total time) | Noise dominated (detector-on time) | Marked lightcurve |
|---|---|---|---|---|---|---|---|
| A | 7335 | 6425 | 721 | 721 | 9.83% | 11.22% | 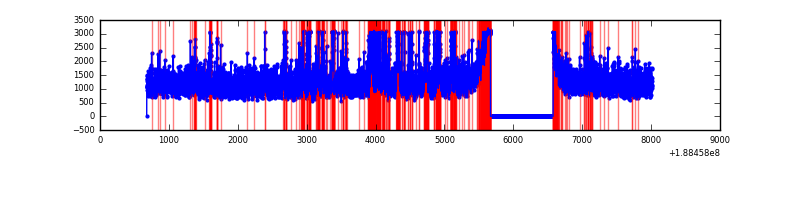 |
| B | 7335 | 6425 | 326 | 326 | 4.44% | 5.07% | 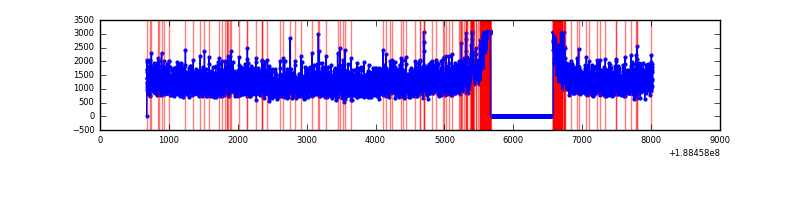 |
| C | 7334 | 6424 | 262 | 262 | 3.57% | 4.08% | 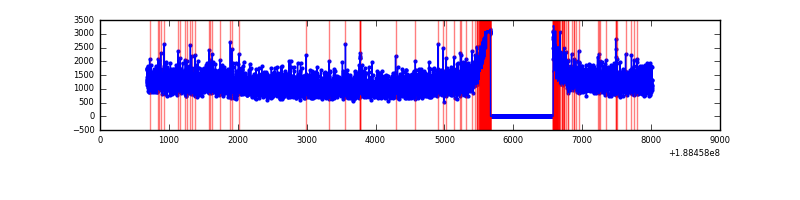 |
| D | 7335 | 6425 | 740 | 740 | 10.09% | 11.52% | 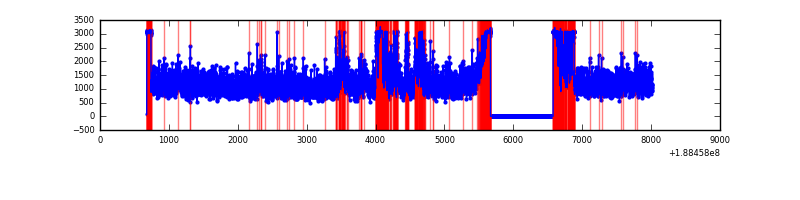 |
Top three noisy pixels from each quadrant. If the there are fewer than three noisy pixels in the level2.evt file, extra rows are filled as -1
| Pixel properties | Quadrant properties | ||||||
|---|---|---|---|---|---|---|---|
| Quadrant | DetID | PixID | Counts | Sigma | Mean | Median | Sigma |
| A | 4 | 32 | 1013364 | 2115.64 | 1999 | 2007 | 478.0 |
| A | 8 | 14 | 15435 | 28.09 | 1999 | 2007 | 478.0 |
| A | 11 | 79 | 8512 | 13.61 | 1999 | 2007 | 478.0 |
| B | 12 | 52 | 77411 | 154.32 | 2079 | 2085 | 488.1 |
| B | 15 | 22 | 60946 | 120.59 | 2079 | 2085 | 488.1 |
| B | 5 | 191 | 47998 | 94.06 | 2079 | 2085 | 488.1 |
| C | 15 | 241 | 285364 | 530.65 | 1925 | 1993 | 534.0 |
| C | 3 | 79 | 40213 | 71.57 | 1925 | 1993 | 534.0 |
| C | 3 | 111 | 30715 | 53.79 | 1925 | 1993 | 534.0 |
| D | 13 | 169 | 873695 | 1542.8 | 1833 | 1901 | 565.1 |
| D | 10 | 84 | 602802 | 1063.41 | 1833 | 1901 | 565.1 |
| D | 2 | 88 | 183681 | 321.69 | 1833 | 1901 | 565.1 |
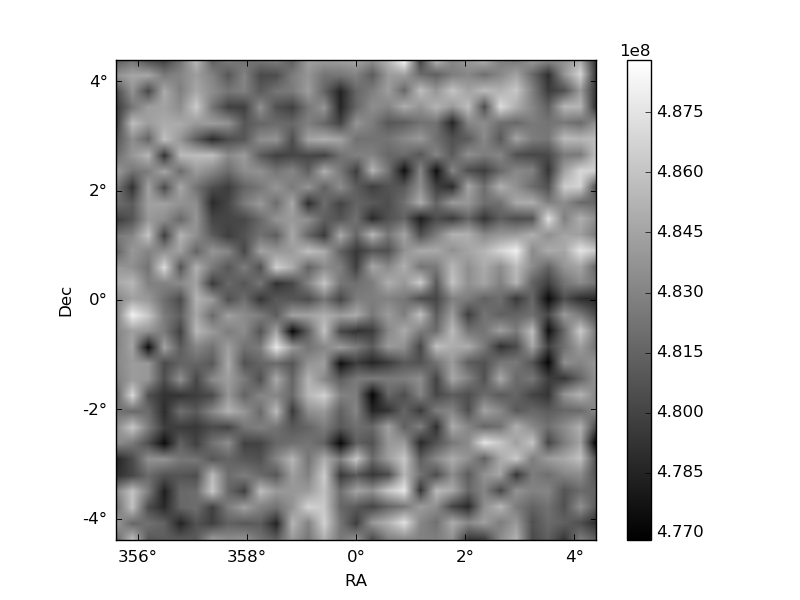
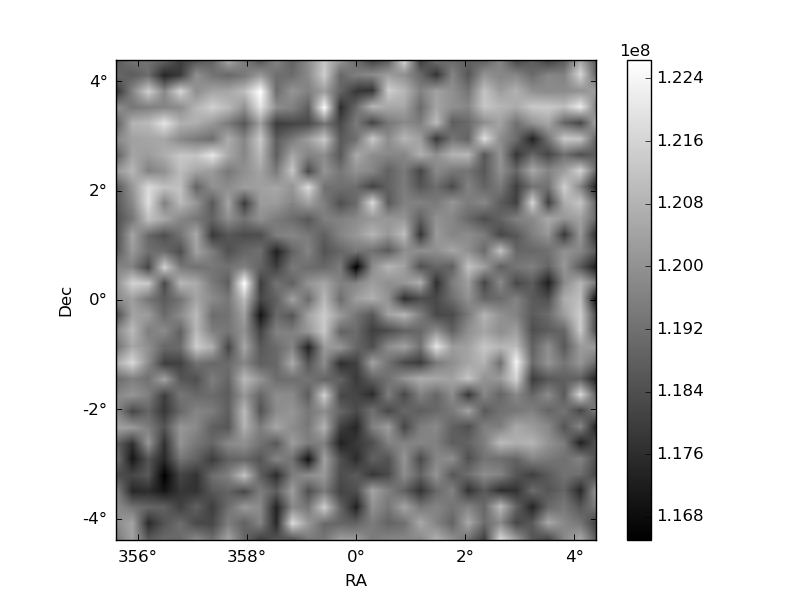
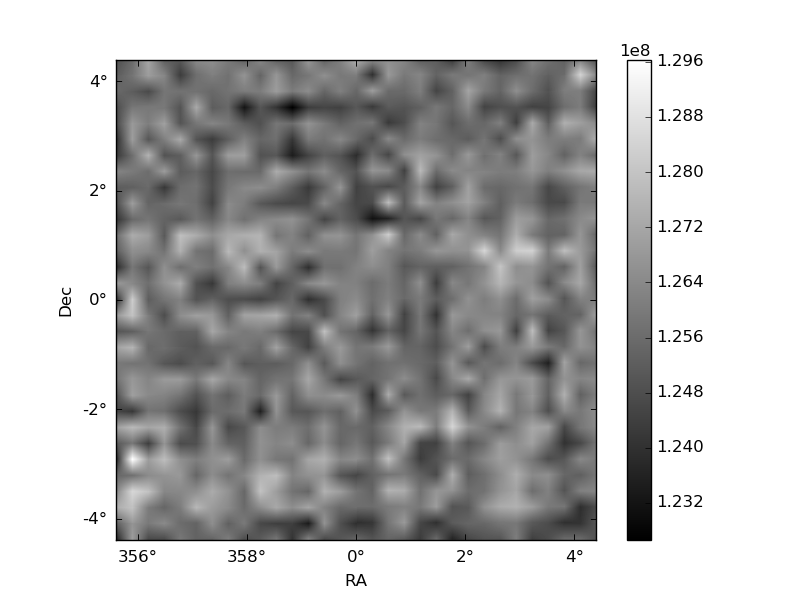
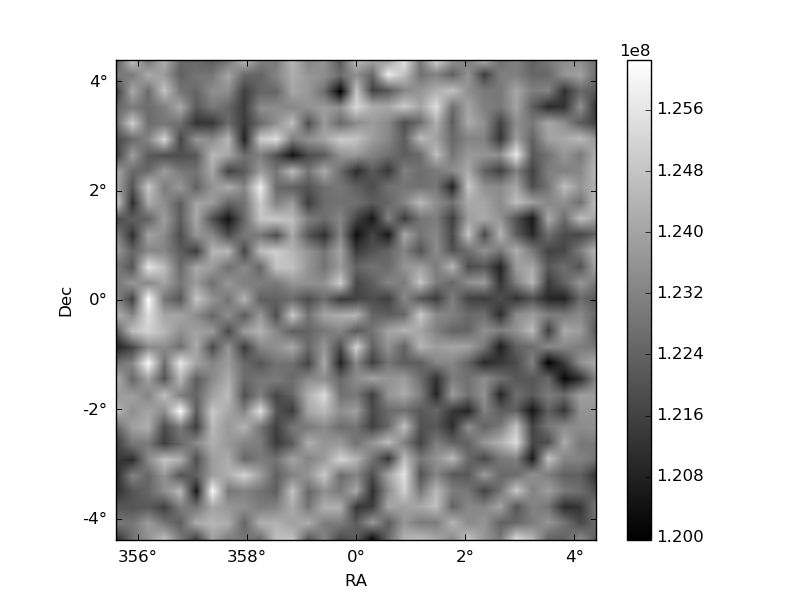
Histogram calculated using DETX and DETY for each event in the final _common_clean file
| Quadrant A | 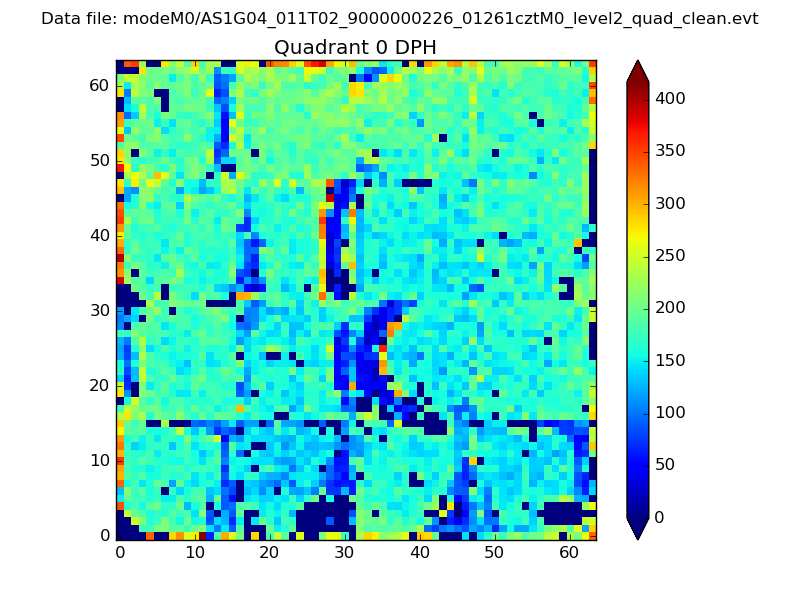 |
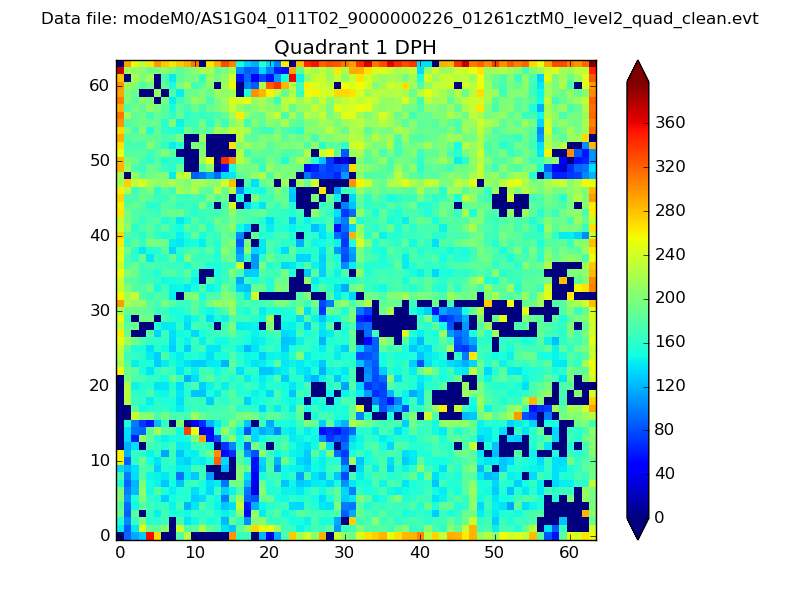 |
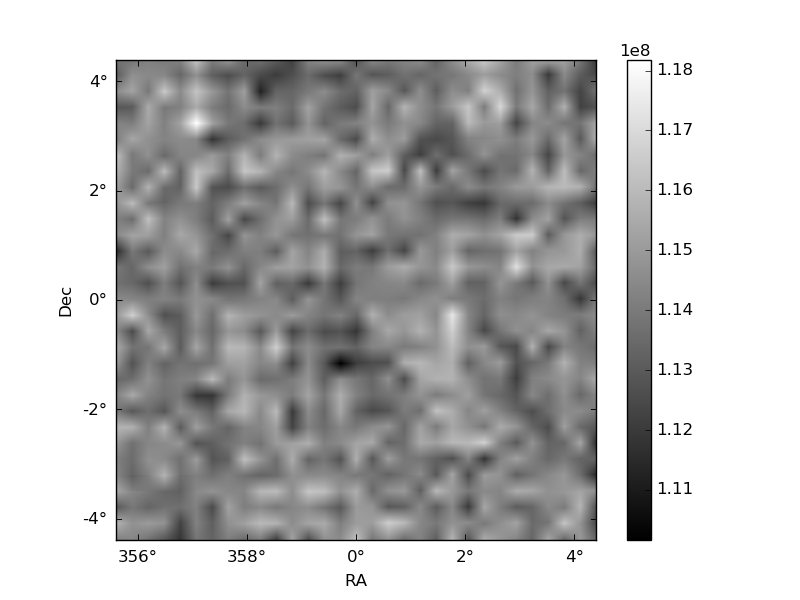
Quadrant B |
|---|---|---|---|
| Quadrant D | 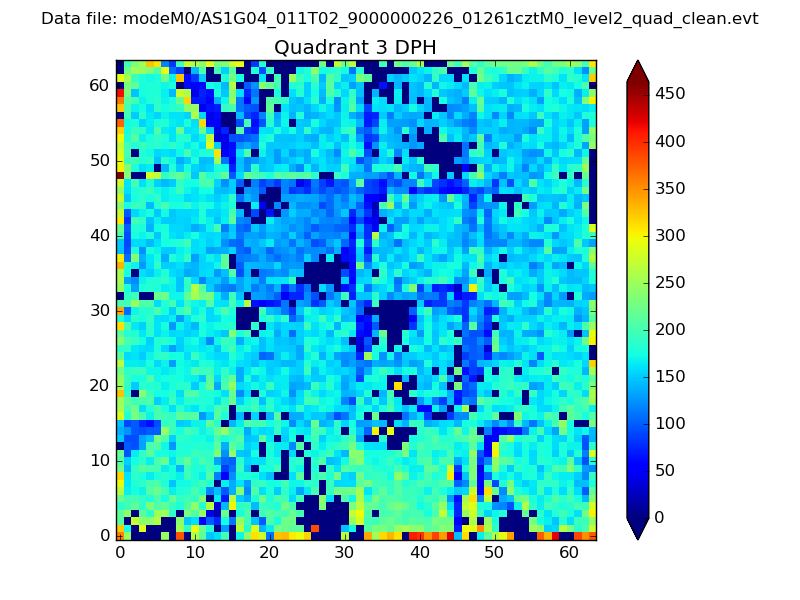 |
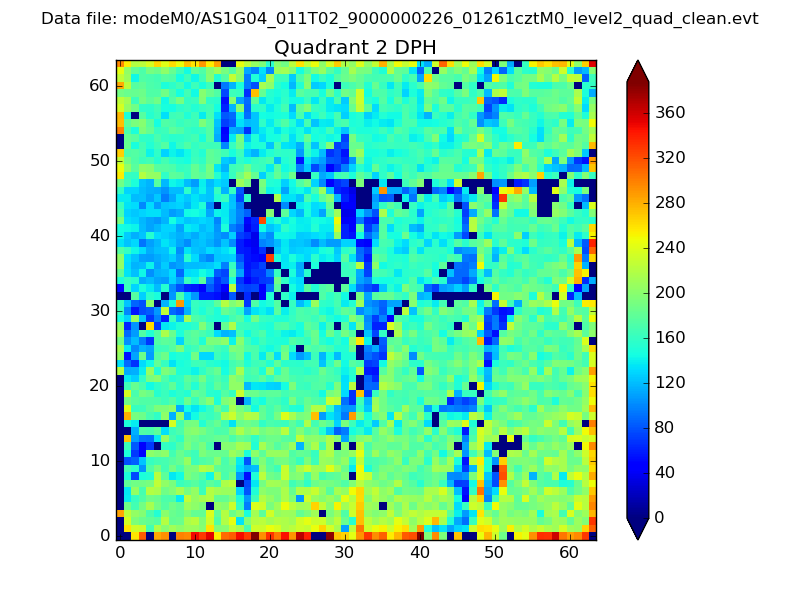 |
Quadrant C |
| Plot type | Count rate plots | Images |
|---|---|---|
| Comparison with Poisson distribution Blue bars denote a histogram of data divided into 1 sec bins. Red curve is a Poisson curve with rate = median count rate of data. |
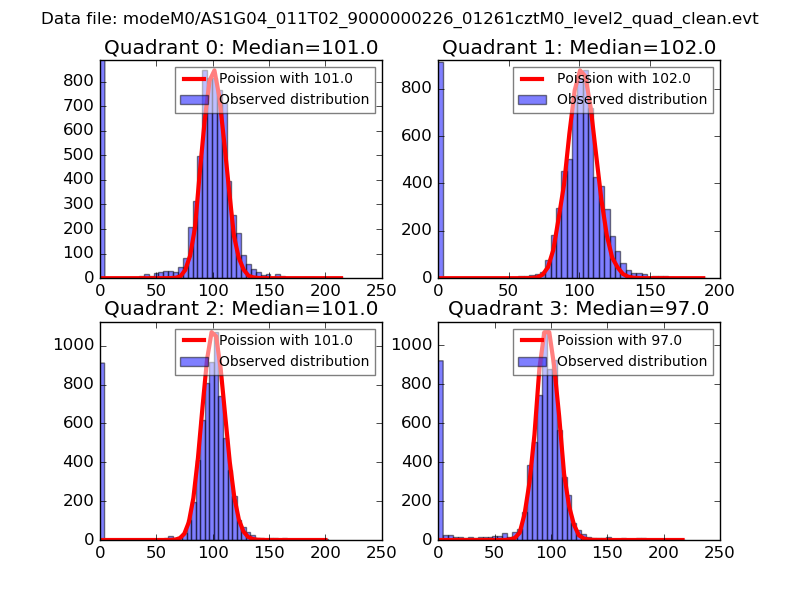 |
 |
| Quadrant-wise count rates Data is divided into 100 sec bins |
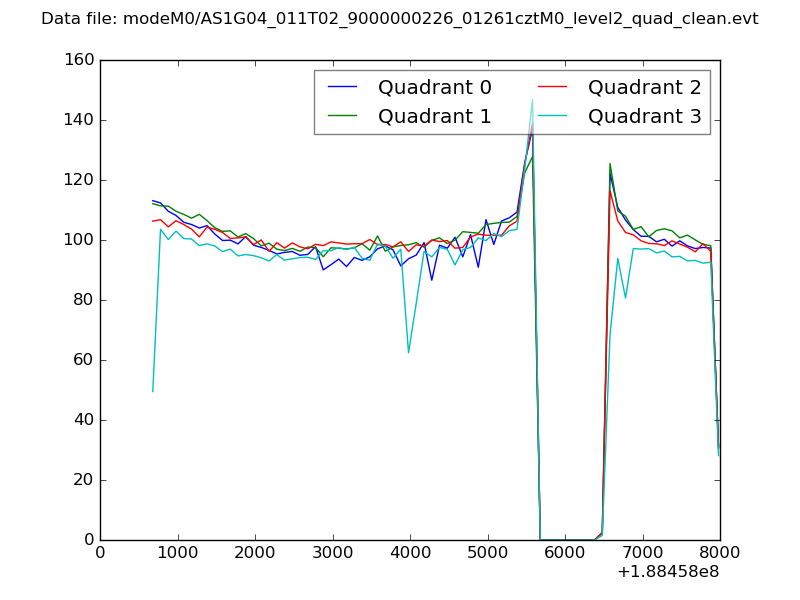 |
|
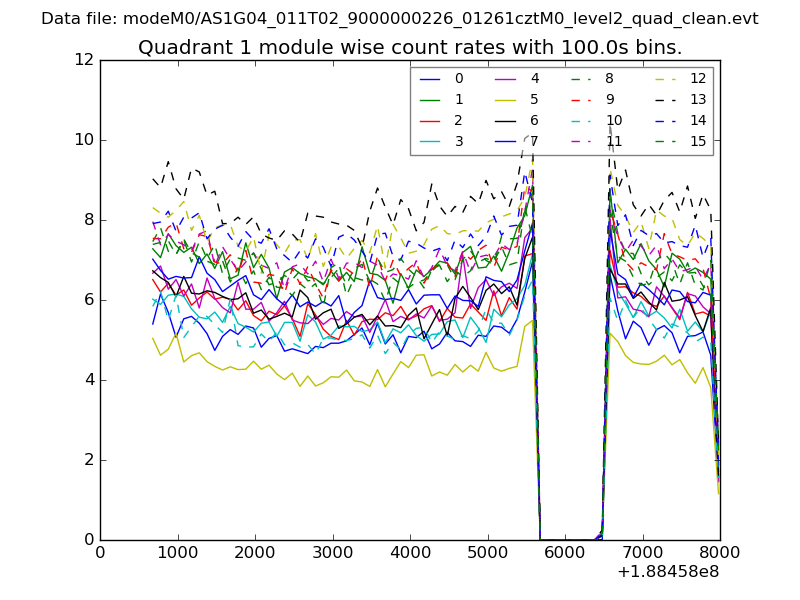
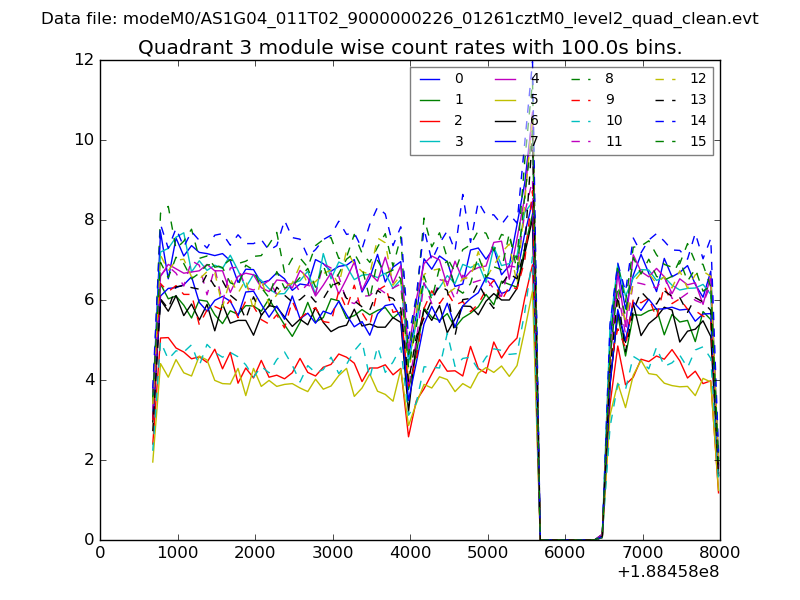
| Module-wise count rates for Quadrant A Data is divided into 100 sec bins |
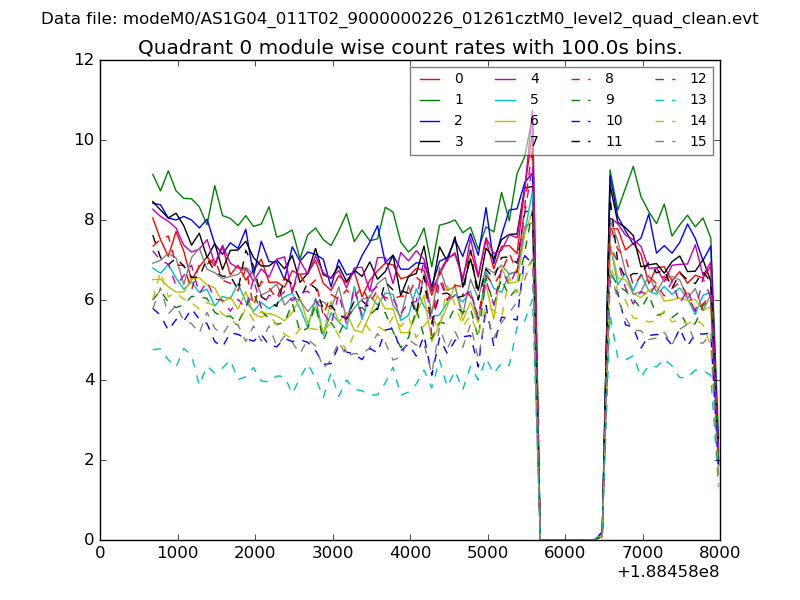 |
 |
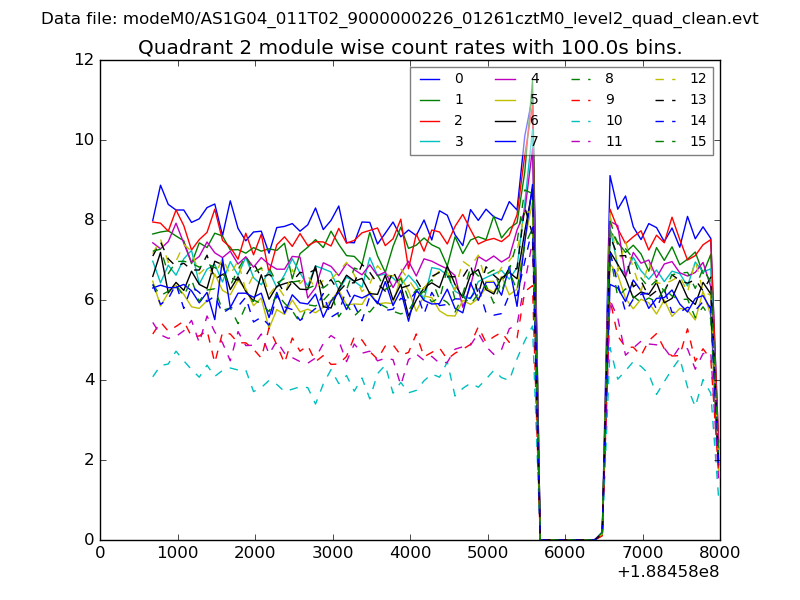
| Module-wise count rates for Quadrant B Data is divided into 100 sec bins |
 |
 |
| Module-wise count rates for Quadrant C Data is divided into 100 sec bins |
 |
 |
| Module-wise count rates for Quadrant D Data is divided into 100 sec bins |
 |
 |
| Parameter | Plot |
|---|---|
| CZT HV Monitor | 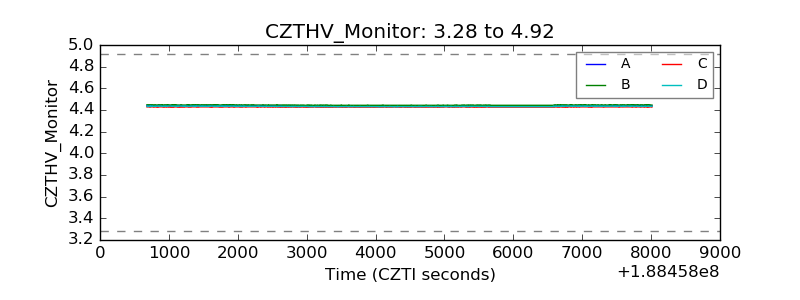 |
| D_VDD | 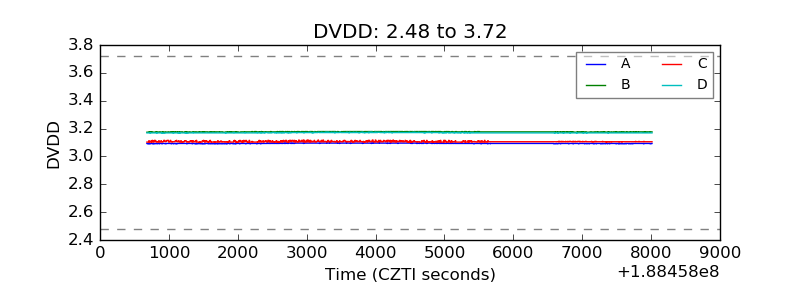 |
| Temperature 1 | 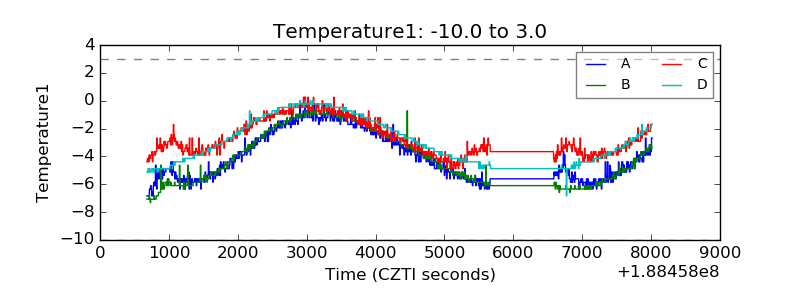 |
| Veto HV Monitor | 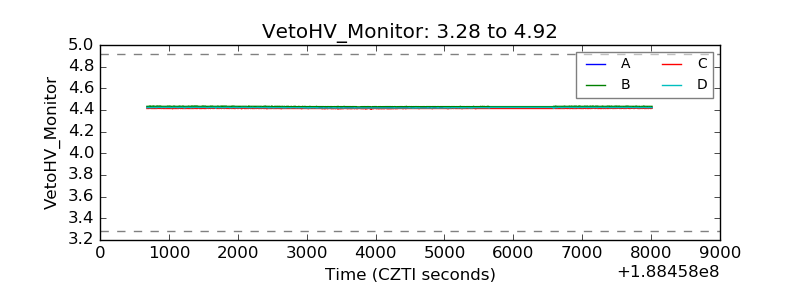 |
| Veto LLD | 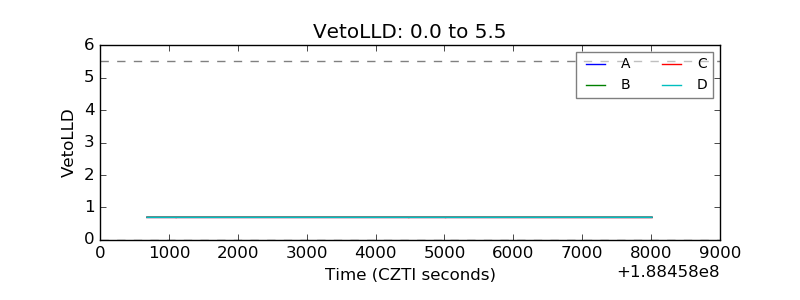 |
| Alpha Counter | 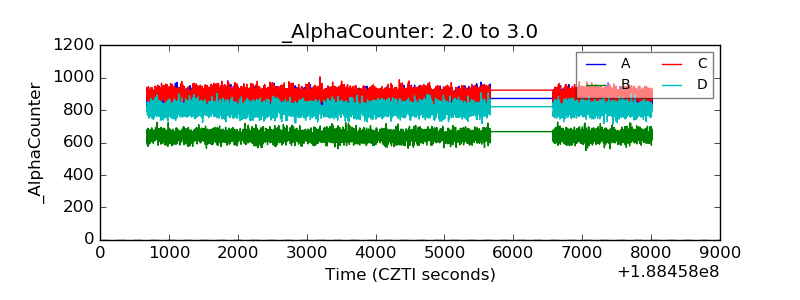 |
| _CPM_Rate | 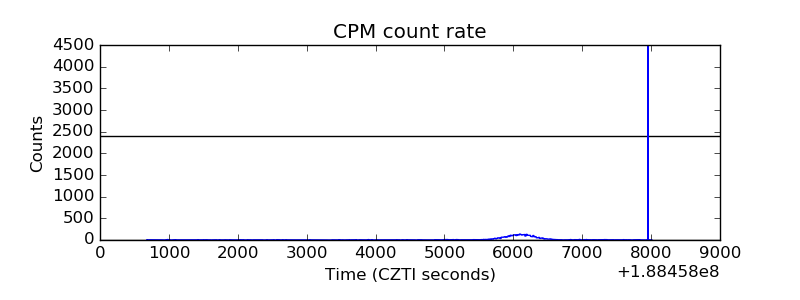 |
| CZT Counter | 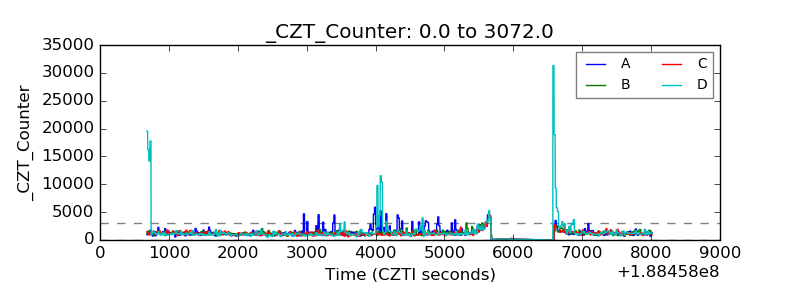 |
| +2.5 Volts monitor |  |
| +5 Volts monitor |  |
| _ROLL_ROT | 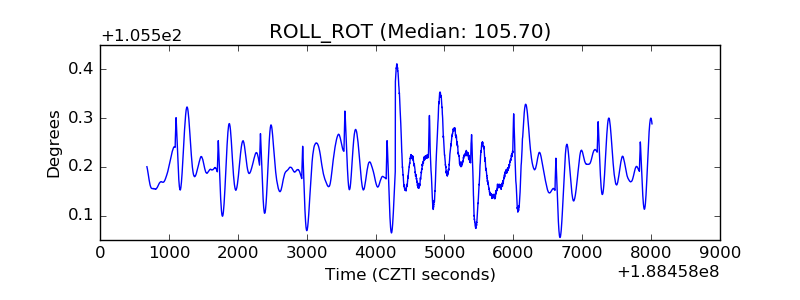 |
| _Roll_DEC | 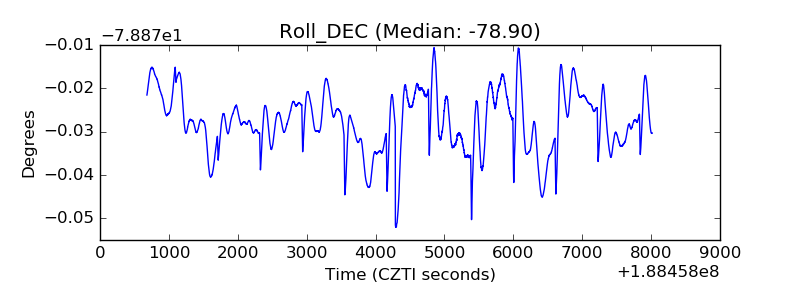 |
| _Roll_RA |  |
| Veto Counter | 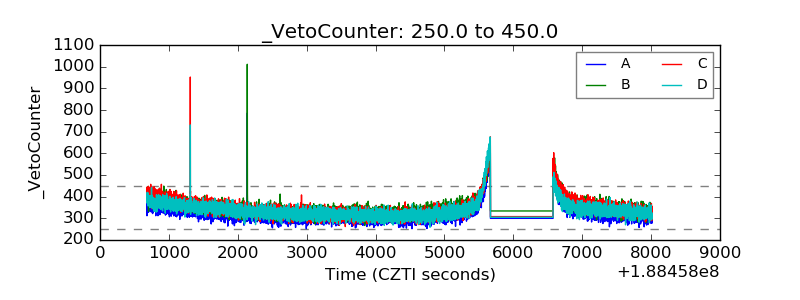 |