| Param | Original file | Final file |
|---|---|---|
| Filename | modeM0/AS1G04_011T02_9000000226_01262cztM0_level2.evt | modeM0/AS1G04_011T02_9000000226_01262cztM0_level2_quad_clean.evt |
| Size (bytes) | 1,250,593,920 | 106,061,760 |
| Size | 1.2 GB | 101.1 MB |
| Events in quadrant A | 9,176,806 | 691,252 |
| Events in quadrant B | 9,416,122 | 694,965 |
| Events in quadrant C | 8,592,995 | 689,981 |
| Events in quadrant D | 10,228,405 | 650,163 |
| Mode SS | |||
|---|---|---|---|
| Quadrant | BADHDUFLAG | Total packets | Discarded packets |
| A | 0 | 142 | 0 |
| B | 0 | 142 | 0 |
| C | 0 | 142 | 0 |
| D | 0 | 142 | 0 |
| Mode M9 | |||
|---|---|---|---|
| Quadrant | BADHDUFLAG | Total packets | Discarded packets |
| A | 0 | 4 | 0 |
| B | 0 | 4 | 0 |
| C | 0 | 4 | 0 |
| D | 0 | 4 | 0 |
| Mode M0 | |||
|---|---|---|---|
| Quadrant | BADHDUFLAG | Total packets | Discarded packets |
| A | 0 | 32239 | 2 |
| B | 0 | 32904 | 1 |
| C | 0 | 30466 | 1 |
| D | 0 | 35397 | 1 |
| Quadrant | Total seconds | Saturated seconds | Saturation percentage |
|---|---|---|---|
| A | 6968 | 228 | 3.272101% |
| B | 6968 | 104 | 1.492537% |
| C | 6968 | 74 | 1.061998% |
| D | 6968 | 450 | 6.458094% |
Noise dominated data is calculated using 1-second bins in cleaned event files. If a bin has >2000 counts, and if more than 50% of those come from <1% of pixels, then it is considered to be noise-dominated and hence unusable.
| Quadrant | # 1 sec bins | Bins with >0 counts | Bins with >2000 counts | High rate bins dominated by noise | Noise dominated (total time) | Noise dominated (detector-on time) | Marked lightcurve |
|---|---|---|---|---|---|---|---|
| A | 7422 | 6967 | 621 | 621 | 8.37% | 8.91% | 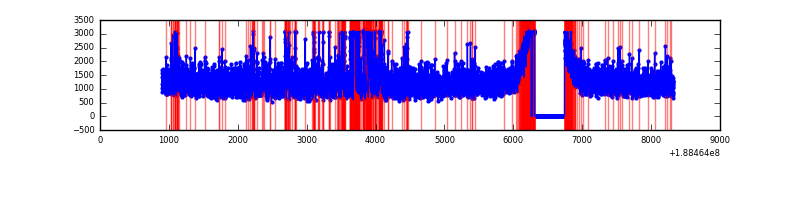 |
| B | 7422 | 6967 | 563 | 563 | 7.59% | 8.08% | 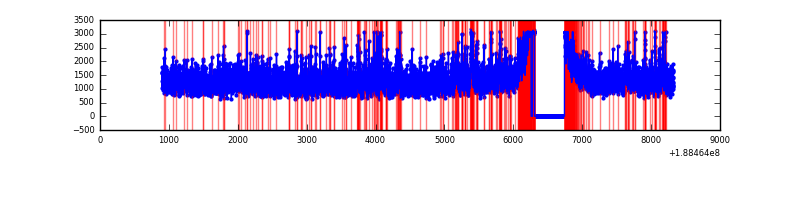 |
| C | 7422 | 6967 | 357 | 357 | 4.81% | 5.12% |  |
| D | 7422 | 6967 | 1183 | 1183 | 15.94% | 16.98% | 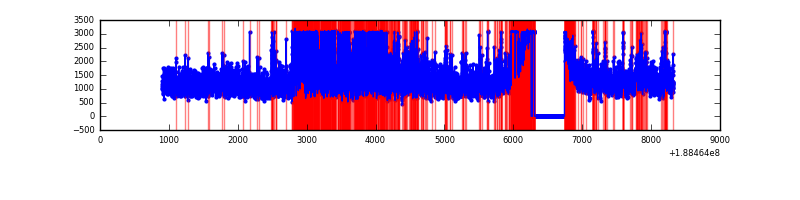 |
Top three noisy pixels from each quadrant. If the there are fewer than three noisy pixels in the level2.evt file, extra rows are filled as -1
| Pixel properties | Quadrant properties | ||||||
|---|---|---|---|---|---|---|---|
| Quadrant | DetID | PixID | Counts | Sigma | Mean | Median | Sigma |
| A | 4 | 32 | 673683 | 1261.56 | 2193 | 2200 | 532.3 |
| A | 8 | 14 | 77378 | 141.24 | 2193 | 2200 | 532.3 |
| A | 11 | 79 | 9353 | 13.44 | 2193 | 2200 | 532.3 |
| B | 8 | 4 | 322431 | 597.59 | 2266 | 2271 | 535.8 |
| B | 12 | 52 | 119451 | 218.72 | 2266 | 2271 | 535.8 |
| B | 15 | 22 | 108341 | 197.98 | 2266 | 2271 | 535.8 |
| C | 15 | 241 | 318687 | 541.77 | 2089 | 2160 | 584.2 |
| C | 4 | 252 | 46280 | 75.52 | 2089 | 2160 | 584.2 |
| C | 3 | 79 | 36884 | 59.43 | 2089 | 2160 | 584.2 |
| D | 13 | 169 | 1873626 | 3015.96 | 2002 | 2077 | 620.5 |
| D | 10 | 84 | 457887 | 734.53 | 2002 | 2077 | 620.5 |
| D | 12 | 22 | 285159 | 456.18 | 2002 | 2077 | 620.5 |
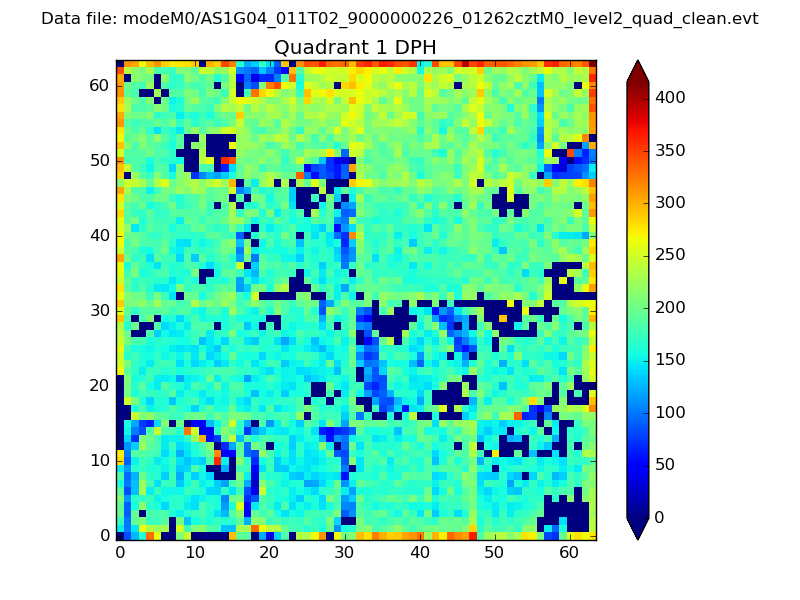
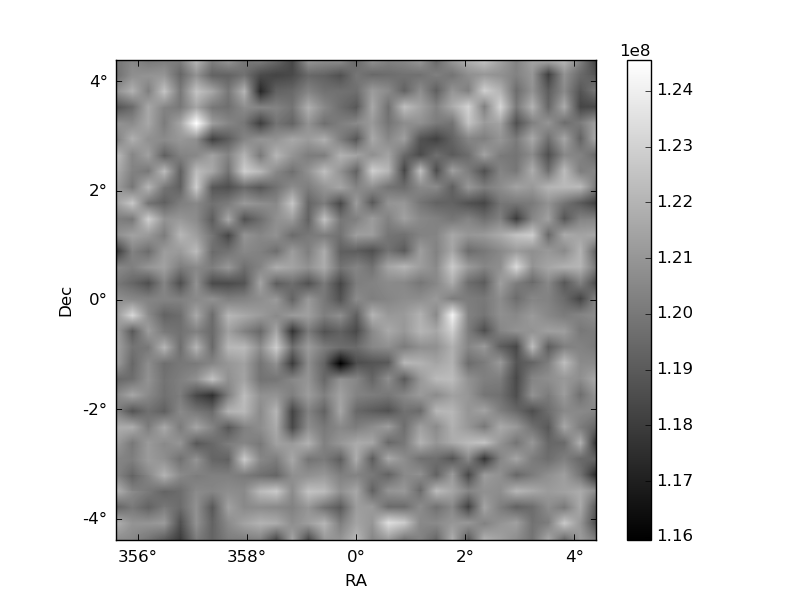
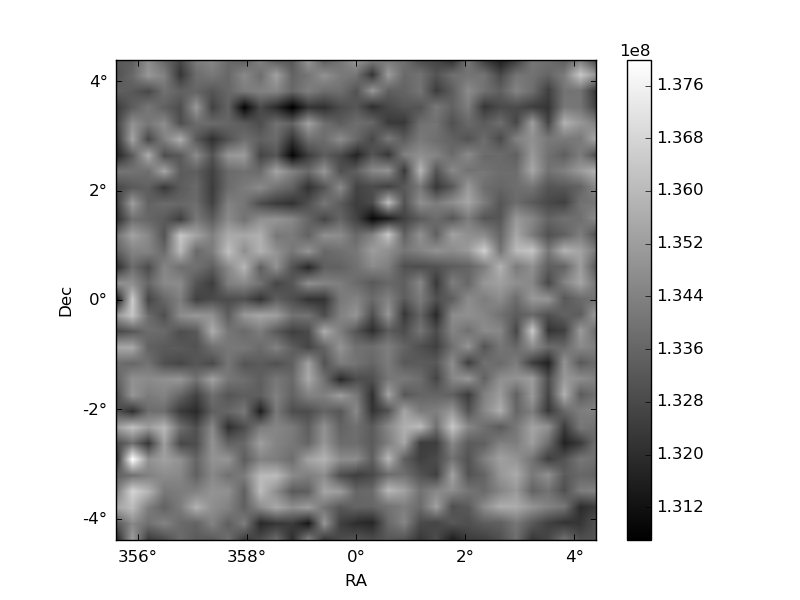
Histogram calculated using DETX and DETY for each event in the final _common_clean file
| Quadrant A | 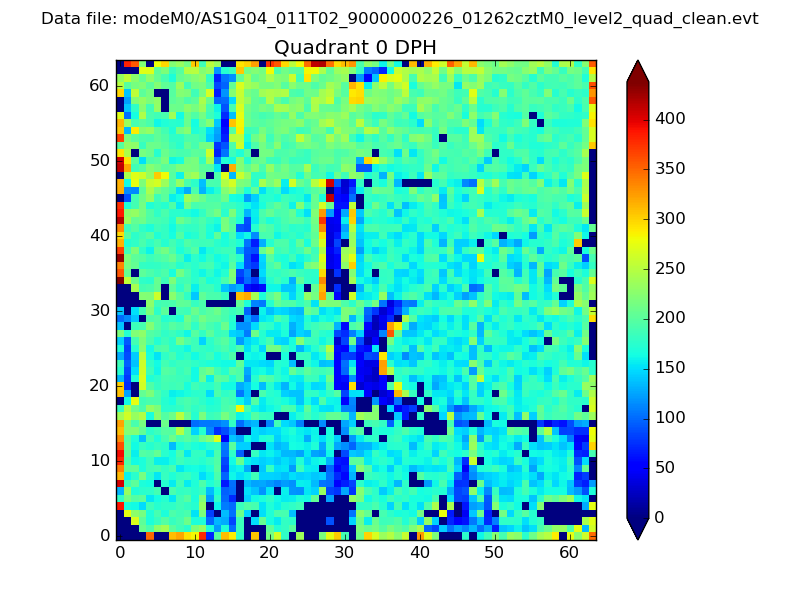 |
 |
Quadrant B |
|---|---|---|---|
| Quadrant D | 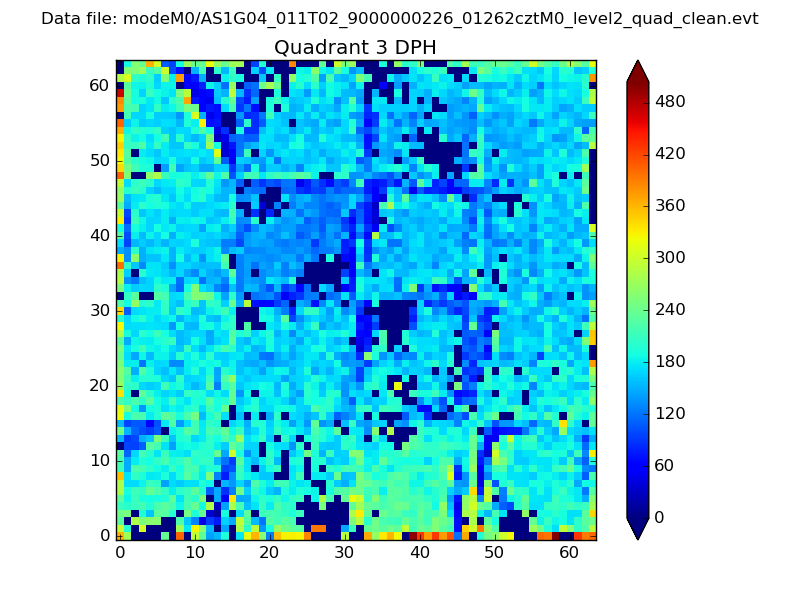 |
 |
Quadrant C |
| Plot type | Count rate plots | Images |
|---|---|---|
| Comparison with Poisson distribution Blue bars denote a histogram of data divided into 1 sec bins. Red curve is a Poisson curve with rate = median count rate of data. |
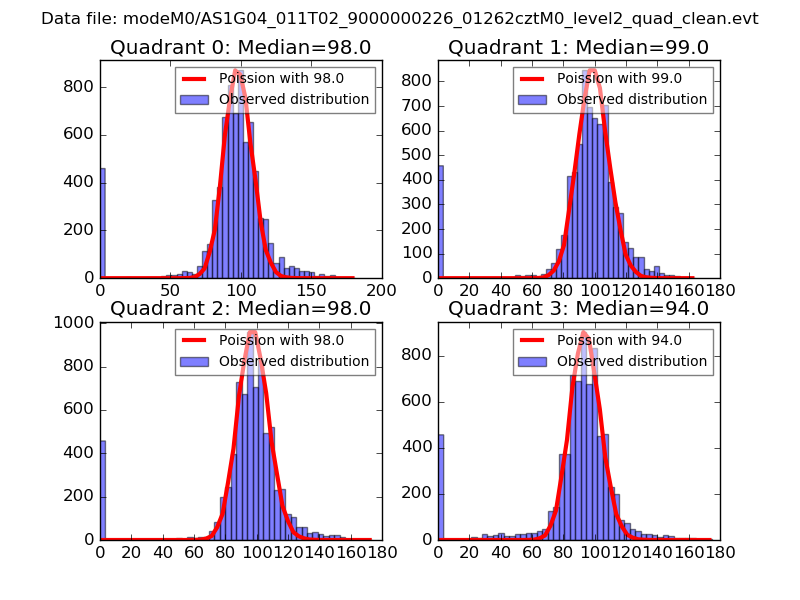 |
 |
| Quadrant-wise count rates Data is divided into 100 sec bins |
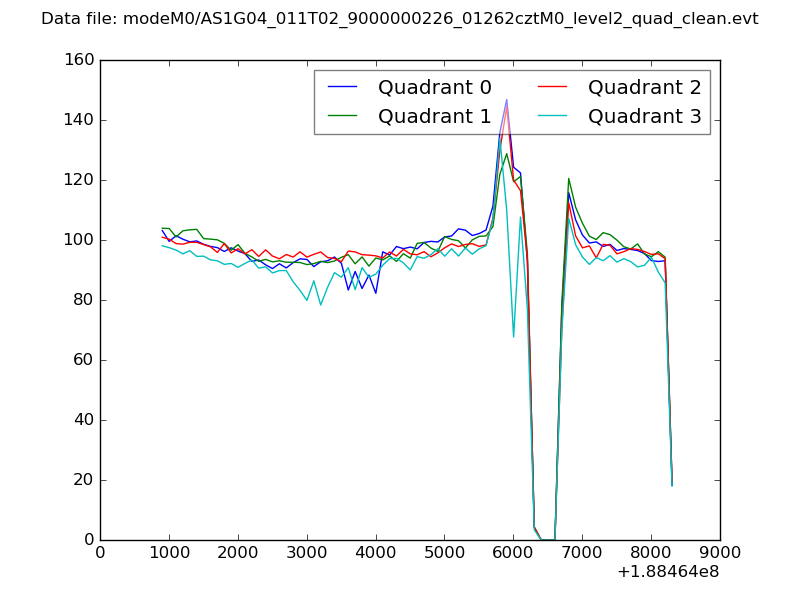 |
|
| Module-wise count rates for Quadrant A Data is divided into 100 sec bins |
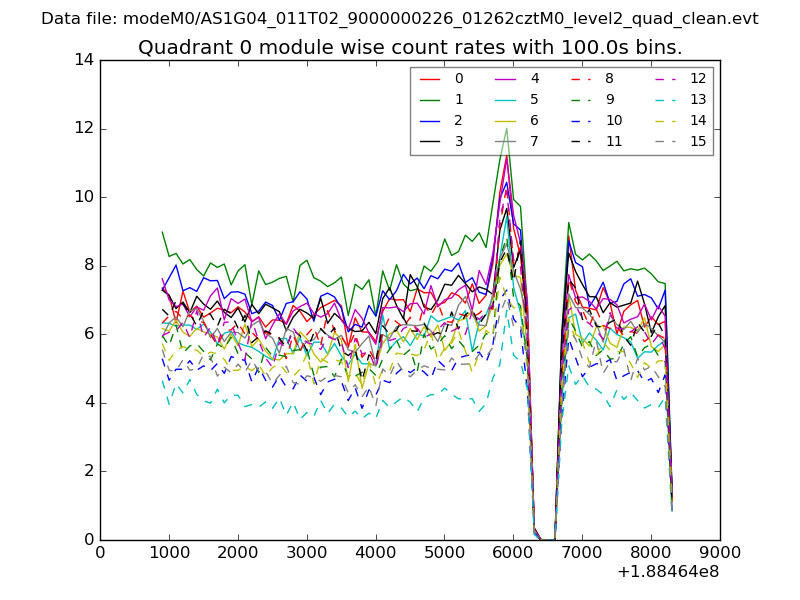 |
 |
| Module-wise count rates for Quadrant B Data is divided into 100 sec bins |
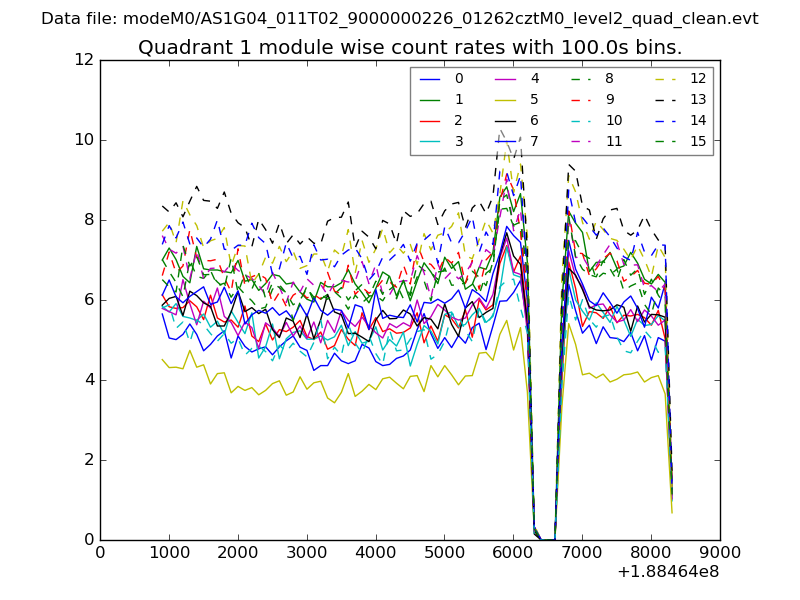 |
 |
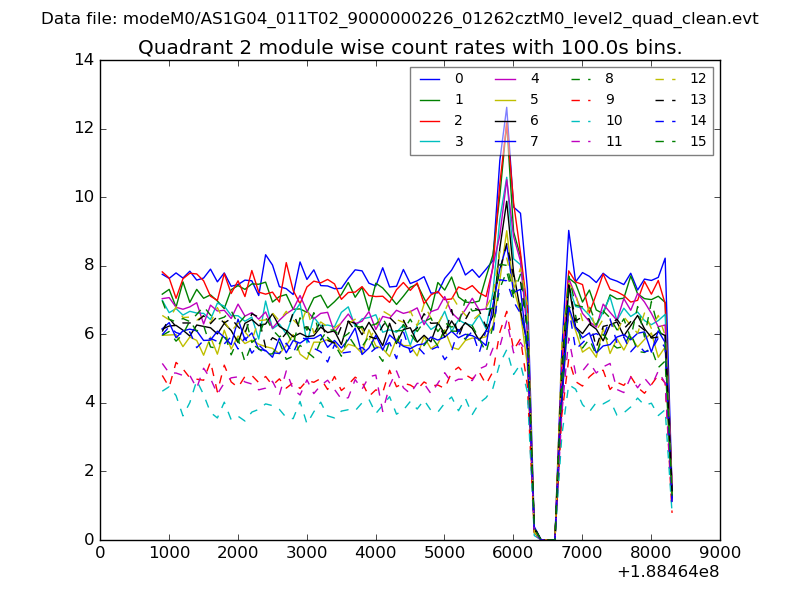
| Module-wise count rates for Quadrant C Data is divided into 100 sec bins |
 |
 |
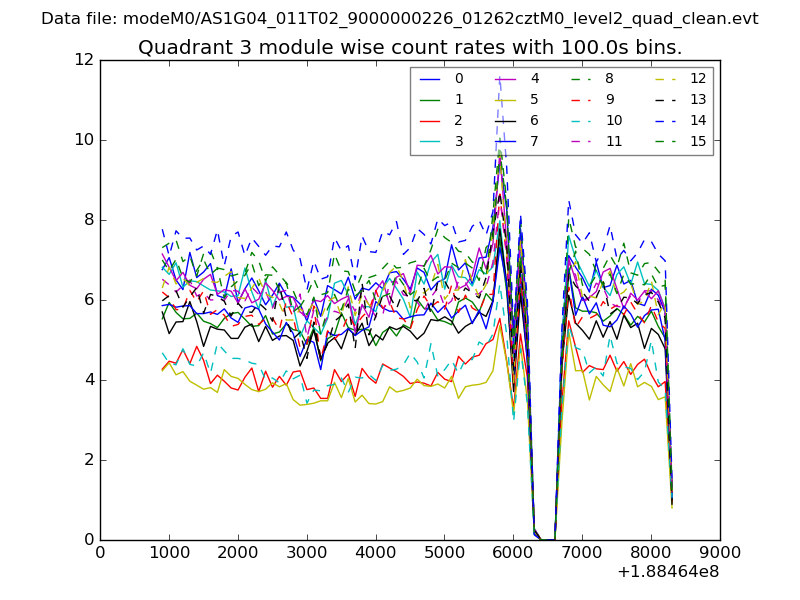
| Module-wise count rates for Quadrant D Data is divided into 100 sec bins |
 |
 |
| Parameter | Plot |
|---|---|
| CZT HV Monitor | 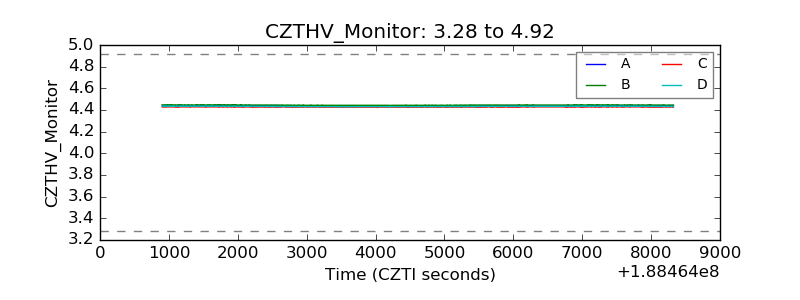 |
| D_VDD |  |
| Temperature 1 |  |
| Veto HV Monitor | 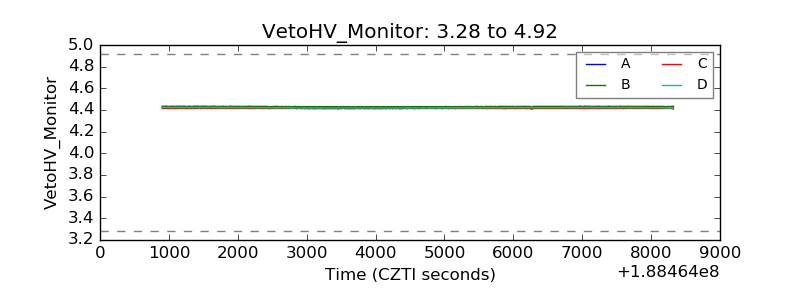 |
| Veto LLD | 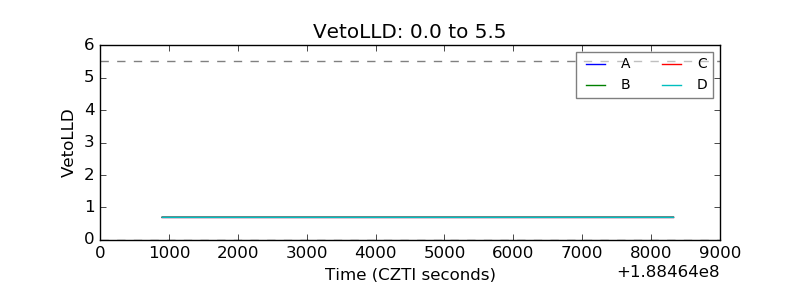 |
| Alpha Counter | 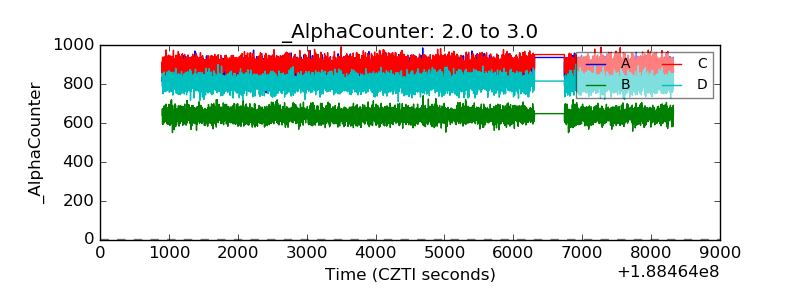 |
| _CPM_Rate | 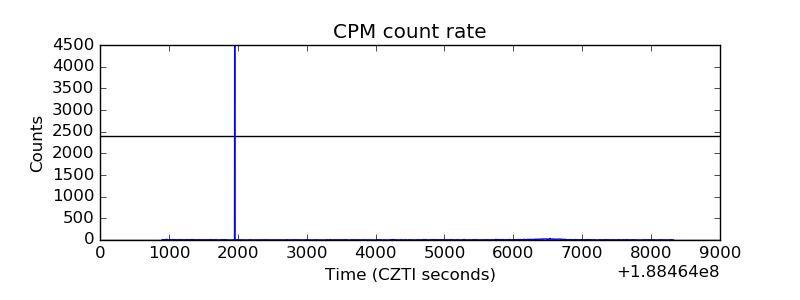 |
| CZT Counter | 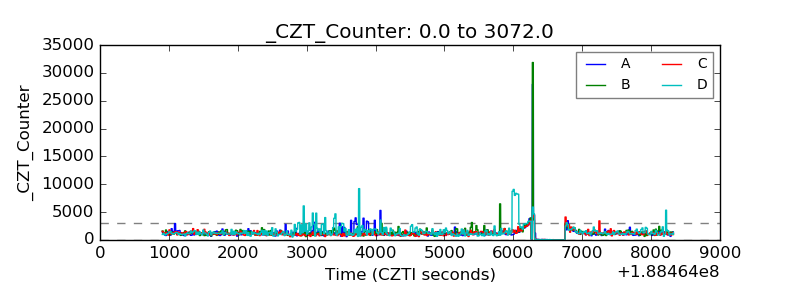 |
| +2.5 Volts monitor | 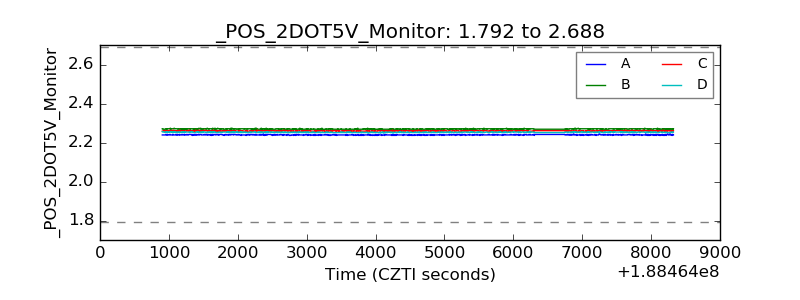 |
| +5 Volts monitor |  |
| _ROLL_ROT | 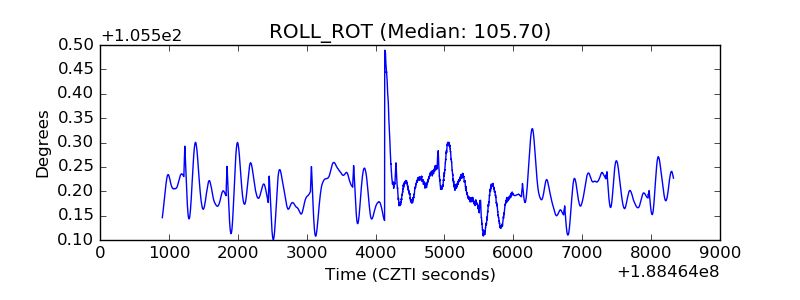 |
| _Roll_DEC | 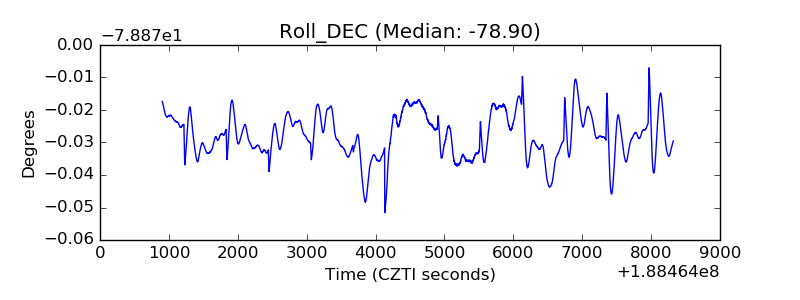 |
| _Roll_RA | 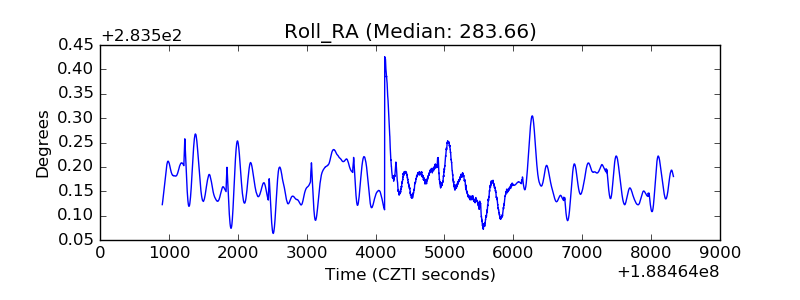 |
| Veto Counter | 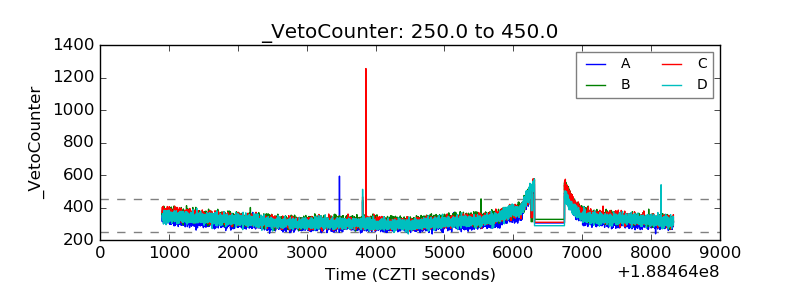 |