| Param | Original file | Final file |
|---|---|---|
| Filename | modeM0/AS1G04_011T02_9000000226_01263cztM0_level2.evt | modeM0/AS1G04_011T02_9000000226_01263cztM0_level2_quad_clean.evt |
| Size (bytes) | 1,309,896,000 | 111,816,000 |
| Size | 1.2 GB | 106.6 MB |
| Events in quadrant A | 9,109,281 | 731,046 |
| Events in quadrant B | 10,403,859 | 723,650 |
| Events in quadrant C | 8,955,128 | 725,786 |
| Events in quadrant D | 10,715,533 | 692,738 |
| Mode SS | |||
|---|---|---|---|
| Quadrant | BADHDUFLAG | Total packets | Discarded packets |
| A | 0 | 148 | 0 |
| B | 0 | 148 | 0 |
| C | 0 | 148 | 0 |
| D | 0 | 148 | 0 |
| Mode M0 | |||
|---|---|---|---|
| Quadrant | BADHDUFLAG | Total packets | Discarded packets |
| A | 0 | 32279 | 1 |
| B | 0 | 36084 | 0 |
| C | 0 | 31825 | 0 |
| D | 0 | 37139 | 0 |
| Quadrant | Total seconds | Saturated seconds | Saturation percentage |
|---|---|---|---|
| A | 7371 | 23 | 0.312034% |
| B | 7371 | 97 | 1.315968% |
| C | 7371 | 6 | 0.081400% |
| D | 7371 | 467 | 6.335640% |
Noise dominated data is calculated using 1-second bins in cleaned event files. If a bin has >2000 counts, and if more than 50% of those come from <1% of pixels, then it is considered to be noise-dominated and hence unusable.
| Quadrant | # 1 sec bins | Bins with >0 counts | Bins with >2000 counts | High rate bins dominated by noise | Noise dominated (total time) | Noise dominated (detector-on time) | Marked lightcurve |
|---|---|---|---|---|---|---|---|
| A | 7371 | 7371 | 397 | 397 | 5.39% | 5.39% |  |
| B | 7370 | 7370 | 782 | 782 | 10.61% | 10.61% |  |
| C | 7370 | 7370 | 357 | 357 | 4.84% | 4.84% | 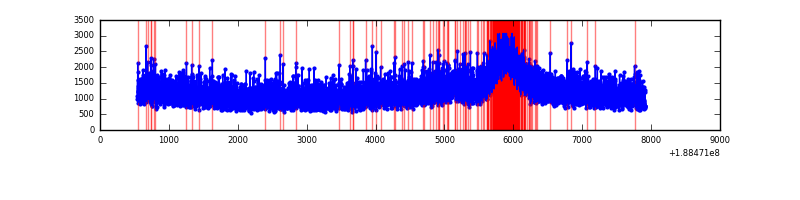 |
| D | 7370 | 7370 | 1205 | 1205 | 16.35% | 16.35% |  |
Top three noisy pixels from each quadrant. If the there are fewer than three noisy pixels in the level2.evt file, extra rows are filled as -1
| Pixel properties | Quadrant properties | ||||||
|---|---|---|---|---|---|---|---|
| Quadrant | DetID | PixID | Counts | Sigma | Mean | Median | Sigma |
| A | 4 | 32 | 118578 | 208.69 | 2328 | 2342 | 557.0 |
| A | 10 | 2 | 18784 | 29.52 | 2328 | 2342 | 557.0 |
| A | 12 | 243 | 17302 | 26.86 | 2328 | 2342 | 557.0 |
| B | 8 | 4 | 729267 | 1283.94 | 2388 | 2393 | 566.1 |
| B | 5 | 191 | 197583 | 344.78 | 2388 | 2393 | 566.1 |
| B | 6 | 53 | 138173 | 239.84 | 2388 | 2393 | 566.1 |
| C | 15 | 241 | 337520 | 550.18 | 2181 | 2256 | 609.4 |
| C | 3 | 79 | 55398 | 87.21 | 2181 | 2256 | 609.4 |
| C | 3 | 111 | 34528 | 52.96 | 2181 | 2256 | 609.4 |
| D | 13 | 169 | 1503721 | 2292.84 | 2122 | 2200 | 654.9 |
| D | 10 | 84 | 549753 | 836.12 | 2122 | 2200 | 654.9 |
| D | 12 | 22 | 336328 | 510.22 | 2122 | 2200 | 654.9 |
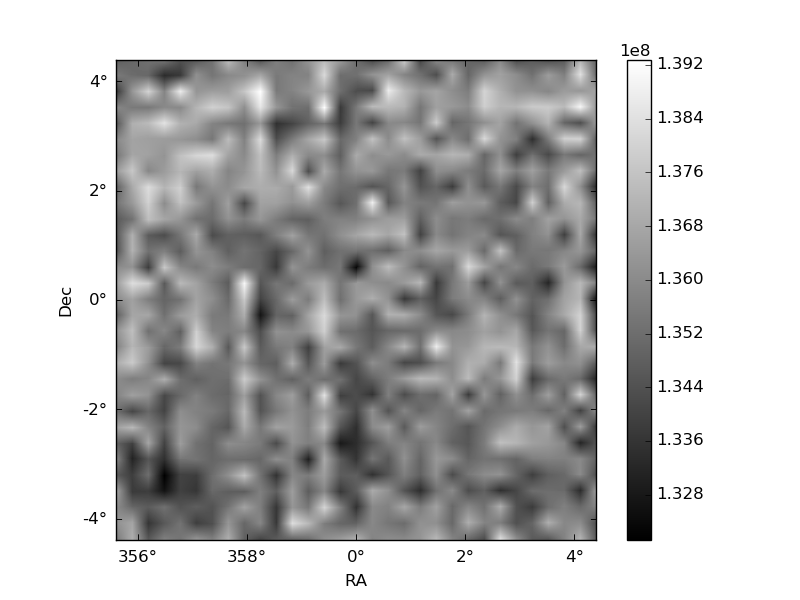
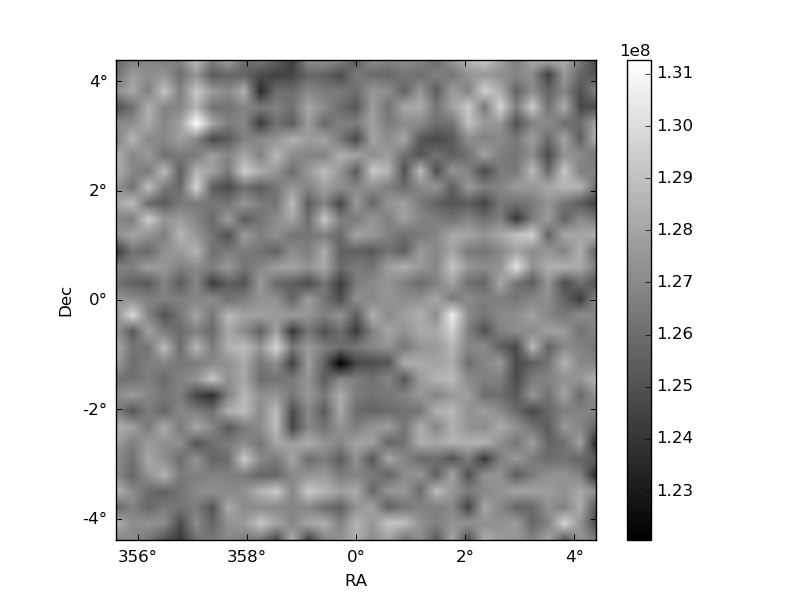
Histogram calculated using DETX and DETY for each event in the final _common_clean file
| Quadrant A | 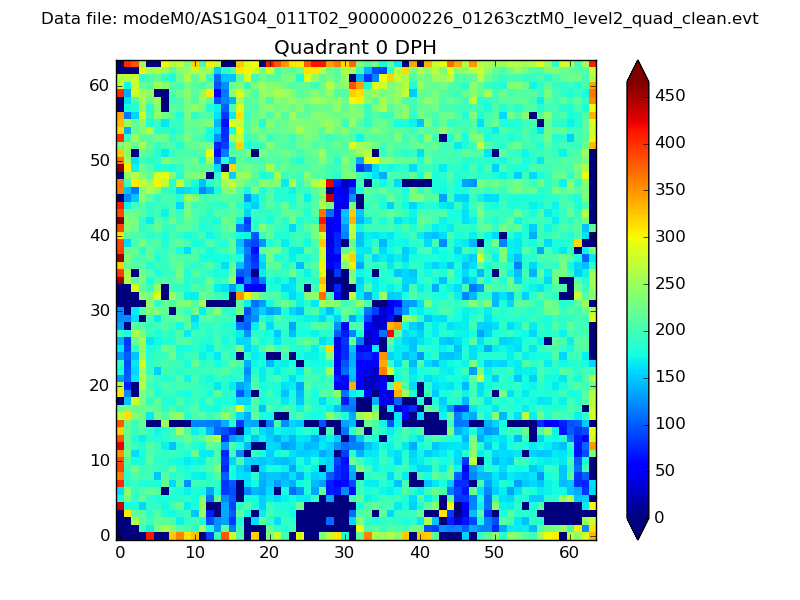 |
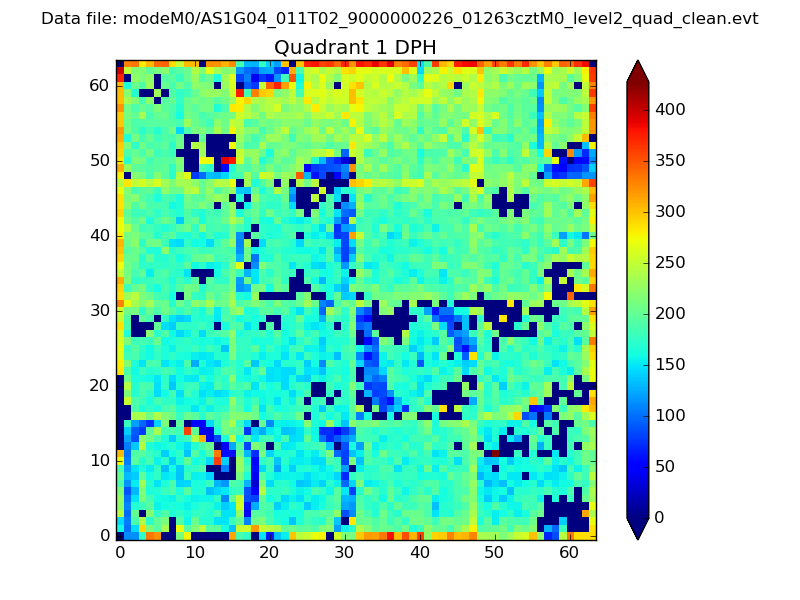 |
Quadrant B |
|---|---|---|---|
| Quadrant D | 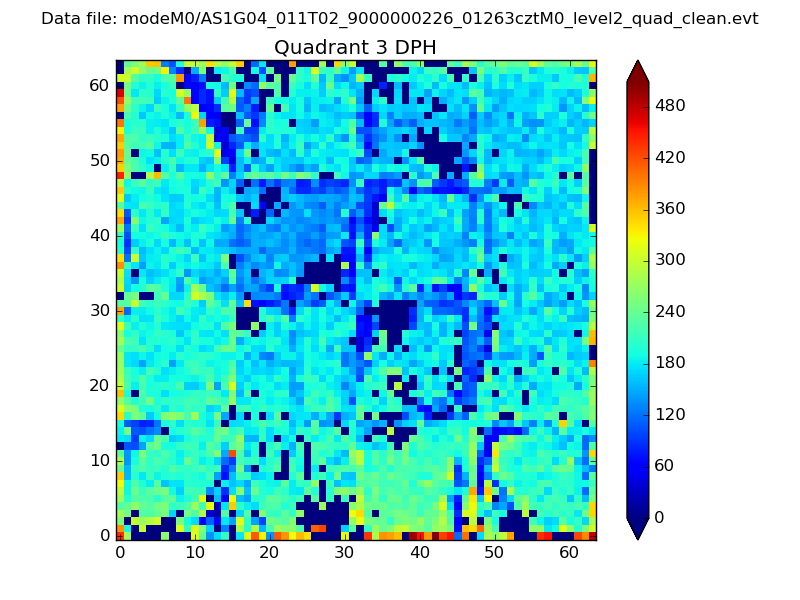 |
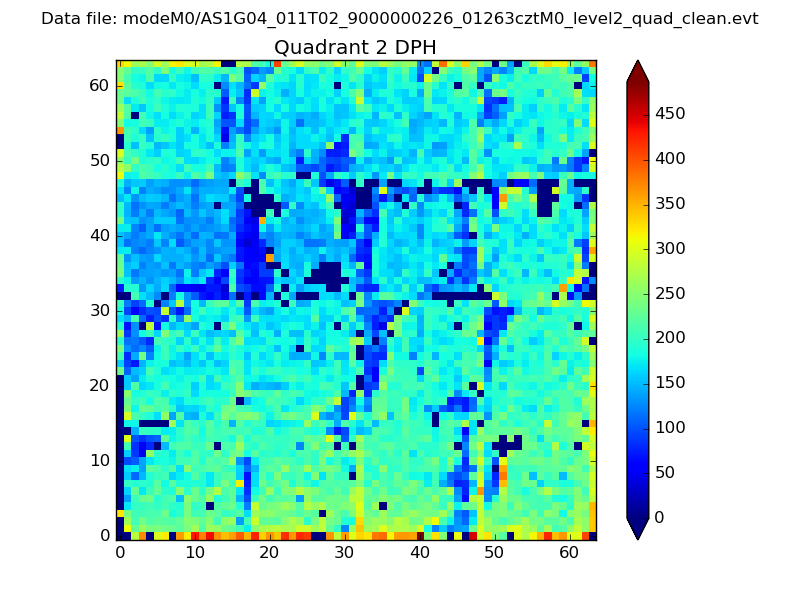 |
Quadrant C |
| Plot type | Count rate plots | Images |
|---|---|---|
| Comparison with Poisson distribution Blue bars denote a histogram of data divided into 1 sec bins. Red curve is a Poisson curve with rate = median count rate of data. |
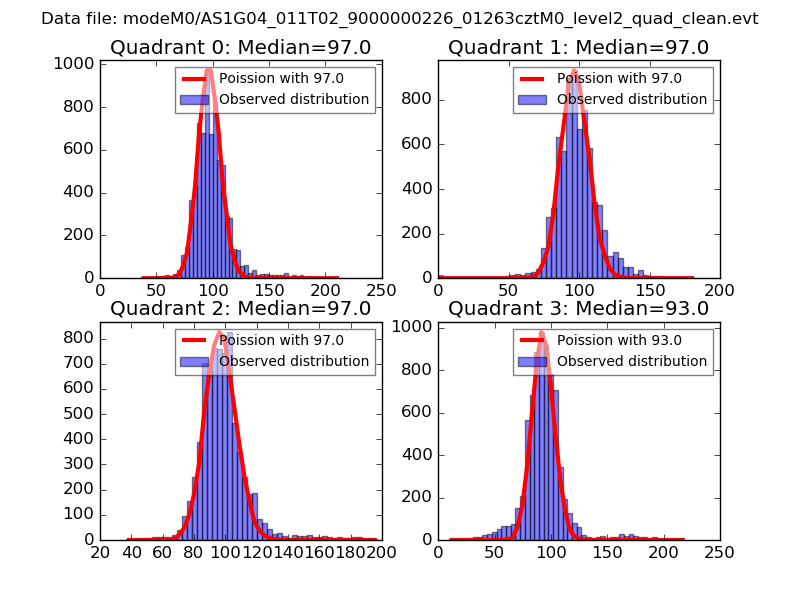 |
 |
| Quadrant-wise count rates Data is divided into 100 sec bins |
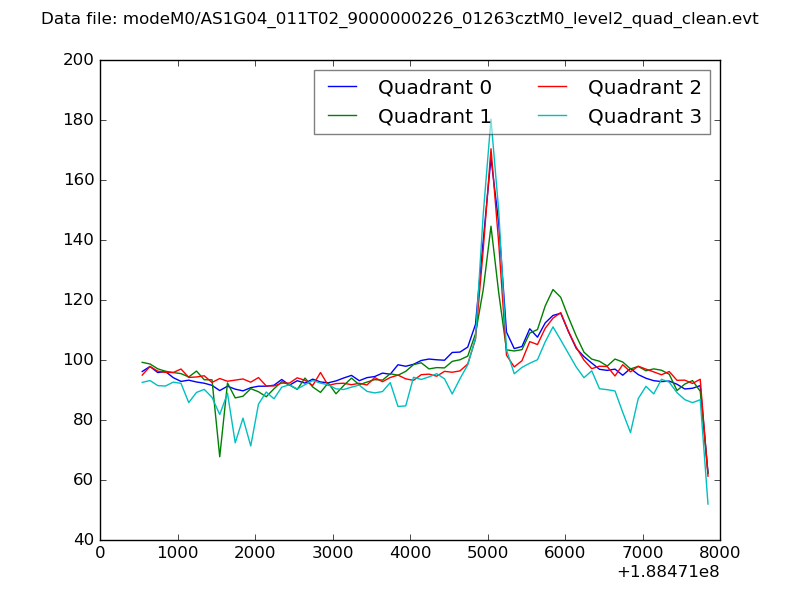 |
|
| Module-wise count rates for Quadrant A Data is divided into 100 sec bins |
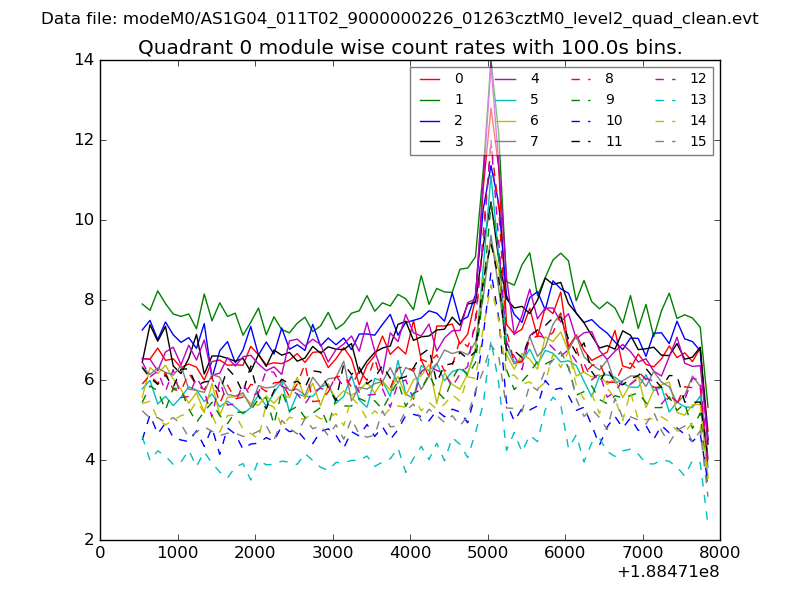 |
 |
| Module-wise count rates for Quadrant B Data is divided into 100 sec bins |
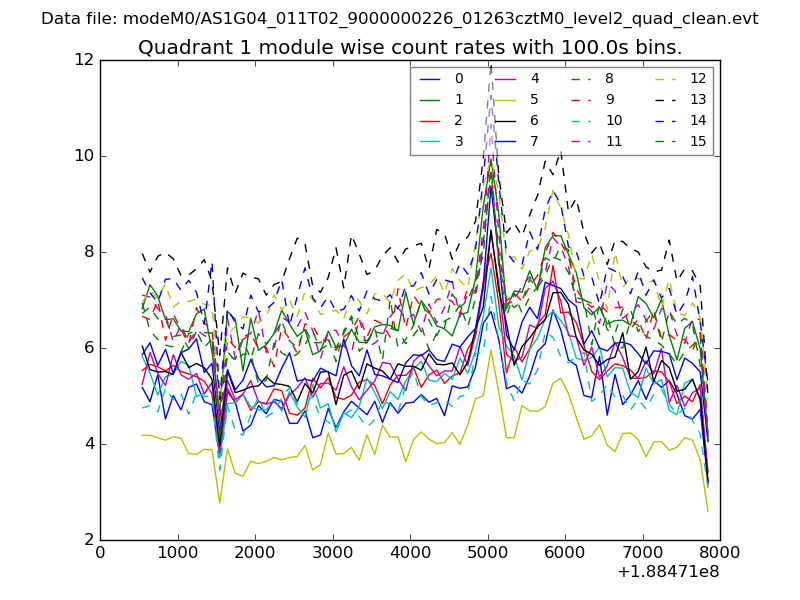 |
 |
| Module-wise count rates for Quadrant C Data is divided into 100 sec bins |
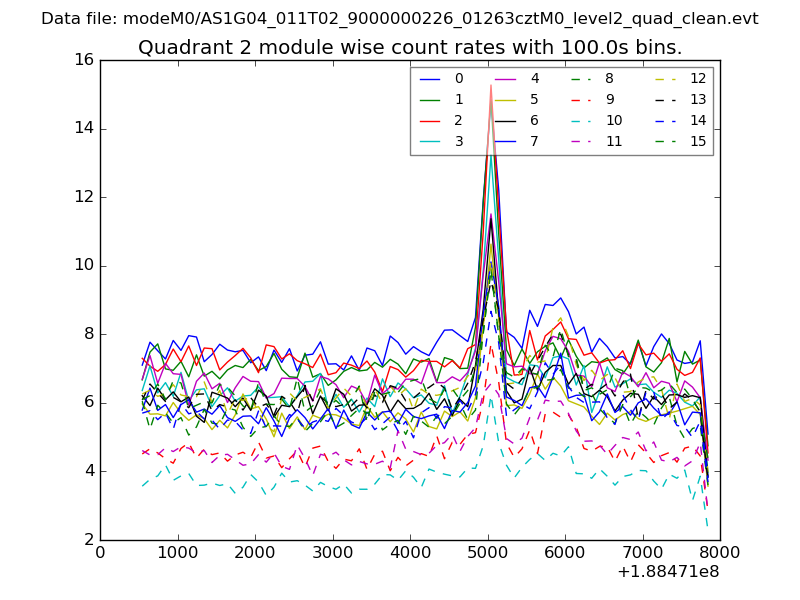 |
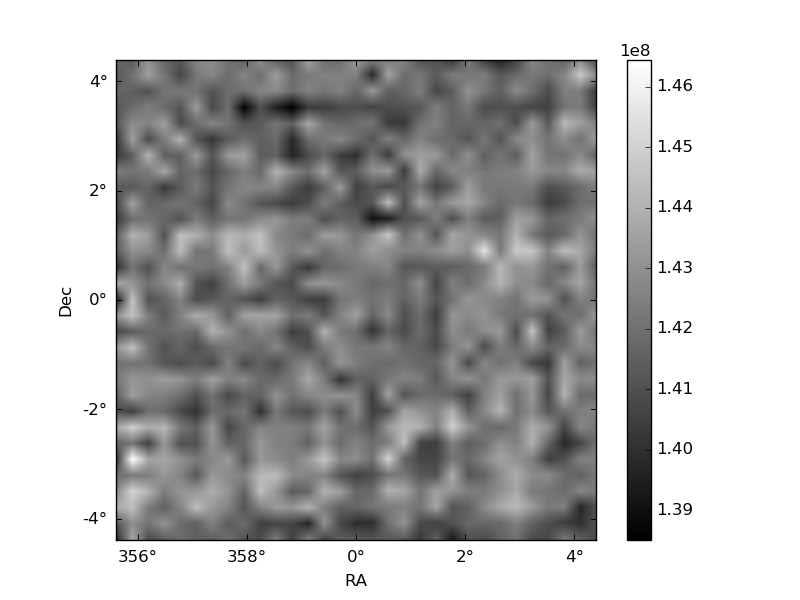 |
| Module-wise count rates for Quadrant D Data is divided into 100 sec bins |
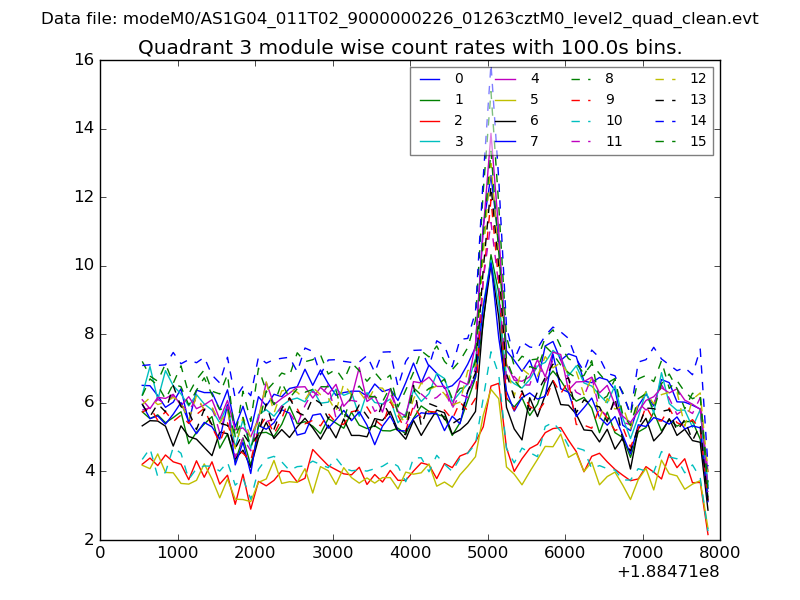 |
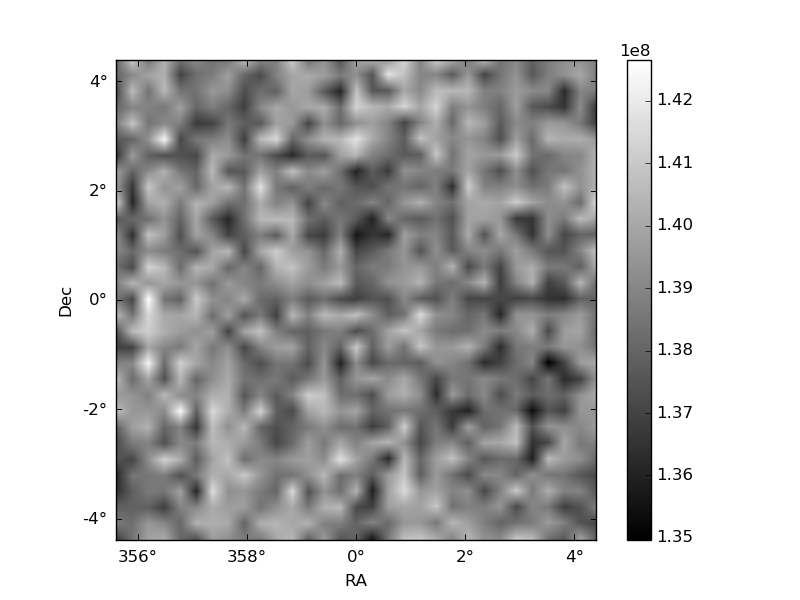 |
| Parameter | Plot |
|---|---|
| CZT HV Monitor | 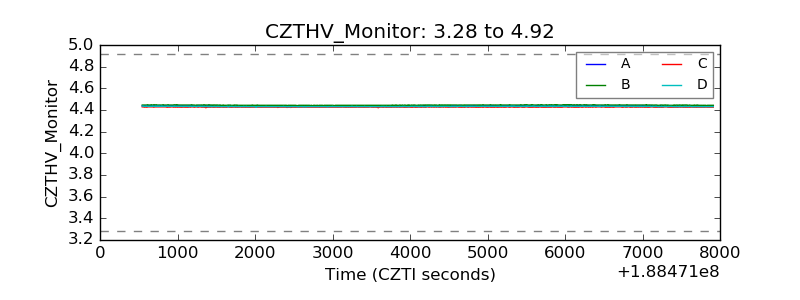 |
| D_VDD | 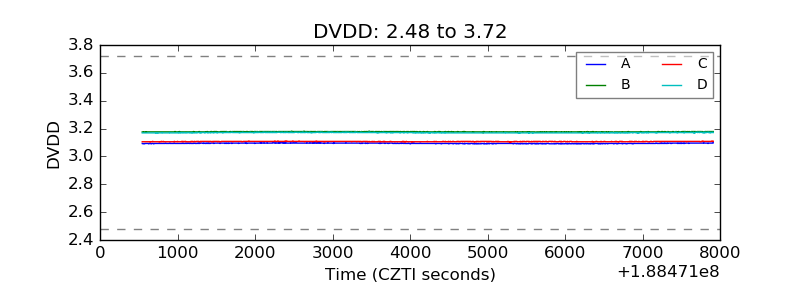 |
| Temperature 1 | 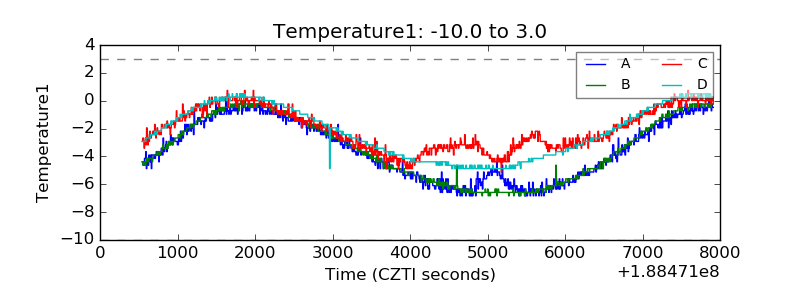 |
| Veto HV Monitor | 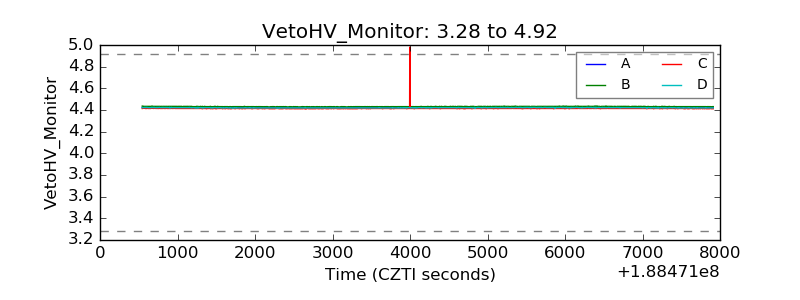 |
| Veto LLD | 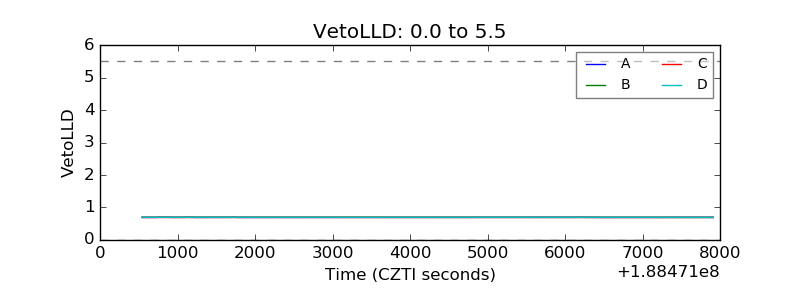 |
| Alpha Counter | 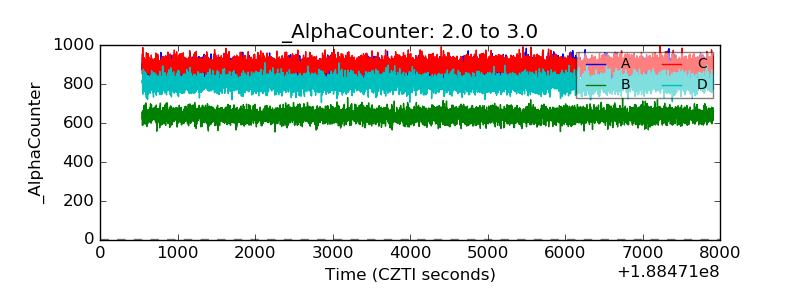 |
| _CPM_Rate | 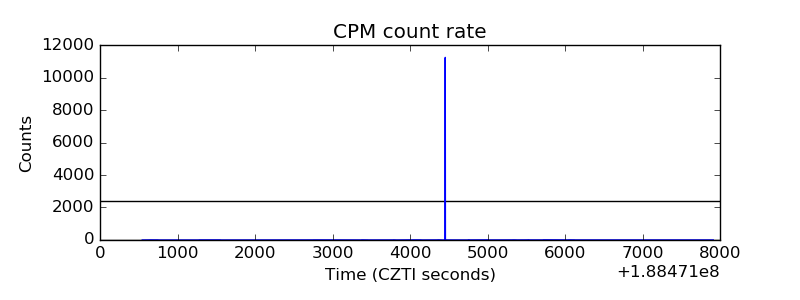 |
| CZT Counter | 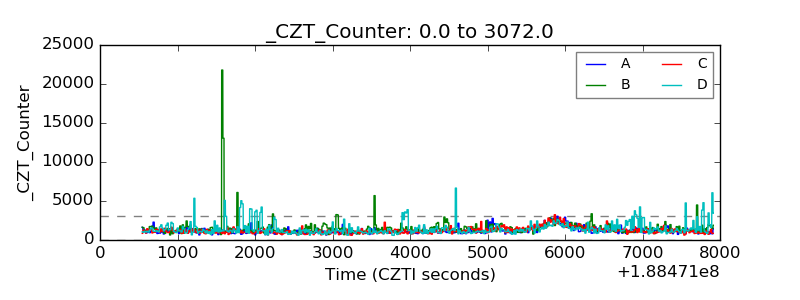 |
| +2.5 Volts monitor |  |
| +5 Volts monitor |  |
| _ROLL_ROT | 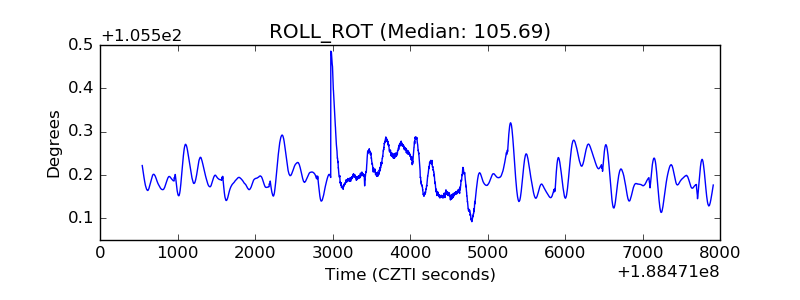 |
| _Roll_DEC | 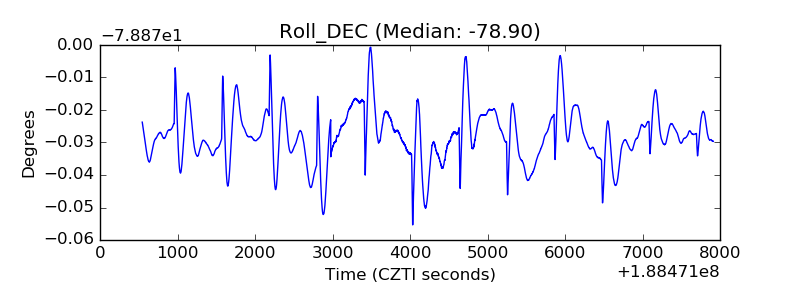 |
| _Roll_RA | 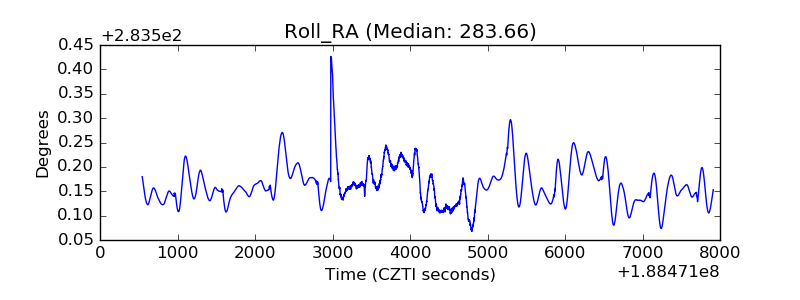 |
| Veto Counter | 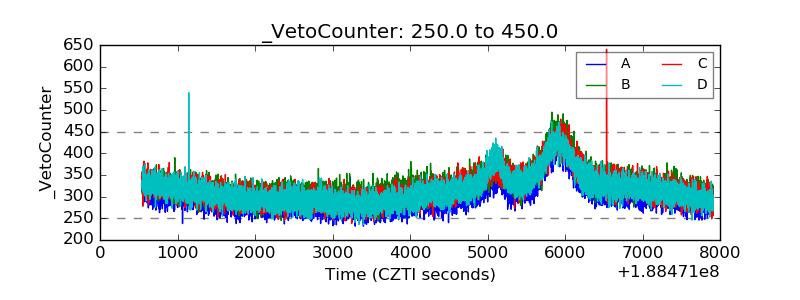 |