| Param | Original file | Final file |
|---|---|---|
| Filename | modeM0/AS1G04_011T02_9000000226_01264cztM0_level2.evt | modeM0/AS1G04_011T02_9000000226_01264cztM0_level2_quad_clean.evt |
| Size (bytes) | 1,500,246,720 | 99,662,400 |
| Size | 1.4 GB | 95.0 MB |
| Events in quadrant A | 8,726,657 | 688,024 |
| Events in quadrant B | 9,791,066 | 684,939 |
| Events in quadrant C | 8,516,847 | 680,211 |
| Events in quadrant D | 17,936,392 | 472,176 |
| Mode SS | |||
|---|---|---|---|
| Quadrant | BADHDUFLAG | Total packets | Discarded packets |
| A | 0 | 140 | 0 |
| B | 0 | 140 | 0 |
| C | 0 | 140 | 0 |
| D | 0 | 140 | 0 |
| Mode M0 | |||
|---|---|---|---|
| Quadrant | BADHDUFLAG | Total packets | Discarded packets |
| A | 0 | 30961 | 1 |
| B | 0 | 34038 | 0 |
| C | 0 | 30342 | 0 |
| D | 0 | 58909 | 0 |
| Quadrant | Total seconds | Saturated seconds | Saturation percentage |
|---|---|---|---|
| A | 7054 | 23 | 0.326056% |
| B | 7054 | 46 | 0.652112% |
| C | 7054 | 2 | 0.028353% |
| D | 7054 | 3887 | 55.103487% |
Noise dominated data is calculated using 1-second bins in cleaned event files. If a bin has >2000 counts, and if more than 50% of those come from <1% of pixels, then it is considered to be noise-dominated and hence unusable.
| Quadrant | # 1 sec bins | Bins with >0 counts | Bins with >2000 counts | High rate bins dominated by noise | Noise dominated (total time) | Noise dominated (detector-on time) | Marked lightcurve |
|---|---|---|---|---|---|---|---|
| A | 7053 | 7053 | 314 | 314 | 4.45% | 4.45% |  |
| B | 7054 | 7054 | 640 | 640 | 9.07% | 9.07% |  |
| C | 7053 | 7053 | 274 | 274 | 3.88% | 3.88% | 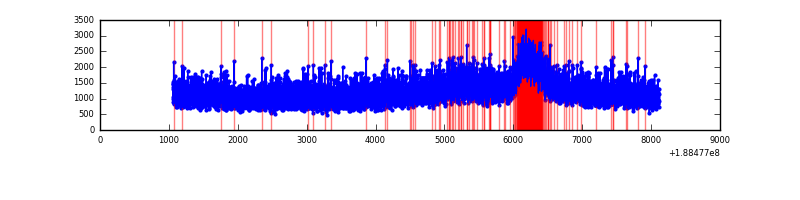 |
| D | 7054 | 7054 | 5314 | 5314 | 75.33% | 75.33% |  |
Top three noisy pixels from each quadrant. If the there are fewer than three noisy pixels in the level2.evt file, extra rows are filled as -1
| Pixel properties | Quadrant properties | ||||||
|---|---|---|---|---|---|---|---|
| Quadrant | DetID | PixID | Counts | Sigma | Mean | Median | Sigma |
| A | 4 | 32 | 83934 | 152.88 | 2210 | 2222 | 534.5 |
| A | 8 | 14 | 68921 | 124.79 | 2210 | 2222 | 534.5 |
| A | 10 | 2 | 56811 | 102.13 | 2210 | 2222 | 534.5 |
| B | 8 | 4 | 643737 | 1192.63 | 2284 | 2290 | 537.8 |
| B | 15 | 22 | 107260 | 195.17 | 2284 | 2290 | 537.8 |
| B | 12 | 52 | 95496 | 173.3 | 2284 | 2290 | 537.8 |
| C | 15 | 241 | 333090 | 574.11 | 2065 | 2134 | 576.5 |
| C | 3 | 79 | 62115 | 104.05 | 2065 | 2134 | 576.5 |
| C | 3 | 111 | 36442 | 59.51 | 2065 | 2134 | 576.5 |
| D | 13 | 169 | 10840805 | 22348.36 | 1572 | 1627 | 485.0 |
| D | 10 | 84 | 609839 | 1254.02 | 1572 | 1627 | 485.0 |
| D | 2 | 107 | 229847 | 470.55 | 1572 | 1627 | 485.0 |
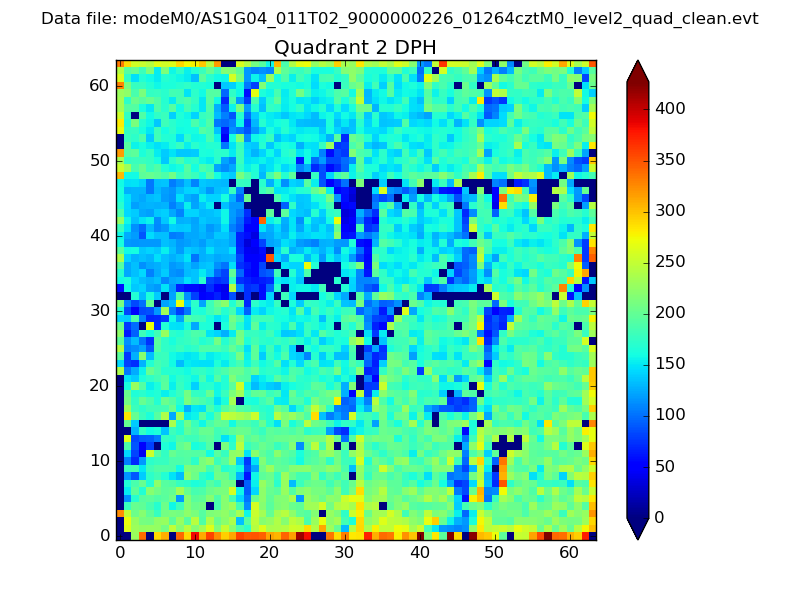
Histogram calculated using DETX and DETY for each event in the final _common_clean file
| Quadrant A | 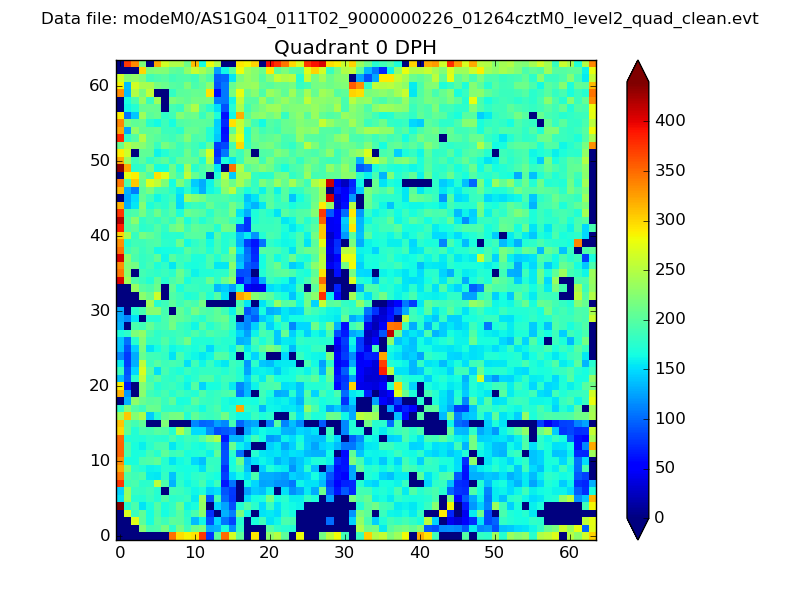 |
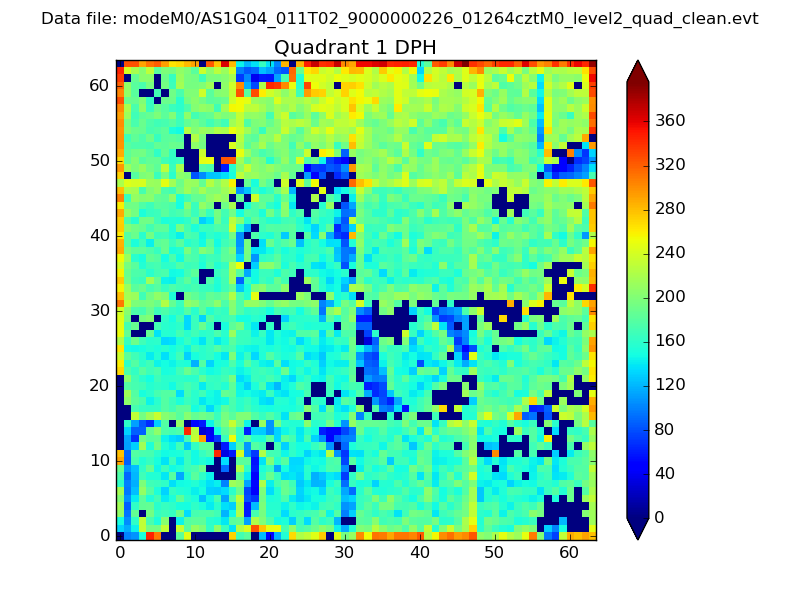 |
Quadrant B |
|---|---|---|---|
| Quadrant D | 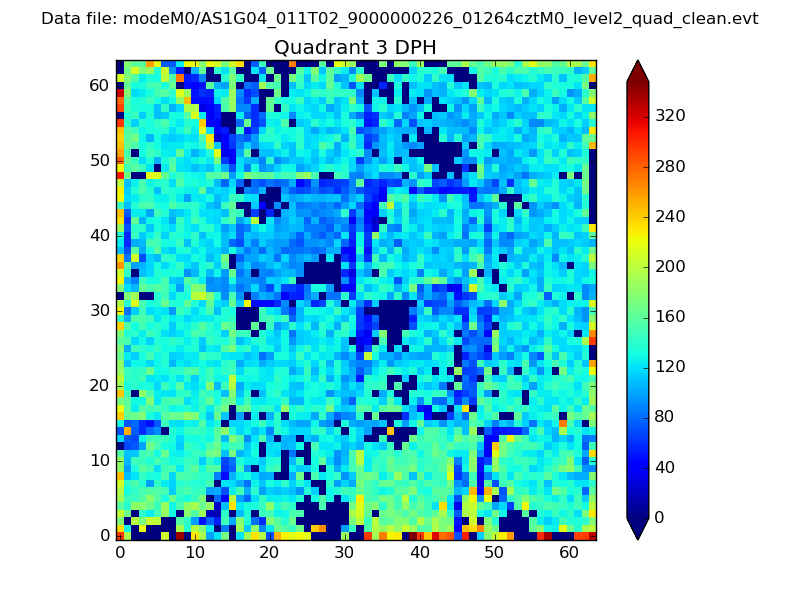 |
 |
Quadrant C |
| Plot type | Count rate plots | Images |
|---|---|---|
| Comparison with Poisson distribution Blue bars denote a histogram of data divided into 1 sec bins. Red curve is a Poisson curve with rate = median count rate of data. |
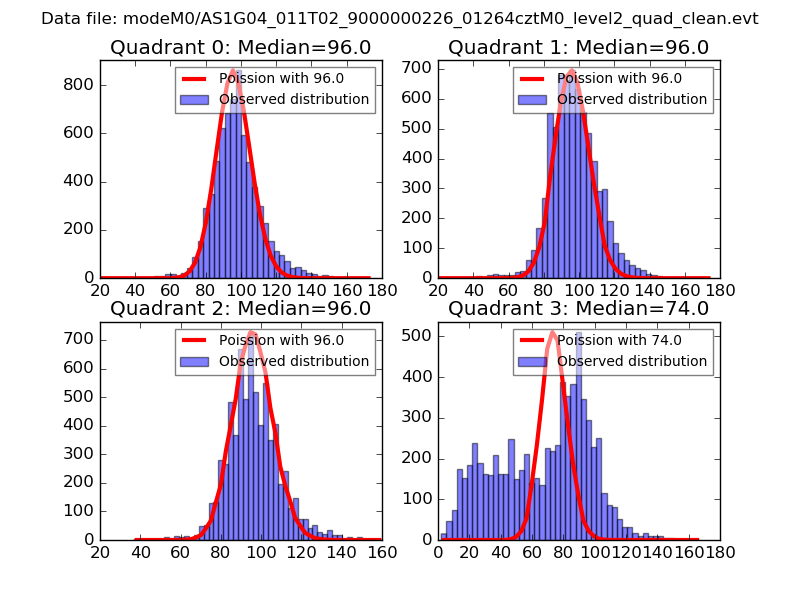 |
 |
| Quadrant-wise count rates Data is divided into 100 sec bins |
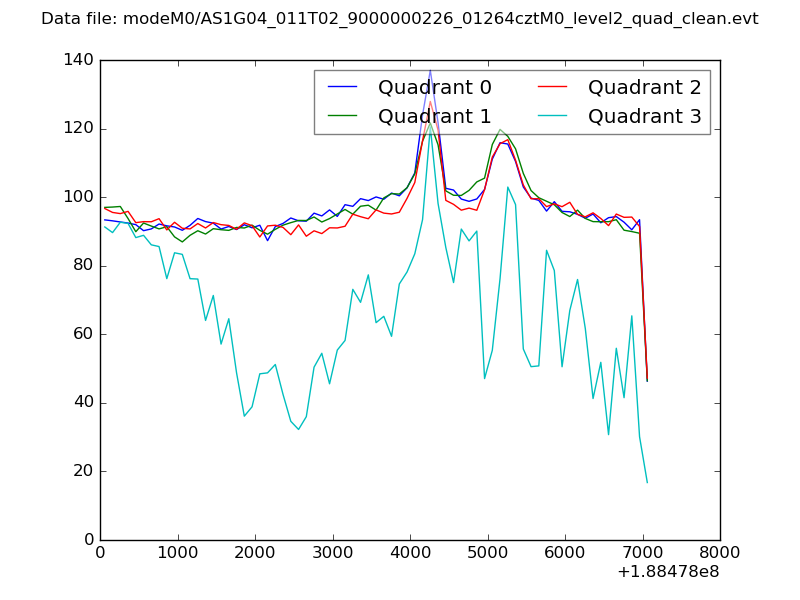 |
|
| Module-wise count rates for Quadrant A Data is divided into 100 sec bins |
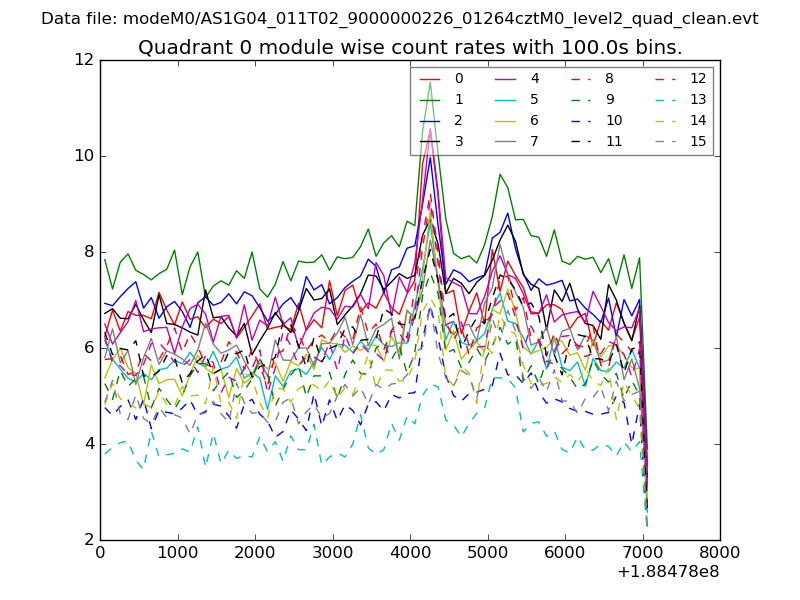 |
 |
| Module-wise count rates for Quadrant B Data is divided into 100 sec bins |
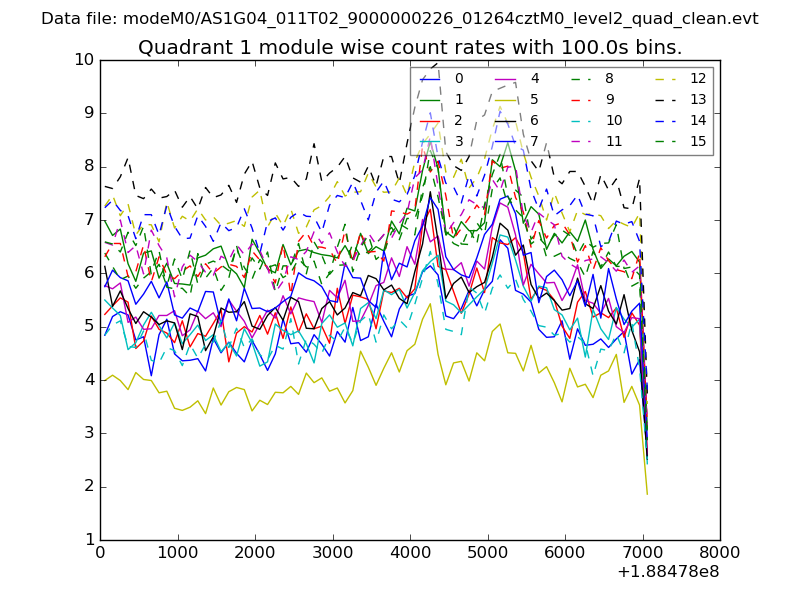 |
 |
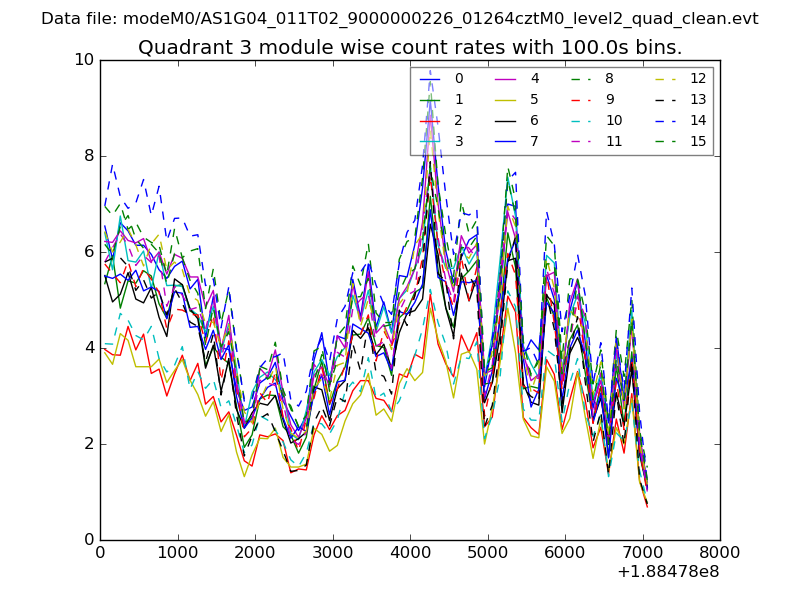
| Module-wise count rates for Quadrant C Data is divided into 100 sec bins |
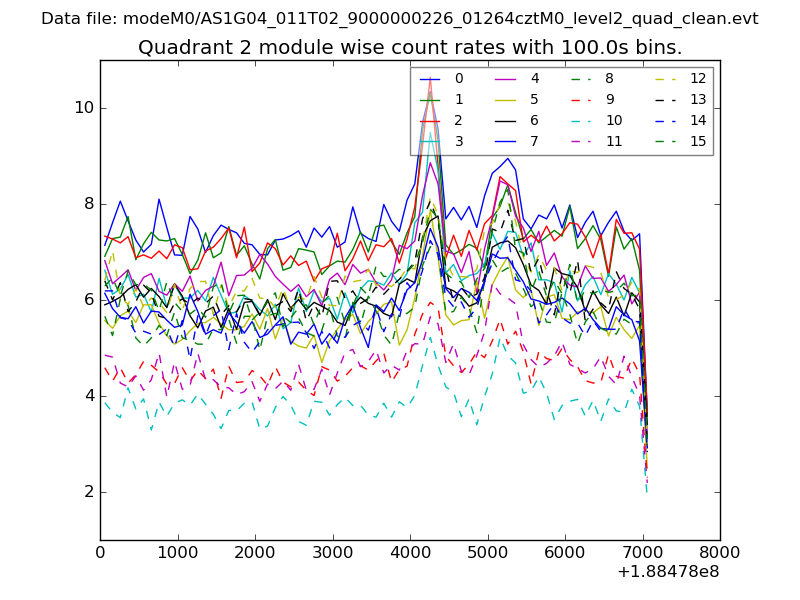 |
 |
| Module-wise count rates for Quadrant D Data is divided into 100 sec bins |
 |
 |
| Parameter | Plot |
|---|---|
| CZT HV Monitor | 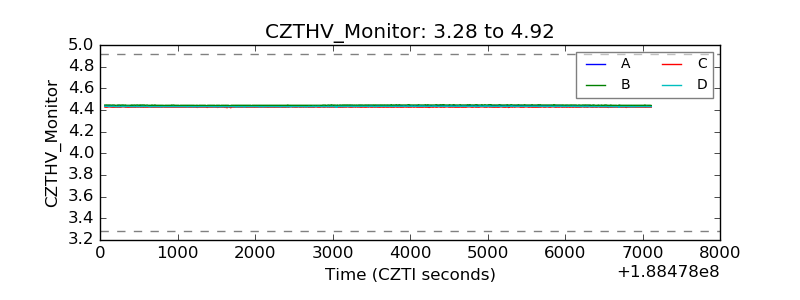 |
| D_VDD | 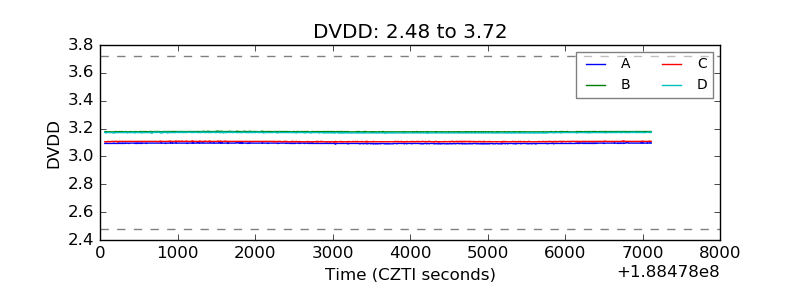 |
| Temperature 1 | 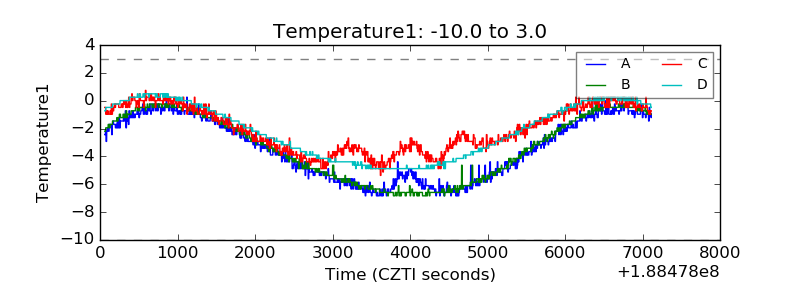 |
| Veto HV Monitor | 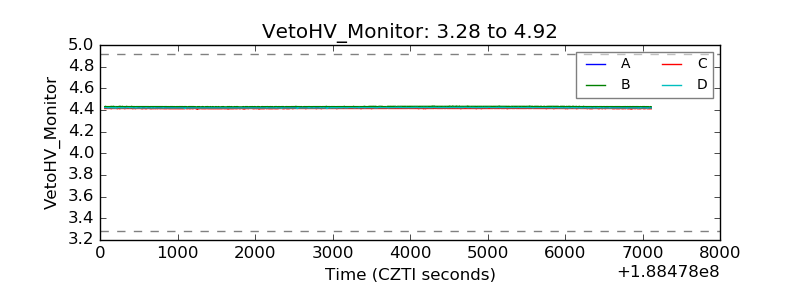 |
| Veto LLD | 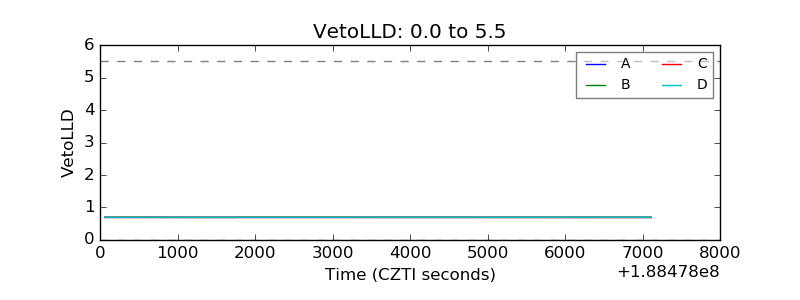 |
| Alpha Counter | 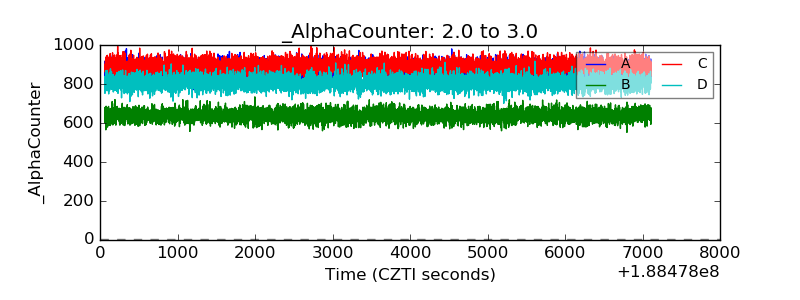 |
| _CPM_Rate | 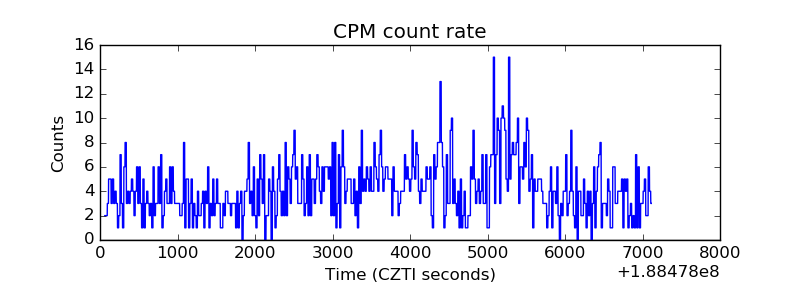 |
| CZT Counter | 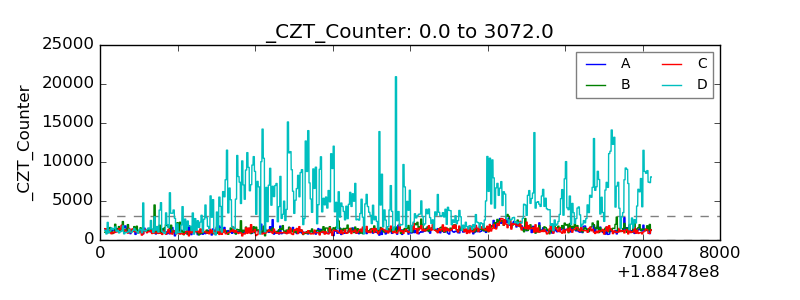 |
| +2.5 Volts monitor |  |
| +5 Volts monitor | 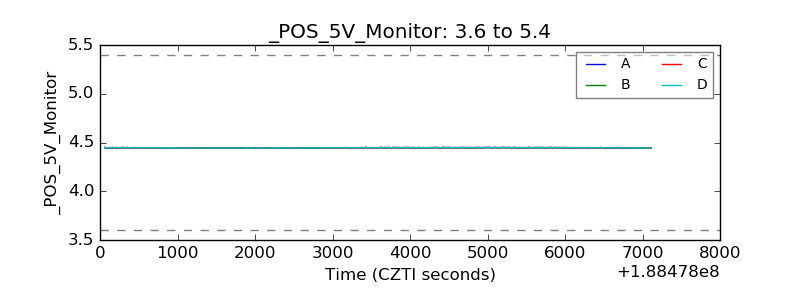 |
| _ROLL_ROT | 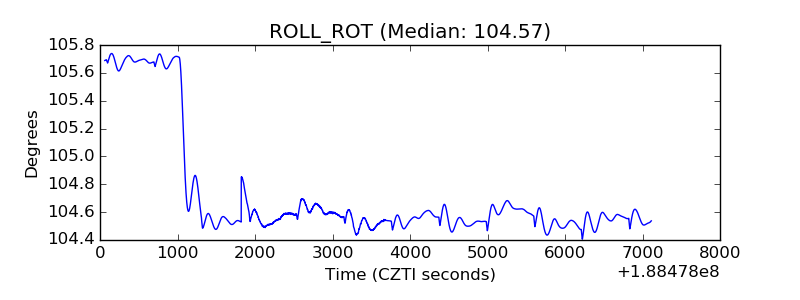 |
| _Roll_DEC | 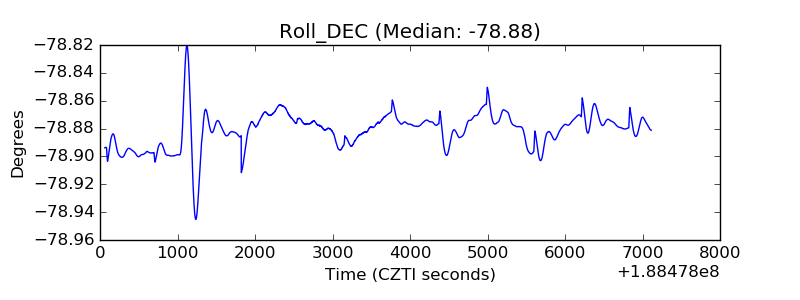 |
| _Roll_RA | 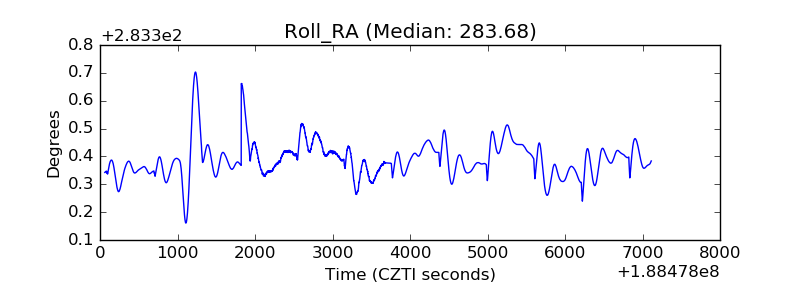 |
| Veto Counter | 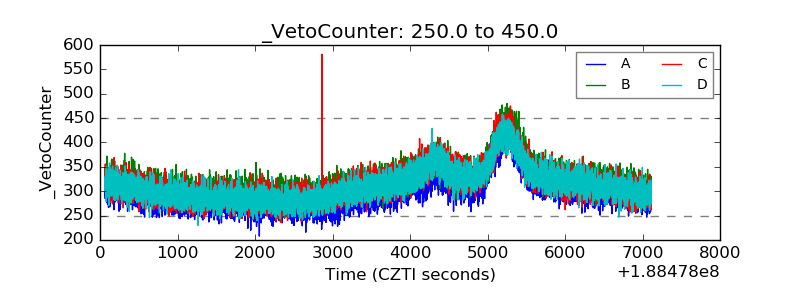 |