| Param | Original file | Final file |
|---|---|---|
| Filename | modeM0/AS1G04_011T02_9000000226_01267cztM0_level2.evt | modeM0/AS1G04_011T02_9000000226_01267cztM0_level2_quad_clean.evt |
| Size (bytes) | 1,387,768,320 | 88,493,760 |
| Size | 1.3 GB | 84.4 MB |
| Events in quadrant A | 7,778,504 | 618,674 |
| Events in quadrant B | 8,779,336 | 608,430 |
| Events in quadrant C | 7,445,636 | 598,819 |
| Events in quadrant D | 17,605,205 | 407,422 |
| Mode SS | |||
|---|---|---|---|
| Quadrant | BADHDUFLAG | Total packets | Discarded packets |
| A | 0 | 130 | 0 |
| B | 0 | 130 | 0 |
| C | 0 | 130 | 0 |
| D | 0 | 130 | 0 |
| Mode M9 | |||
|---|---|---|---|
| Quadrant | BADHDUFLAG | Total packets | Discarded packets |
| A | 0 | 7 | 0 |
| B | 0 | 7 | 0 |
| C | 0 | 7 | 0 |
| D | 0 | 7 | 0 |
| Mode M0 | |||
|---|---|---|---|
| Quadrant | BADHDUFLAG | Total packets | Discarded packets |
| A | 0 | 27658 | 2 |
| B | 0 | 30603 | 1 |
| C | 0 | 26677 | 1 |
| D | 0 | 57447 | 1 |
| Quadrant | Total seconds | Saturated seconds | Saturation percentage |
|---|---|---|---|
| A | 6368 | 41 | 0.643844% |
| B | 6368 | 138 | 2.167085% |
| C | 6368 | 18 | 0.282663% |
| D | 6368 | 4183 | 65.687814% |
Noise dominated data is calculated using 1-second bins in cleaned event files. If a bin has >2000 counts, and if more than 50% of those come from <1% of pixels, then it is considered to be noise-dominated and hence unusable.
| Quadrant | # 1 sec bins | Bins with >0 counts | Bins with >2000 counts | High rate bins dominated by noise | Noise dominated (total time) | Noise dominated (detector-on time) | Marked lightcurve |
|---|---|---|---|---|---|---|---|
| A | 7048 | 6368 | 264 | 264 | 3.75% | 4.15% |  |
| B | 7047 | 6367 | 594 | 594 | 8.43% | 9.33% |  |
| C | 7048 | 6368 | 124 | 124 | 1.76% | 1.95% | 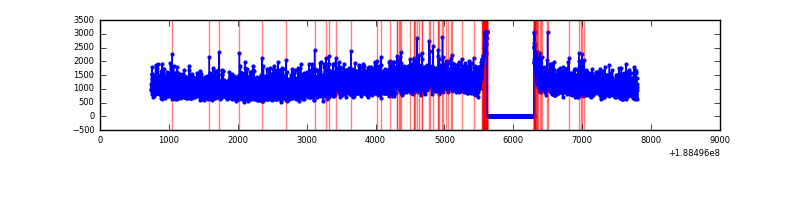 |
| D | 7047 | 6367 | 5547 | 5547 | 78.71% | 87.12% | 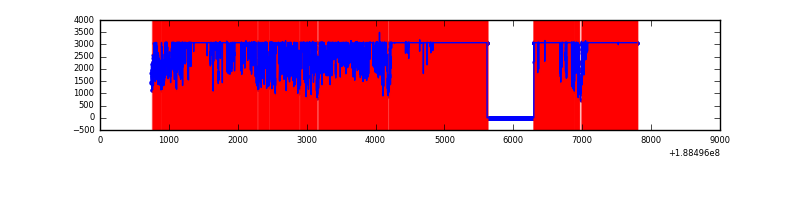 |
Top three noisy pixels from each quadrant. If the there are fewer than three noisy pixels in the level2.evt file, extra rows are filled as -1
| Pixel properties | Quadrant properties | ||||||
|---|---|---|---|---|---|---|---|
| Quadrant | DetID | PixID | Counts | Sigma | Mean | Median | Sigma |
| A | 4 | 32 | 180582 | 380.92 | 1946 | 1960 | 468.9 |
| A | 8 | 14 | 75940 | 157.77 | 1946 | 1960 | 468.9 |
| A | 10 | 2 | 20990 | 40.58 | 1946 | 1960 | 468.9 |
| B | 8 | 4 | 617203 | 1292.21 | 2015 | 2026 | 476.1 |
| B | 6 | 53 | 191986 | 399.02 | 2015 | 2026 | 476.1 |
| B | 15 | 22 | 96807 | 199.09 | 2015 | 2026 | 476.1 |
| C | 15 | 241 | 295677 | 578.86 | 1809 | 1874 | 507.6 |
| C | 3 | 79 | 42080 | 79.21 | 1809 | 1874 | 507.6 |
| C | 3 | 111 | 29293 | 54.02 | 1809 | 1874 | 507.6 |
| D | 13 | 169 | 8381984 | 20597.07 | 1315 | 1359 | 406.9 |
| D | 12 | 22 | 3729646 | 9163.01 | 1315 | 1359 | 406.9 |
| D | 10 | 84 | 311278 | 761.69 | 1315 | 1359 | 406.9 |
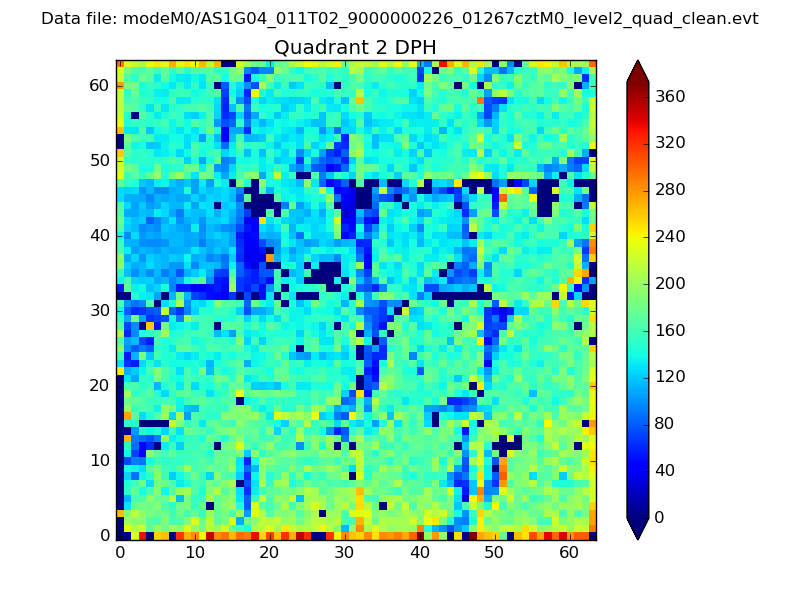
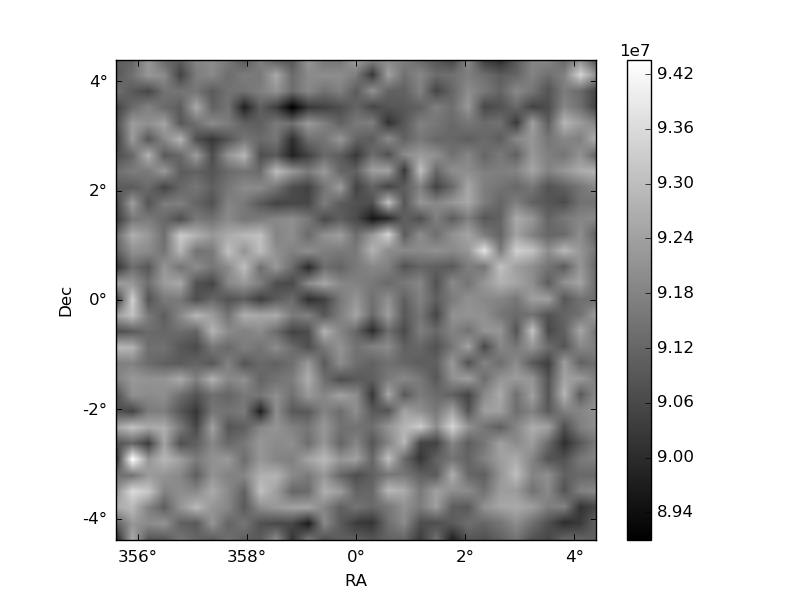
Histogram calculated using DETX and DETY for each event in the final _common_clean file
| Quadrant A | 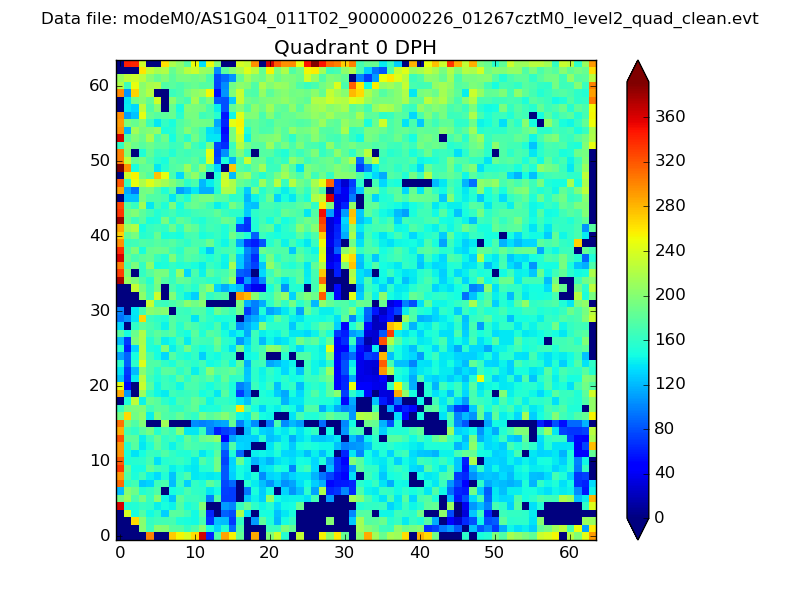 |
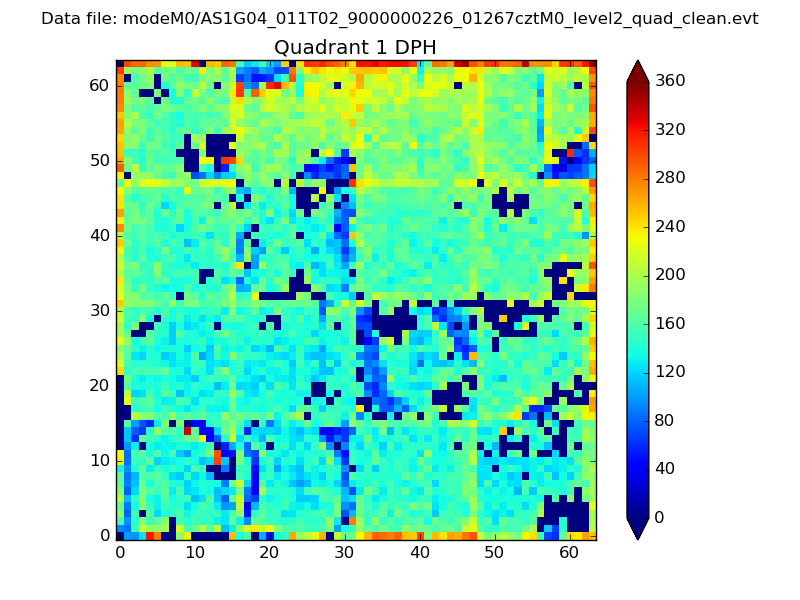 |
Quadrant B |
|---|---|---|---|
| Quadrant D | 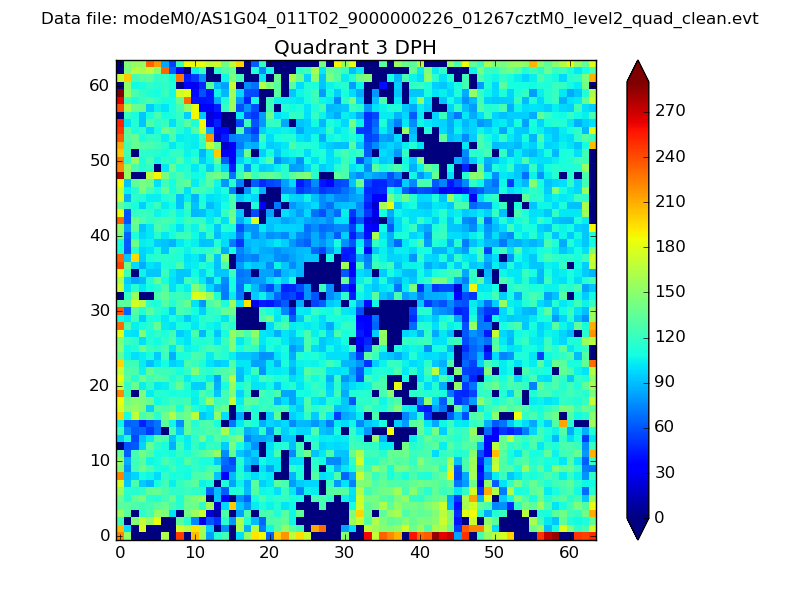 |
 |
Quadrant C |
| Plot type | Count rate plots | Images |
|---|---|---|
| Comparison with Poisson distribution Blue bars denote a histogram of data divided into 1 sec bins. Red curve is a Poisson curve with rate = median count rate of data. |
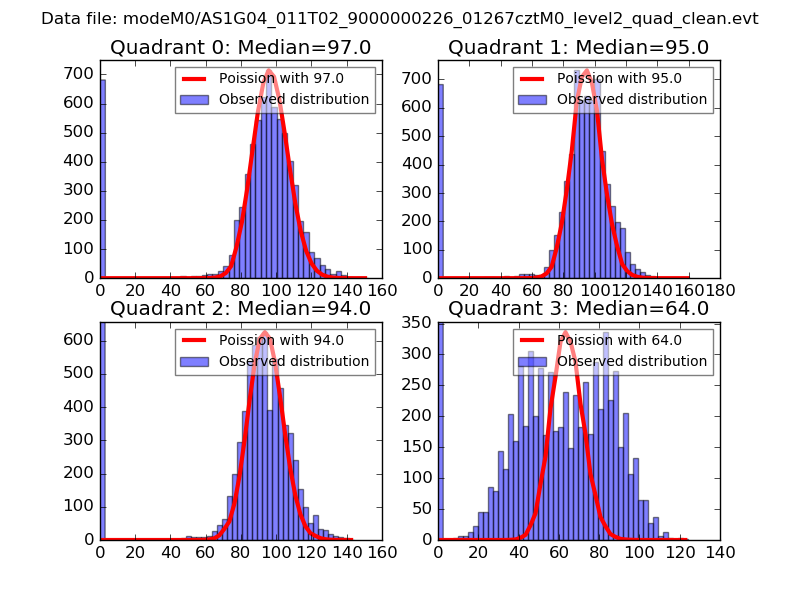 |
 |
| Quadrant-wise count rates Data is divided into 100 sec bins |
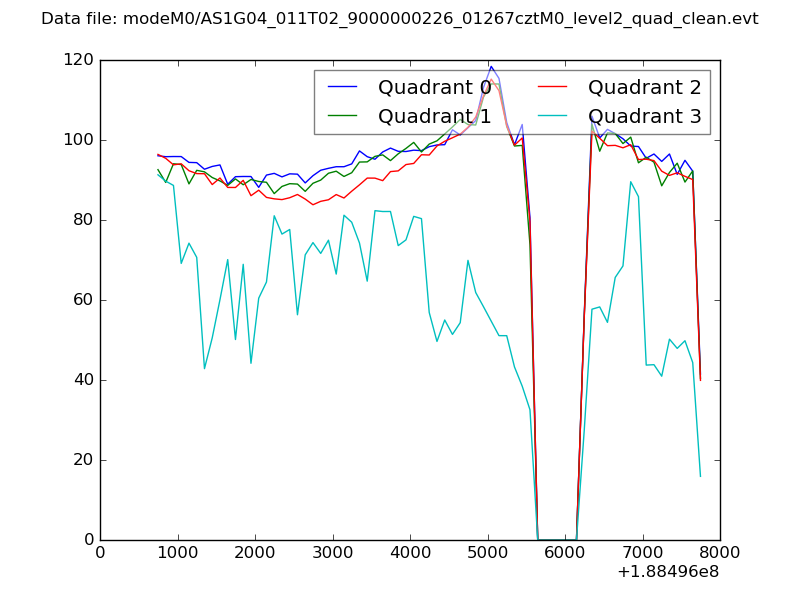 |
|
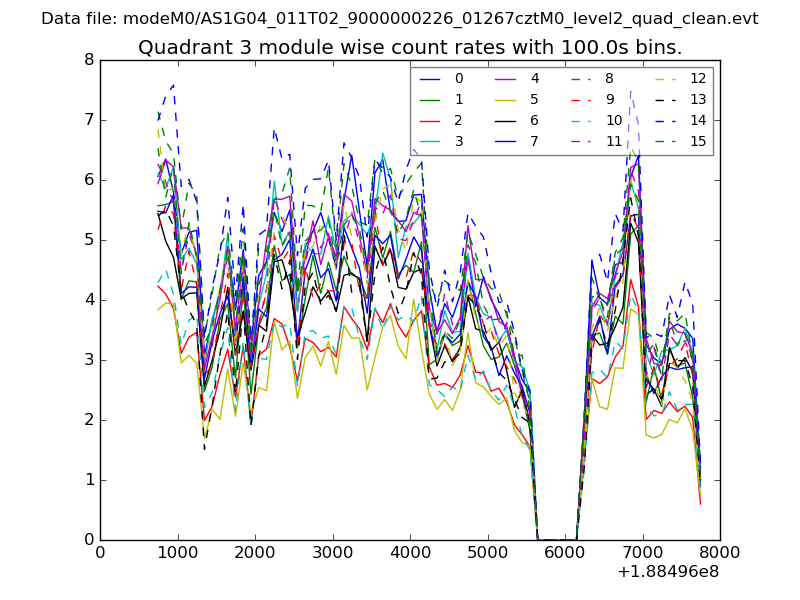
| Module-wise count rates for Quadrant A Data is divided into 100 sec bins |
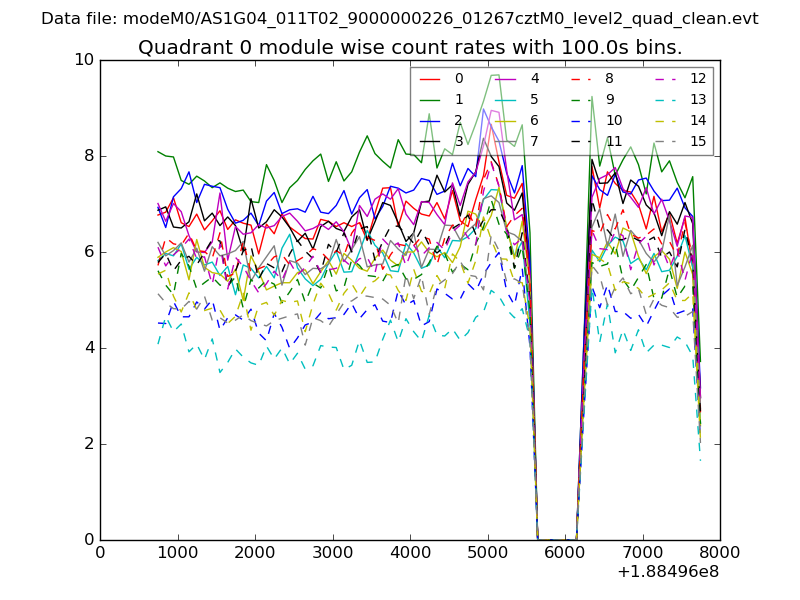 |
 |
| Module-wise count rates for Quadrant B Data is divided into 100 sec bins |
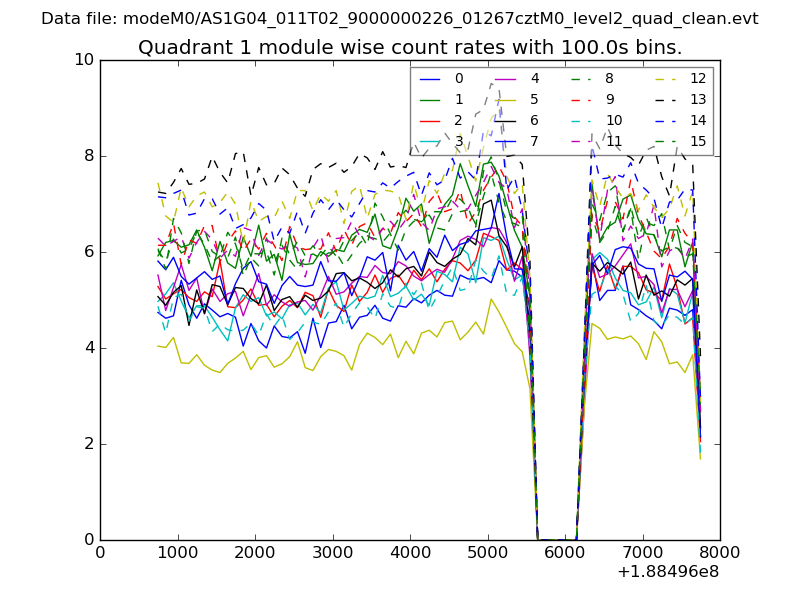 |
 |
| Module-wise count rates for Quadrant C Data is divided into 100 sec bins |
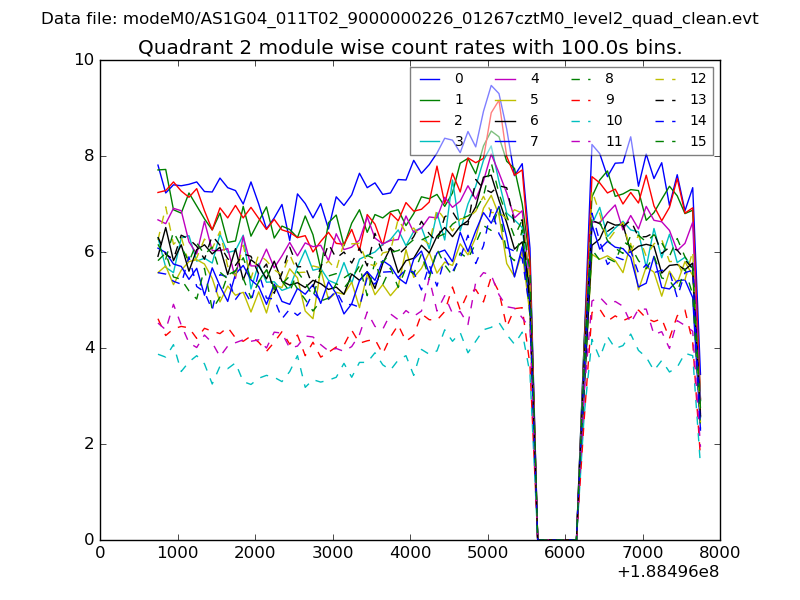 |
 |
| Module-wise count rates for Quadrant D Data is divided into 100 sec bins |
 |
 |
| Parameter | Plot |
|---|---|
| CZT HV Monitor | 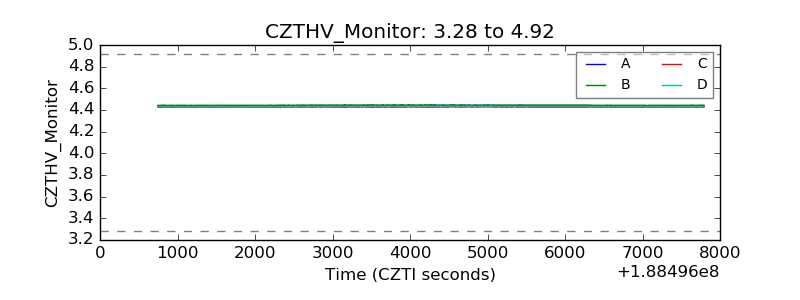 |
| D_VDD | 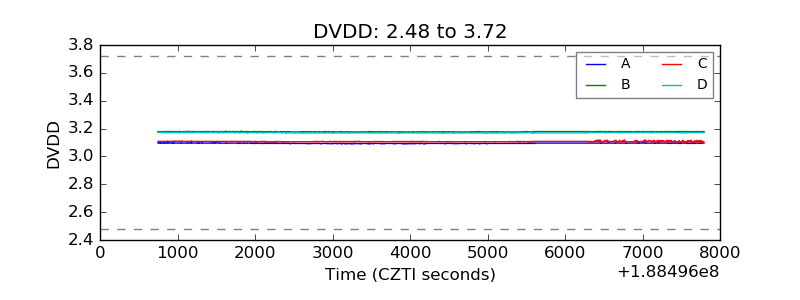 |
| Temperature 1 | 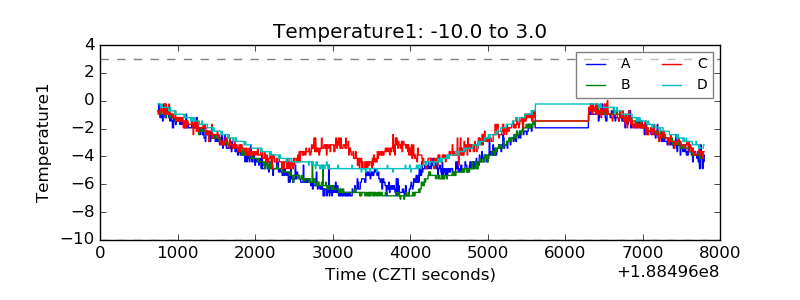 |
| Veto HV Monitor | 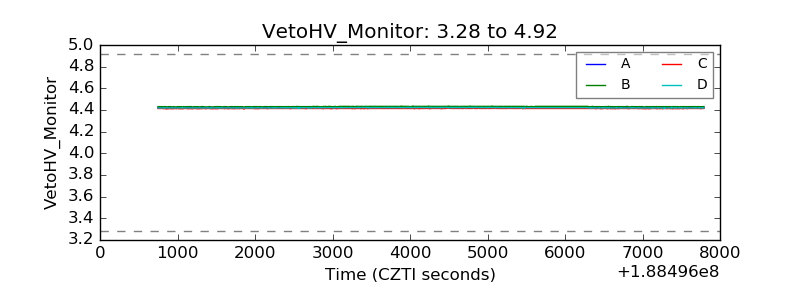 |
| Veto LLD | 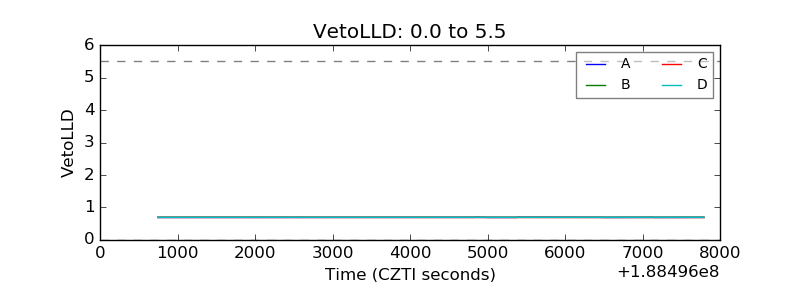 |
| Alpha Counter | 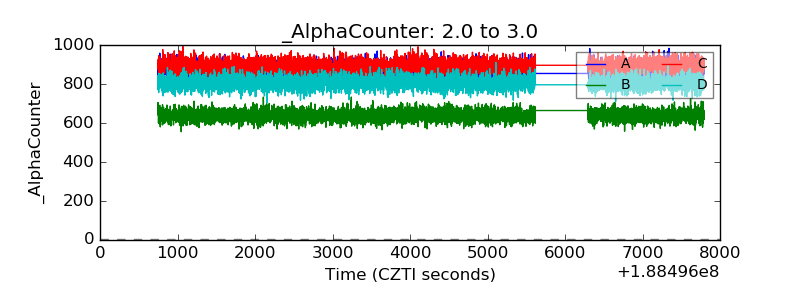 |
| _CPM_Rate | 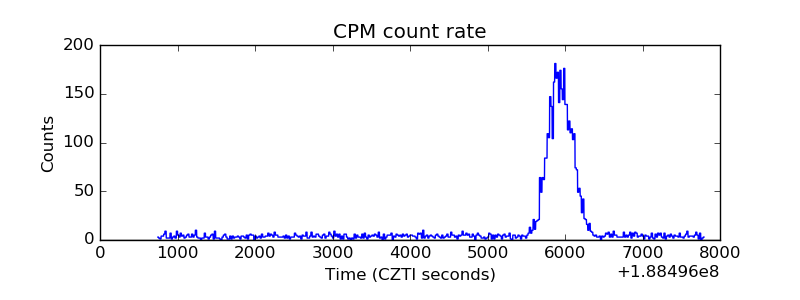 |
| CZT Counter | 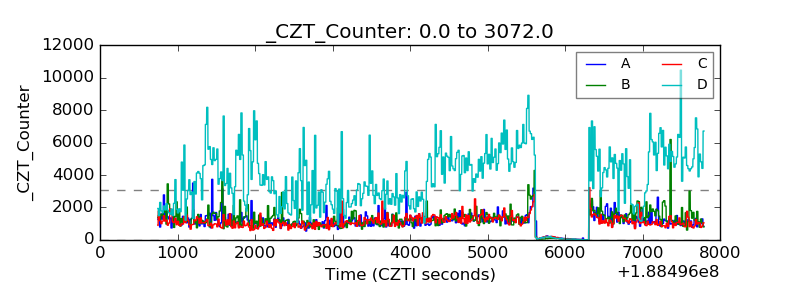 |
| +2.5 Volts monitor |  |
| +5 Volts monitor | 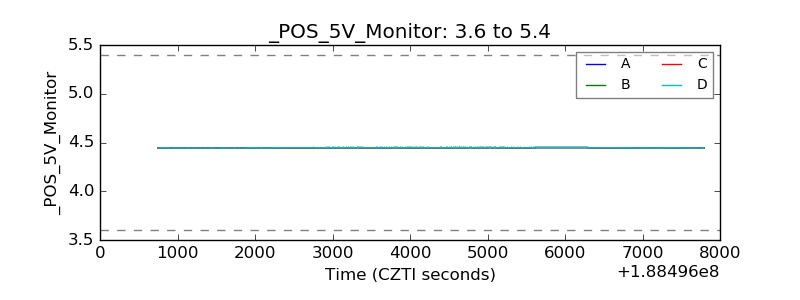 |
| _ROLL_ROT | 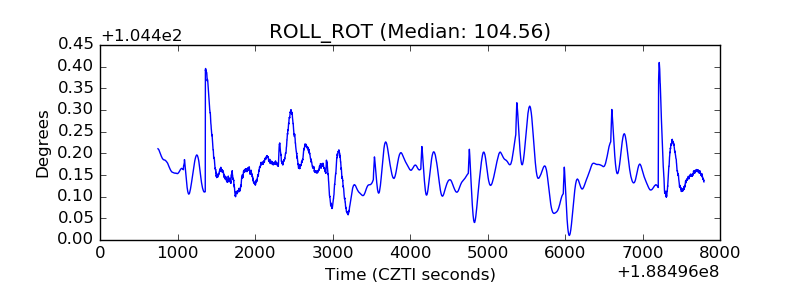 |
| _Roll_DEC | 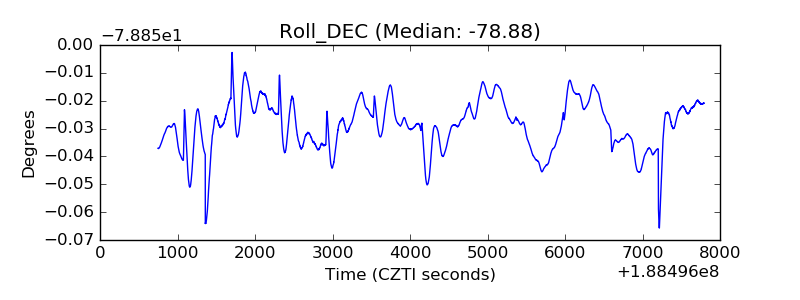 |
| _Roll_RA | 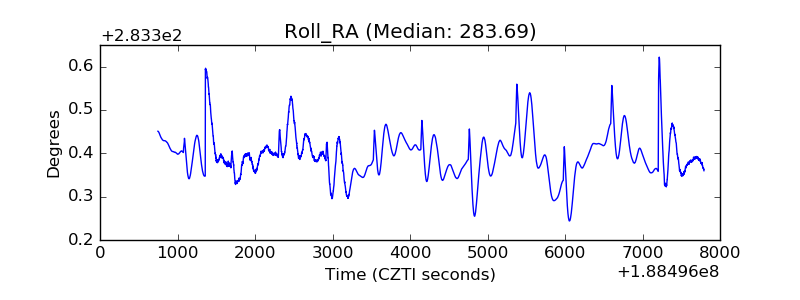 |
| Veto Counter | 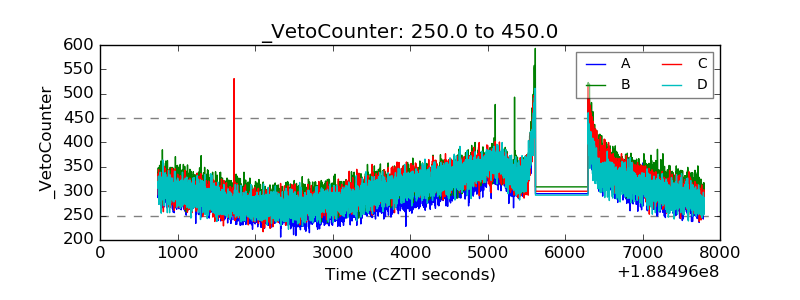 |