| Param | Original file | Final file |
|---|---|---|
| Filename | modeM0/AS1G04_011T02_9000000226_01268cztM0_level2.evt | modeM0/AS1G04_011T02_9000000226_01268cztM0_level2_quad_clean.evt |
| Size (bytes) | 1,482,992,640 | 90,285,120 |
| Size | 1.4 GB | 86.1 MB |
| Events in quadrant A | 7,816,487 | 651,359 |
| Events in quadrant B | 8,911,411 | 642,969 |
| Events in quadrant C | 8,455,351 | 626,455 |
| Events in quadrant D | 19,292,075 | 348,604 |
| Mode SS | |||
|---|---|---|---|
| Quadrant | BADHDUFLAG | Total packets | Discarded packets |
| A | 0 | 134 | 0 |
| B | 0 | 134 | 0 |
| C | 0 | 134 | 0 |
| D | 0 | 134 | 0 |
| Mode M9 | |||
|---|---|---|---|
| Quadrant | BADHDUFLAG | Total packets | Discarded packets |
| A | 0 | 9 | 0 |
| B | 0 | 9 | 0 |
| C | 0 | 9 | 0 |
| D | 0 | 9 | 0 |
| Mode M0 | |||
|---|---|---|---|
| Quadrant | BADHDUFLAG | Total packets | Discarded packets |
| A | 0 | 27944 | 2 |
| B | 0 | 31146 | 1 |
| C | 0 | 29832 | 1 |
| D | 0 | 62950 | 1 |
| Quadrant | Total seconds | Saturated seconds | Saturation percentage |
|---|---|---|---|
| A | 6626 | 17 | 0.256565% |
| B | 6626 | 67 | 1.011168% |
| C | 6626 | 49 | 0.739511% |
| D | 6626 | 5762 | 86.960459% |
Noise dominated data is calculated using 1-second bins in cleaned event files. If a bin has >2000 counts, and if more than 50% of those come from <1% of pixels, then it is considered to be noise-dominated and hence unusable.
| Quadrant | # 1 sec bins | Bins with >0 counts | Bins with >2000 counts | High rate bins dominated by noise | Noise dominated (total time) | Noise dominated (detector-on time) | Marked lightcurve |
|---|---|---|---|---|---|---|---|
| A | 7511 | 6626 | 150 | 150 | 2.00% | 2.26% | 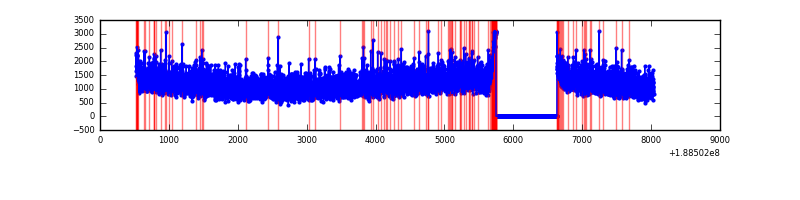 |
| B | 7510 | 6625 | 477 | 477 | 6.35% | 7.20% | 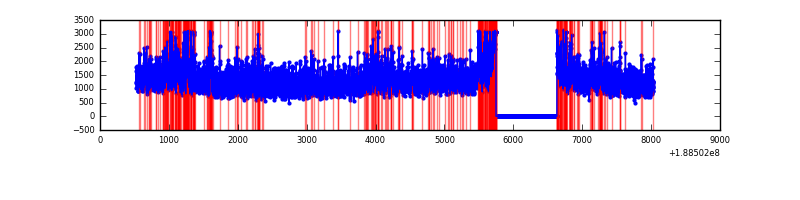 |
| C | 7510 | 6625 | 364 | 364 | 4.85% | 5.49% | 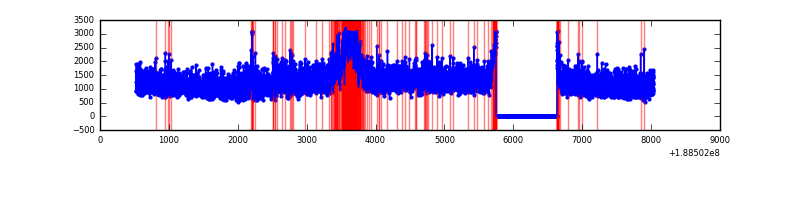 |
| D | 7510 | 6625 | 6101 | 6101 | 81.24% | 92.09% | 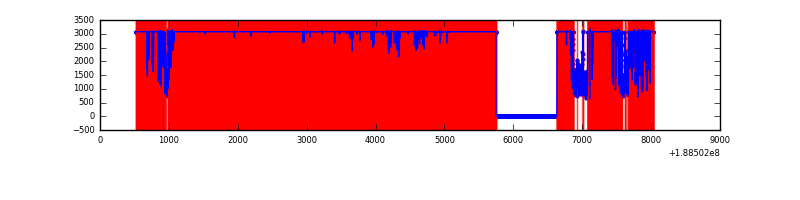 |
Top three noisy pixels from each quadrant. If the there are fewer than three noisy pixels in the level2.evt file, extra rows are filled as -1
| Pixel properties | Quadrant properties | ||||||
|---|---|---|---|---|---|---|---|
| Quadrant | DetID | PixID | Counts | Sigma | Mean | Median | Sigma |
| A | 8 | 14 | 40600 | 79.31 | 2017 | 2034 | 486.2 |
| A | 12 | 243 | 10915 | 18.26 | 2017 | 2034 | 486.2 |
| A | 8 | 15 | 10784 | 18.0 | 2017 | 2034 | 486.2 |
| B | 8 | 4 | 693355 | 1388.07 | 2112 | 2121 | 498.0 |
| B | 6 | 53 | 41239 | 78.55 | 2112 | 2121 | 498.0 |
| B | 4 | 185 | 34811 | 65.64 | 2112 | 2121 | 498.0 |
| C | 8 | 208 | 792927 | 1523.51 | 1862 | 1928 | 519.2 |
| C | 15 | 241 | 308711 | 590.88 | 1862 | 1928 | 519.2 |
| C | 3 | 79 | 34370 | 62.48 | 1862 | 1928 | 519.2 |
| D | 13 | 169 | 7376038 | 20336.64 | 1165 | 1207 | 362.6 |
| D | 12 | 22 | 7320099 | 20182.38 | 1165 | 1207 | 362.6 |
| D | 10 | 84 | 166724 | 456.43 | 1165 | 1207 | 362.6 |
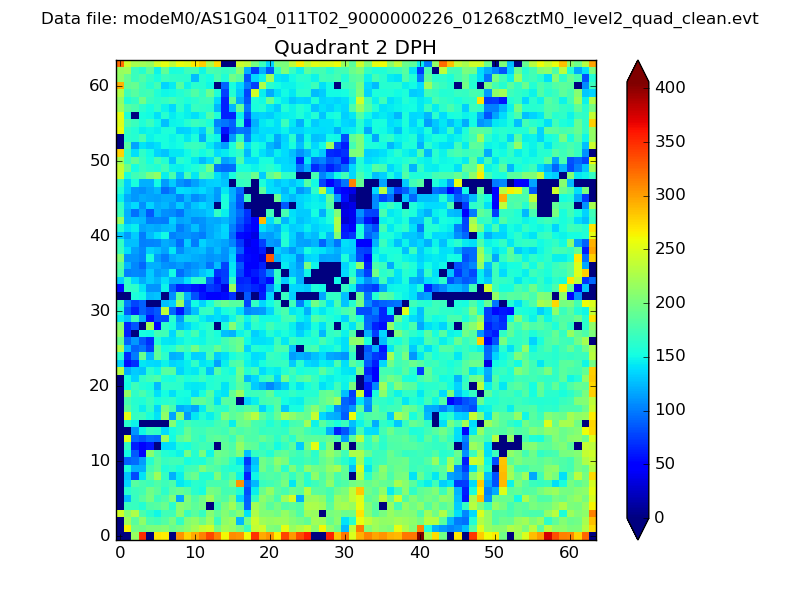
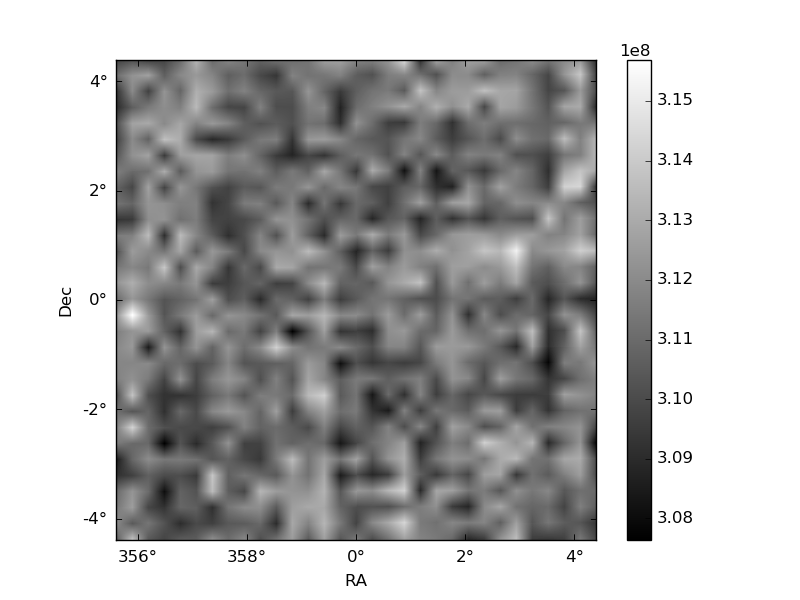
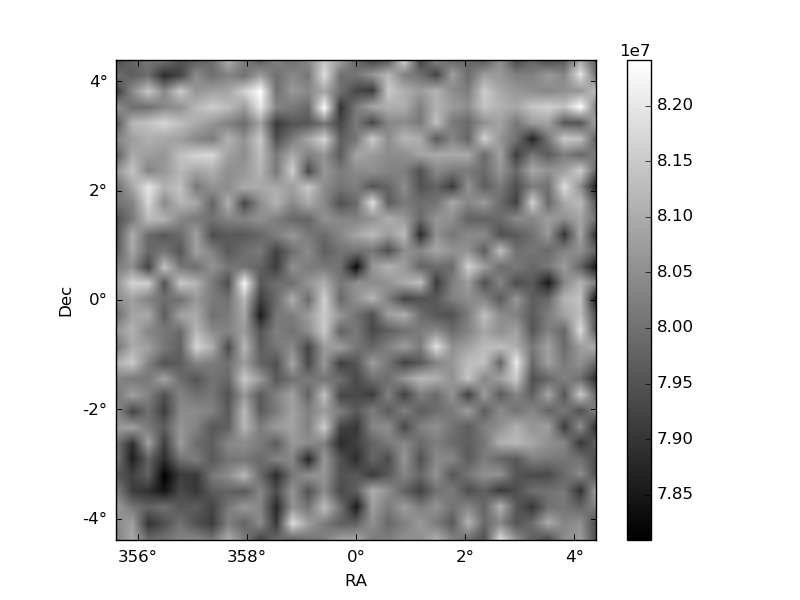
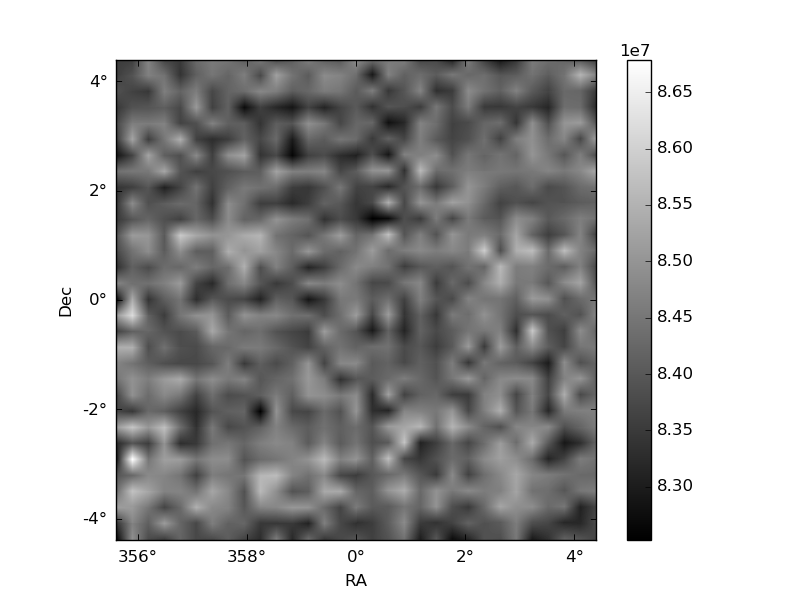
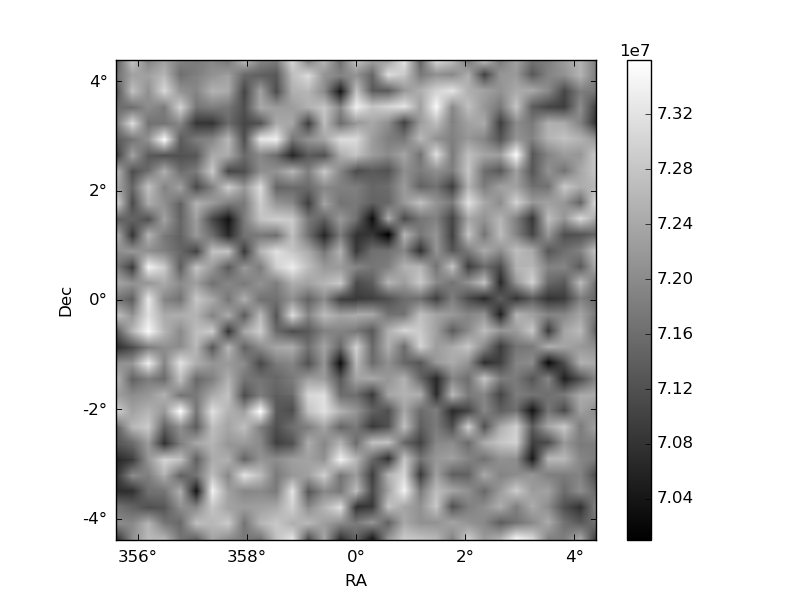
Histogram calculated using DETX and DETY for each event in the final _common_clean file
| Quadrant A | 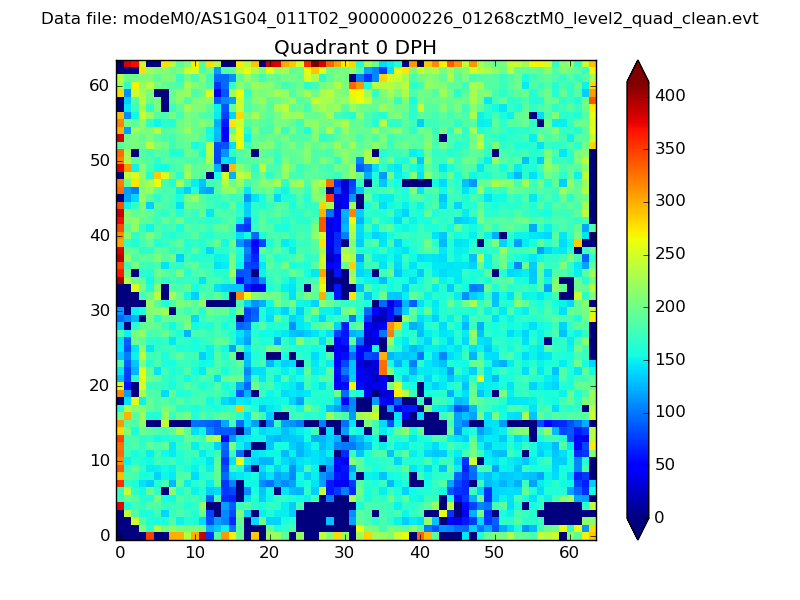 |
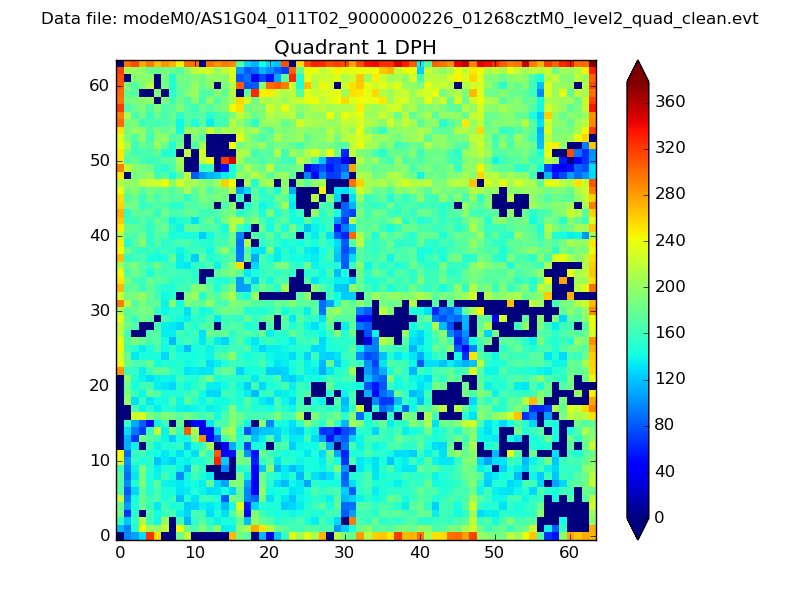 |
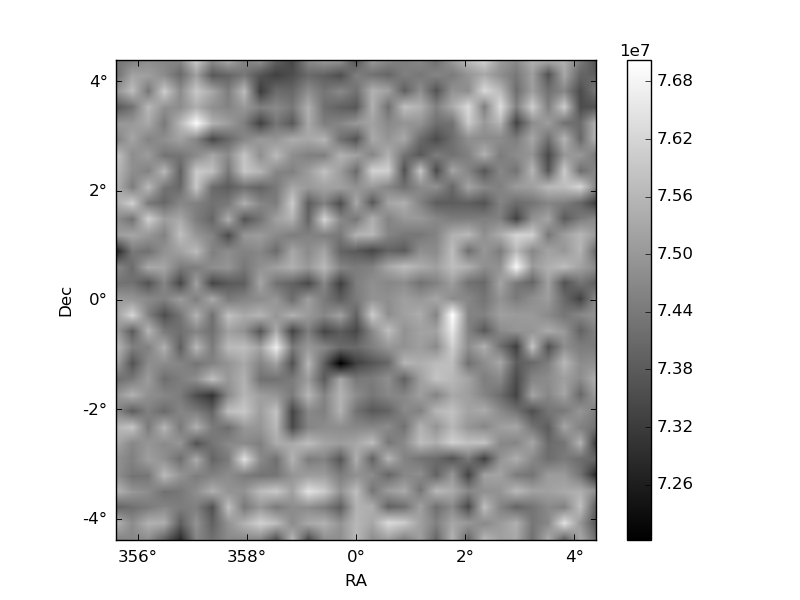
Quadrant B |
|---|---|---|---|
| Quadrant D | 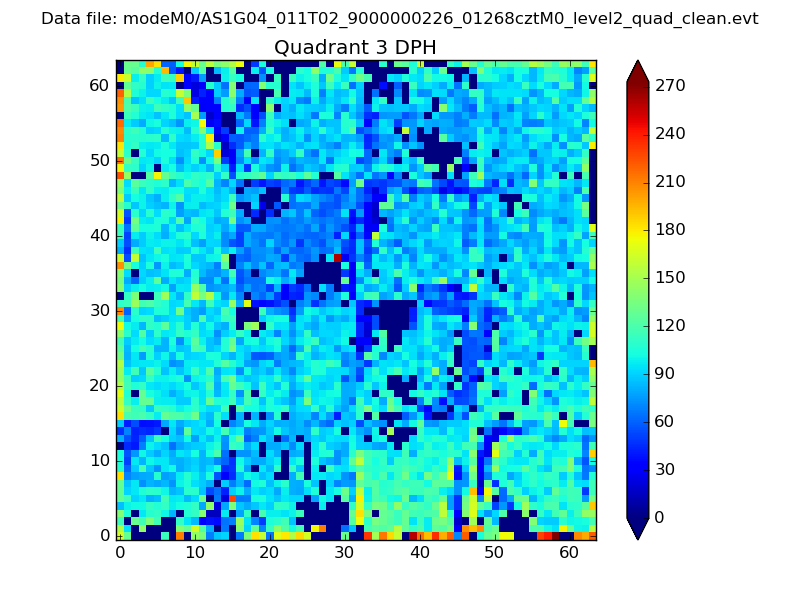 |
 |
Quadrant C |
| Plot type | Count rate plots | Images |
|---|---|---|
| Comparison with Poisson distribution Blue bars denote a histogram of data divided into 1 sec bins. Red curve is a Poisson curve with rate = median count rate of data. |
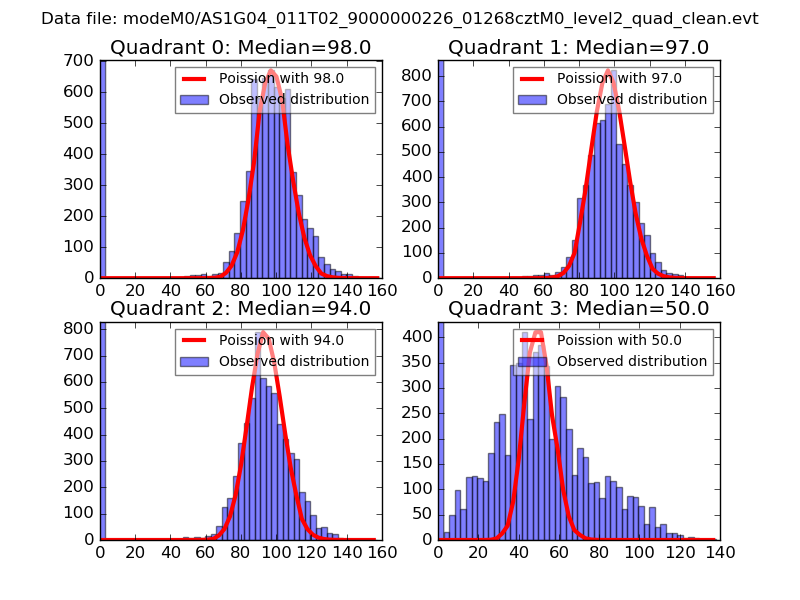 |
 |
| Quadrant-wise count rates Data is divided into 100 sec bins |
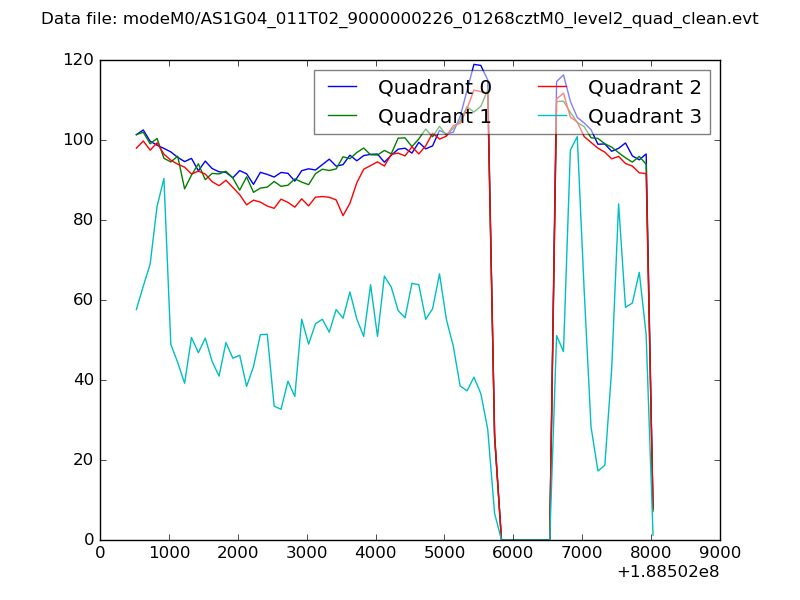 |
|
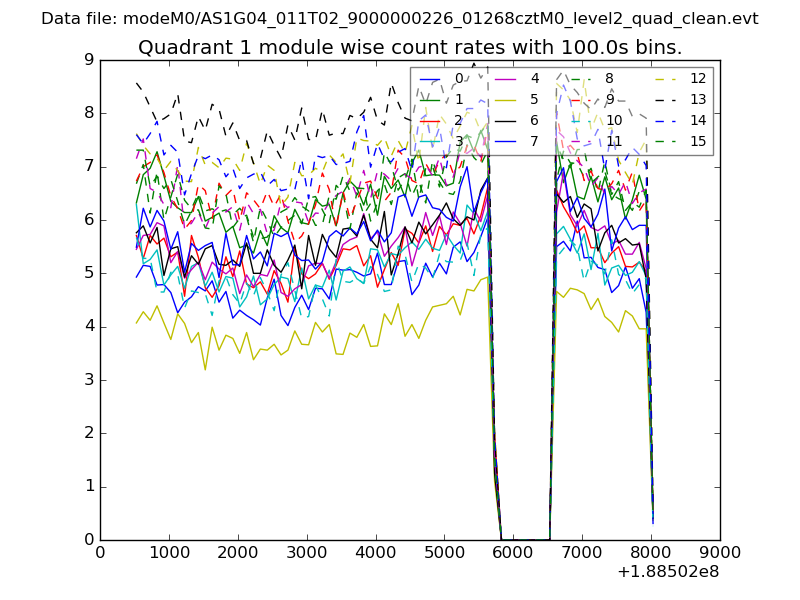
| Module-wise count rates for Quadrant A Data is divided into 100 sec bins |
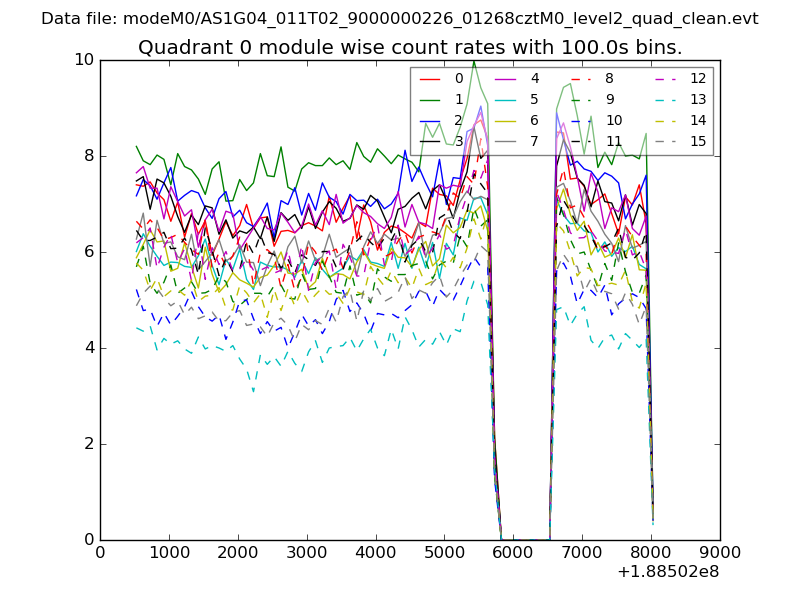 |
 |
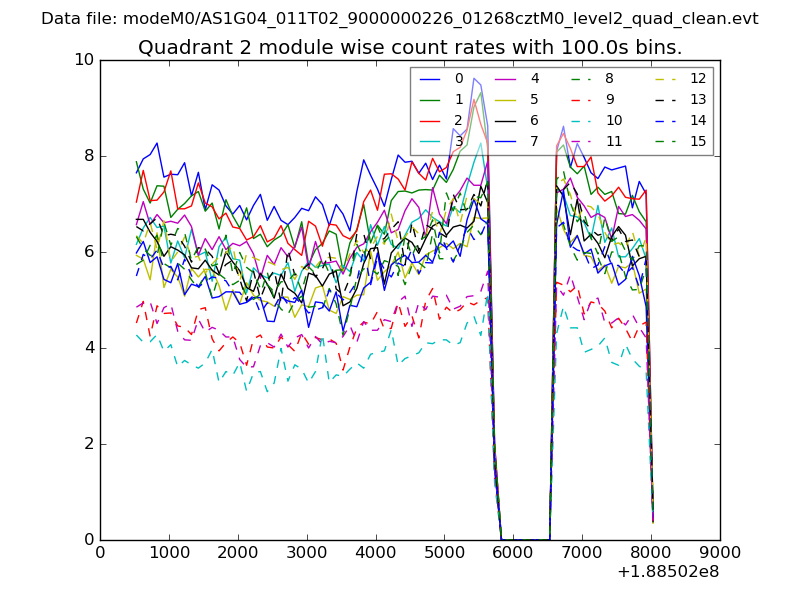
| Module-wise count rates for Quadrant B Data is divided into 100 sec bins |
 |
 |
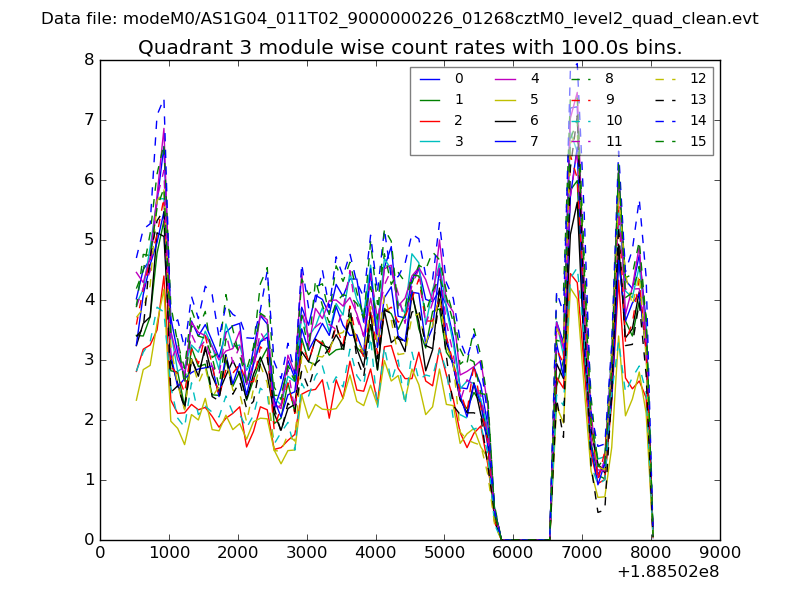
| Module-wise count rates for Quadrant C Data is divided into 100 sec bins |
 |
 |
| Module-wise count rates for Quadrant D Data is divided into 100 sec bins |
 |
 |
| Parameter | Plot |
|---|---|
| CZT HV Monitor | 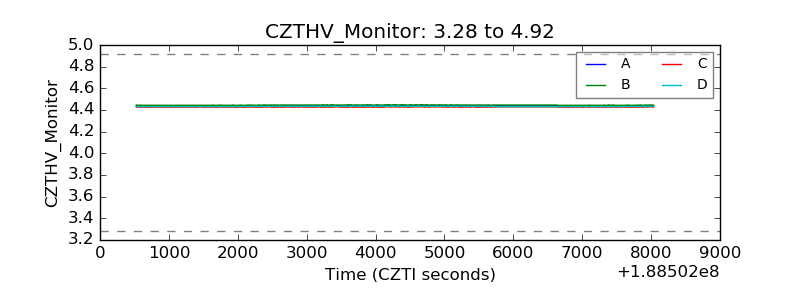 |
| D_VDD | 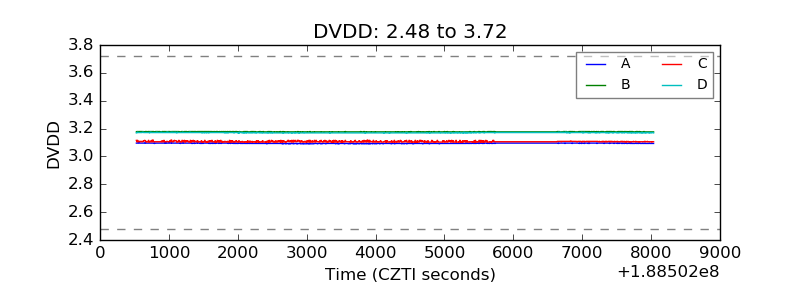 |
| Temperature 1 | 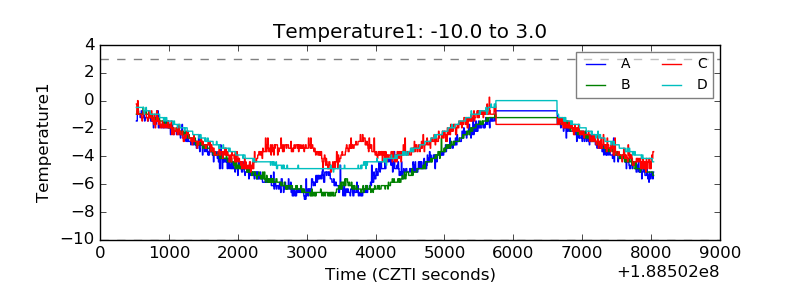 |
| Veto HV Monitor | 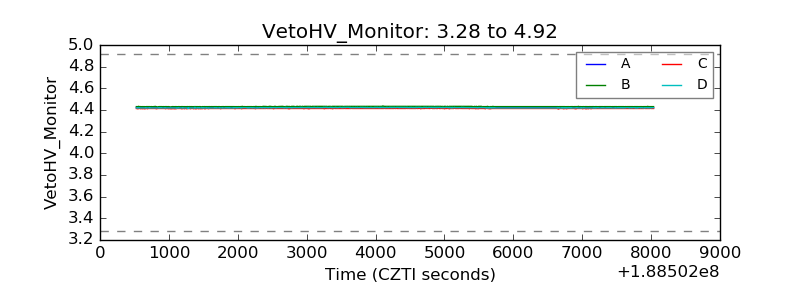 |
| Veto LLD | 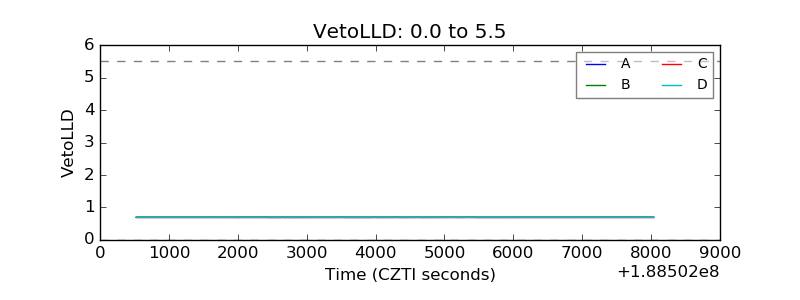 |
| Alpha Counter | 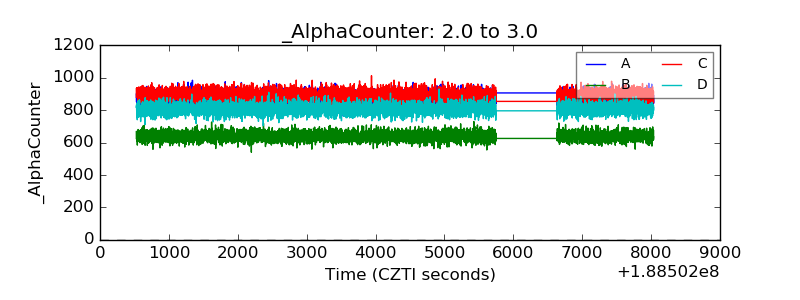 |
| _CPM_Rate | 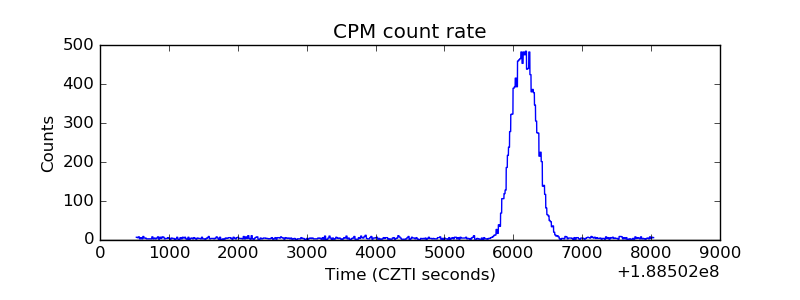 |
| CZT Counter | 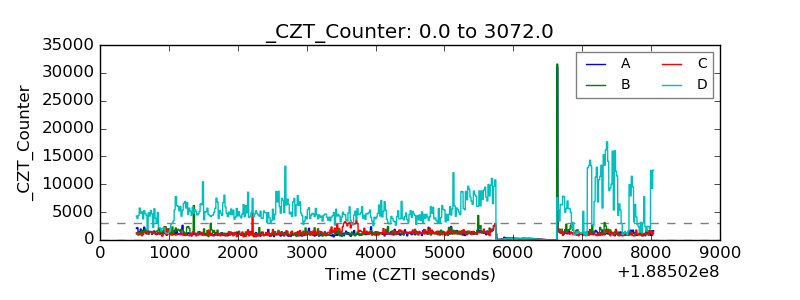 |
| +2.5 Volts monitor | 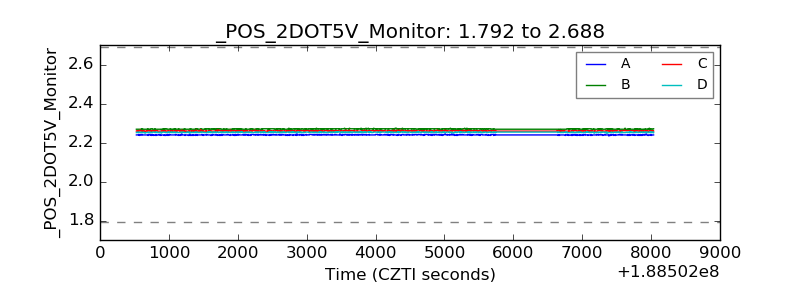 |
| +5 Volts monitor | 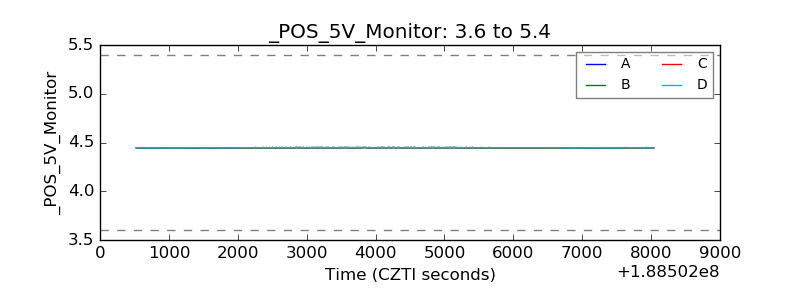 |
| _ROLL_ROT | 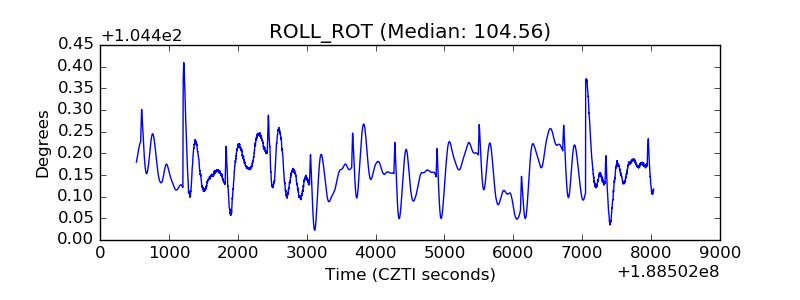 |
| _Roll_DEC | 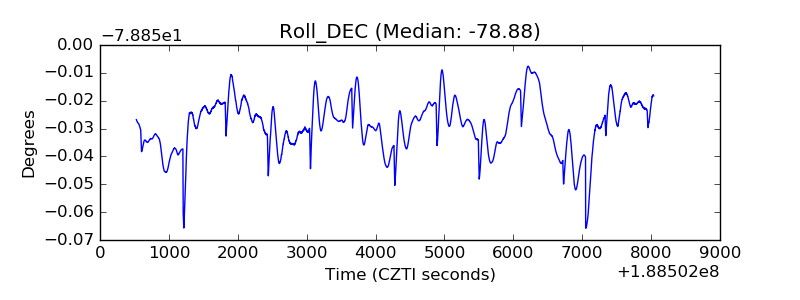 |
| _Roll_RA | 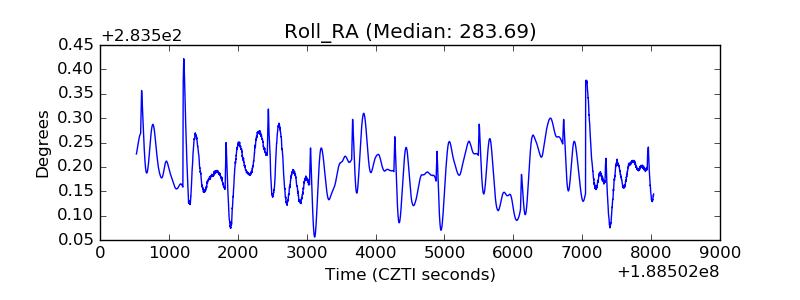 |
| Veto Counter | 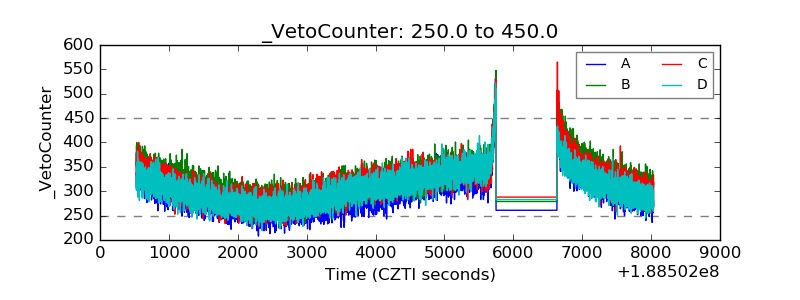 |