| Param | Original file | Final file |
|---|---|---|
| Filename | modeM0/AS1G04_011T02_9000000226_01269cztM0_level2.evt | modeM0/AS1G04_011T02_9000000226_01269cztM0_level2_quad_clean.evt |
| Size (bytes) | 1,352,113,920 | 90,466,560 |
| Size | 1.3 GB | 86.3 MB |
| Events in quadrant A | 7,461,255 | 660,288 |
| Events in quadrant B | 8,553,946 | 645,750 |
| Events in quadrant C | 7,935,518 | 629,655 |
| Events in quadrant D | 16,573,210 | 353,086 |
| Mode SS | |||
|---|---|---|---|
| Quadrant | BADHDUFLAG | Total packets | Discarded packets |
| A | 0 | 132 | 0 |
| B | 0 | 132 | 0 |
| C | 0 | 132 | 0 |
| D | 0 | 132 | 0 |
| Mode M9 | |||
|---|---|---|---|
| Quadrant | BADHDUFLAG | Total packets | Discarded packets |
| A | 0 | 10 | 0 |
| B | 0 | 10 | 0 |
| C | 0 | 10 | 0 |
| D | 0 | 10 | 0 |
| Mode M0 | |||
|---|---|---|---|
| Quadrant | BADHDUFLAG | Total packets | Discarded packets |
| A | 0 | 26743 | 2 |
| B | 0 | 29972 | 1 |
| C | 0 | 28091 | 1 |
| D | 0 | 54447 | 1 |
| Quadrant | Total seconds | Saturated seconds | Saturation percentage |
|---|---|---|---|
| A | 6431 | 16 | 0.248795% |
| B | 6431 | 33 | 0.513139% |
| C | 6431 | 27 | 0.419841% |
| D | 6431 | 4149 | 64.515627% |
Noise dominated data is calculated using 1-second bins in cleaned event files. If a bin has >2000 counts, and if more than 50% of those come from <1% of pixels, then it is considered to be noise-dominated and hence unusable.
| Quadrant | # 1 sec bins | Bins with >0 counts | Bins with >2000 counts | High rate bins dominated by noise | Noise dominated (total time) | Noise dominated (detector-on time) | Marked lightcurve |
|---|---|---|---|---|---|---|---|
| A | 7481 | 6431 | 129 | 129 | 1.72% | 2.01% | 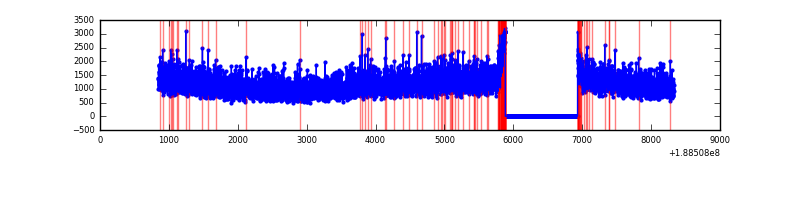 |
| B | 7480 | 6430 | 427 | 427 | 5.71% | 6.64% | 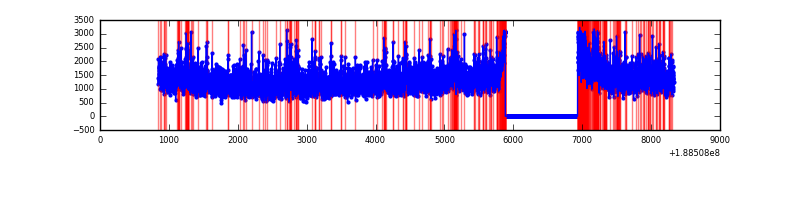 |
| C | 7481 | 6432 | 265 | 265 | 3.54% | 4.12% | 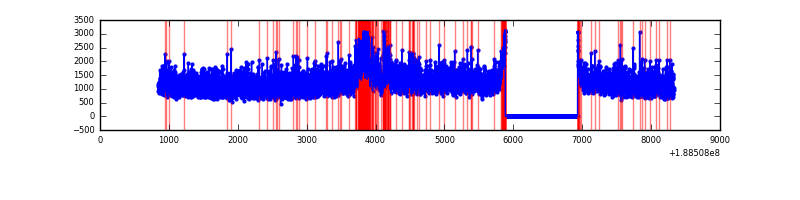 |
| D | 7480 | 6430 | 4749 | 4749 | 63.49% | 73.86% | 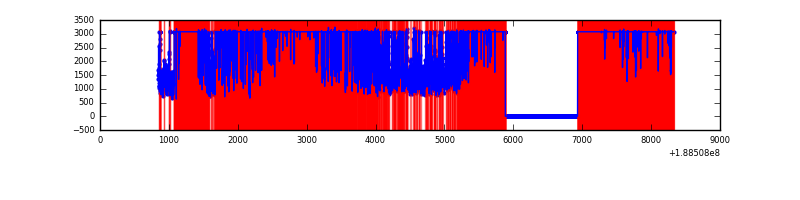 |
Top three noisy pixels from each quadrant. If the there are fewer than three noisy pixels in the level2.evt file, extra rows are filled as -1
| Pixel properties | Quadrant properties | ||||||
|---|---|---|---|---|---|---|---|
| Quadrant | DetID | PixID | Counts | Sigma | Mean | Median | Sigma |
| A | 8 | 14 | 26468 | 52.25 | 1935 | 1950 | 469.3 |
| A | 13 | 235 | 7042 | 10.85 | 1935 | 1950 | 469.3 |
| A | 3 | 111 | 5951 | 8.53 | 1935 | 1950 | 469.3 |
| B | 8 | 4 | 593529 | 1228.93 | 2042 | 2049 | 481.3 |
| B | 6 | 53 | 91302 | 185.44 | 2042 | 2049 | 481.3 |
| B | 3 | 204 | 33555 | 65.46 | 2042 | 2049 | 481.3 |
| C | 8 | 208 | 480969 | 946.35 | 1819 | 1883 | 506.2 |
| C | 15 | 241 | 293521 | 576.08 | 1819 | 1883 | 506.2 |
| C | 3 | 111 | 24564 | 44.8 | 1819 | 1883 | 506.2 |
| D | 13 | 169 | 11009456 | 31662.94 | 1128 | 1167 | 347.7 |
| D | 10 | 84 | 1258483 | 3616.39 | 1128 | 1167 | 347.7 |
| D | 12 | 22 | 51104 | 143.63 | 1128 | 1167 | 347.7 |
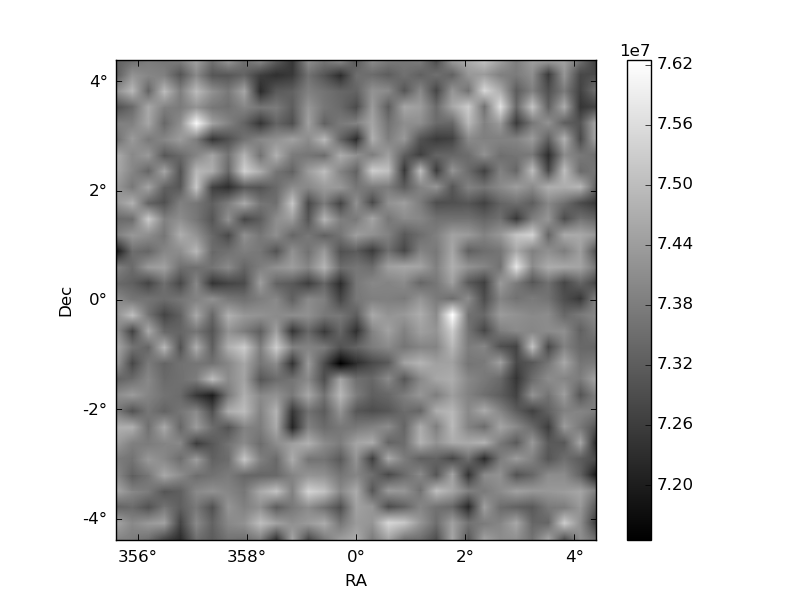
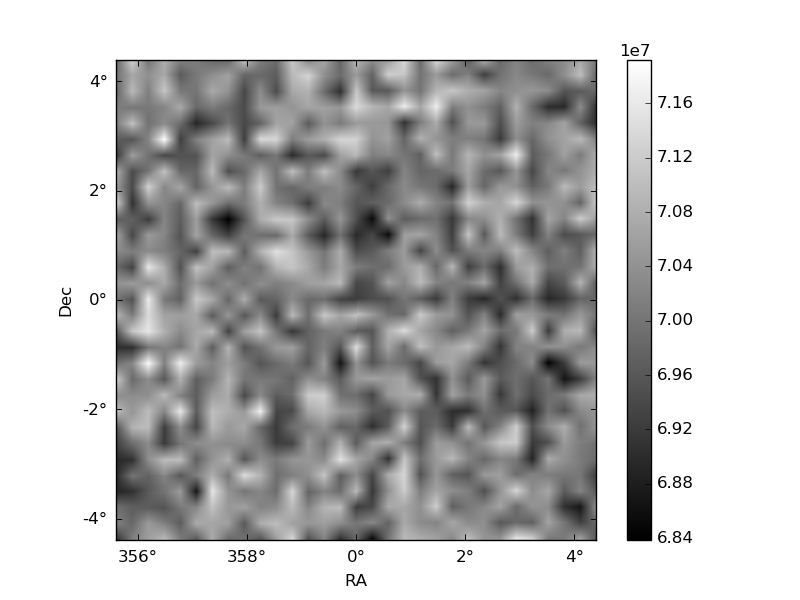
Histogram calculated using DETX and DETY for each event in the final _common_clean file
| Quadrant A | 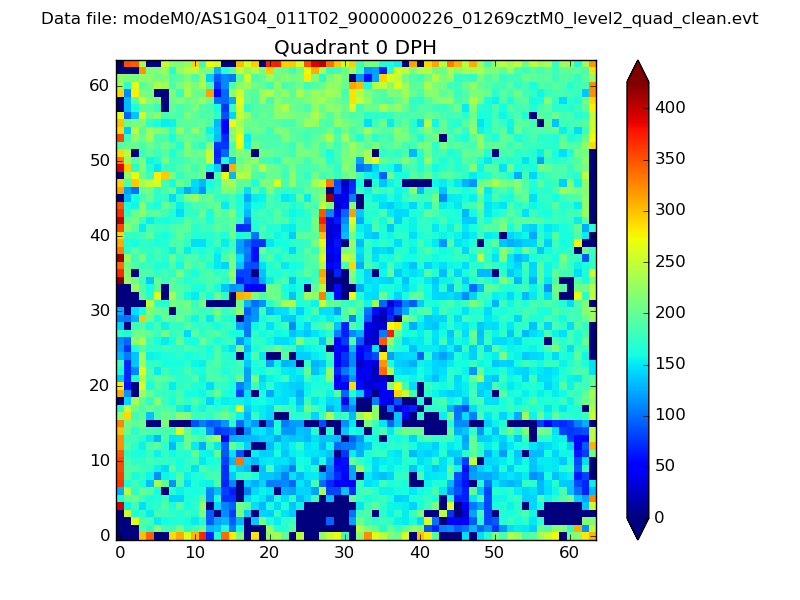 |
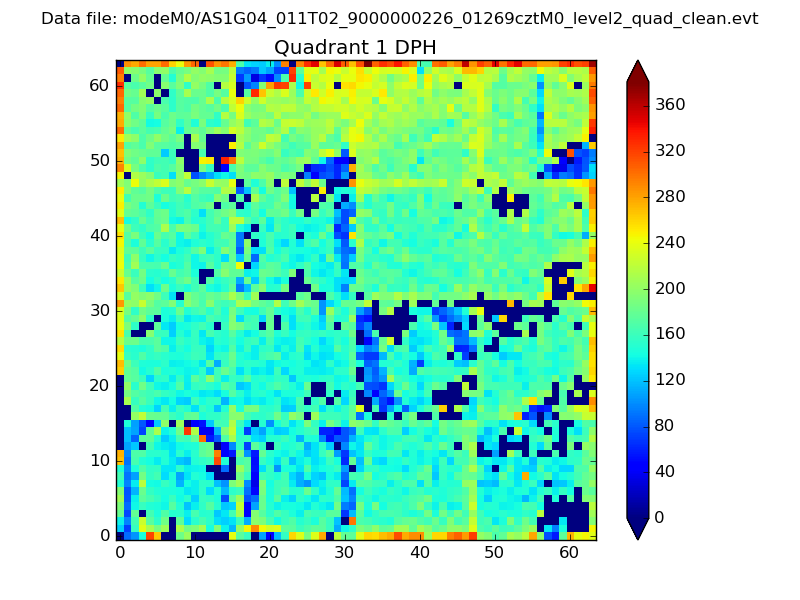 |
Quadrant B |
|---|---|---|---|
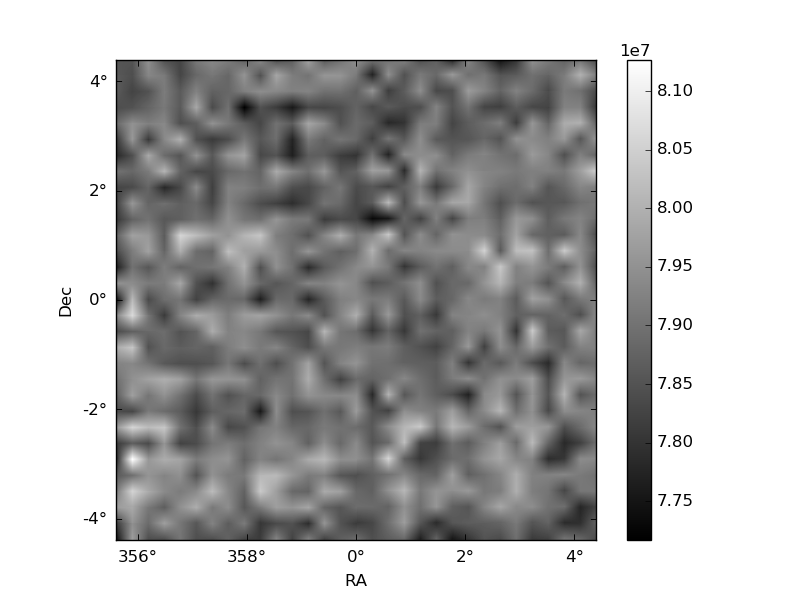
| Quadrant D | 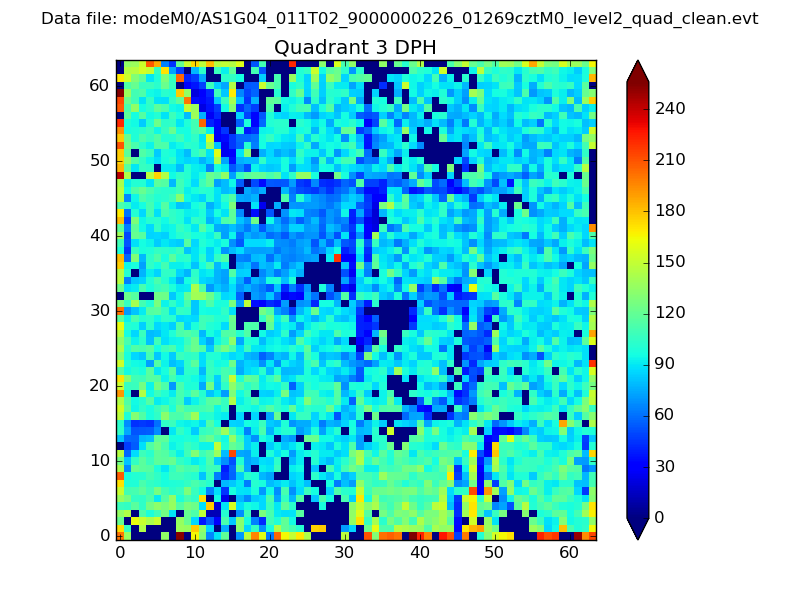 |
 |
Quadrant C |
| Plot type | Count rate plots | Images |
|---|---|---|
| Comparison with Poisson distribution Blue bars denote a histogram of data divided into 1 sec bins. Red curve is a Poisson curve with rate = median count rate of data. |
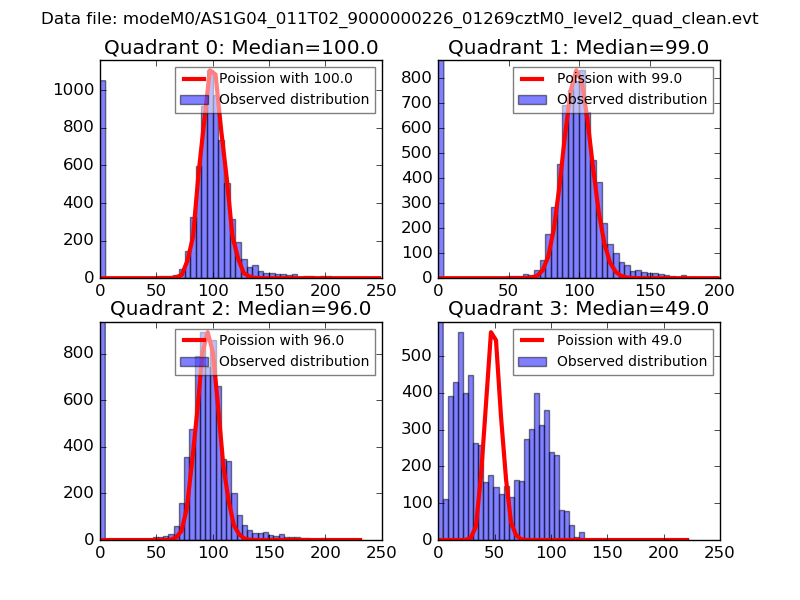 |
 |
| Quadrant-wise count rates Data is divided into 100 sec bins |
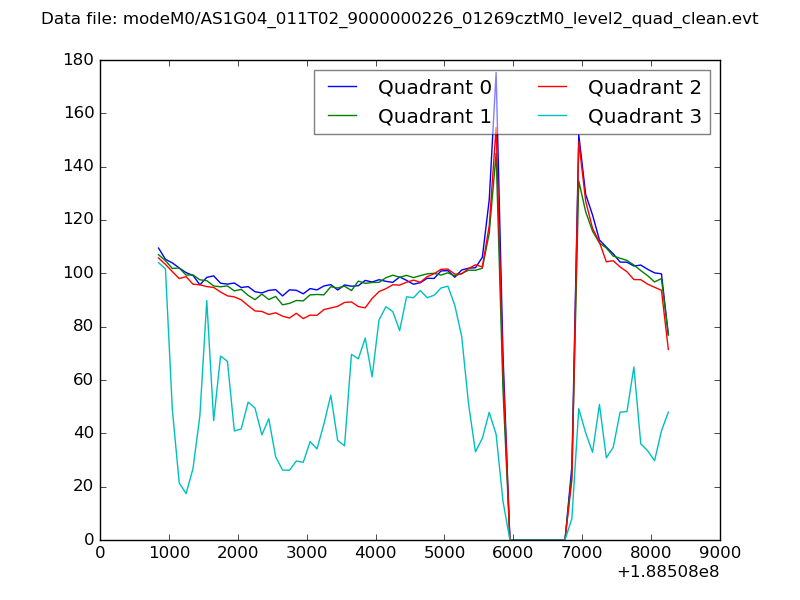 |
|
| Module-wise count rates for Quadrant A Data is divided into 100 sec bins |
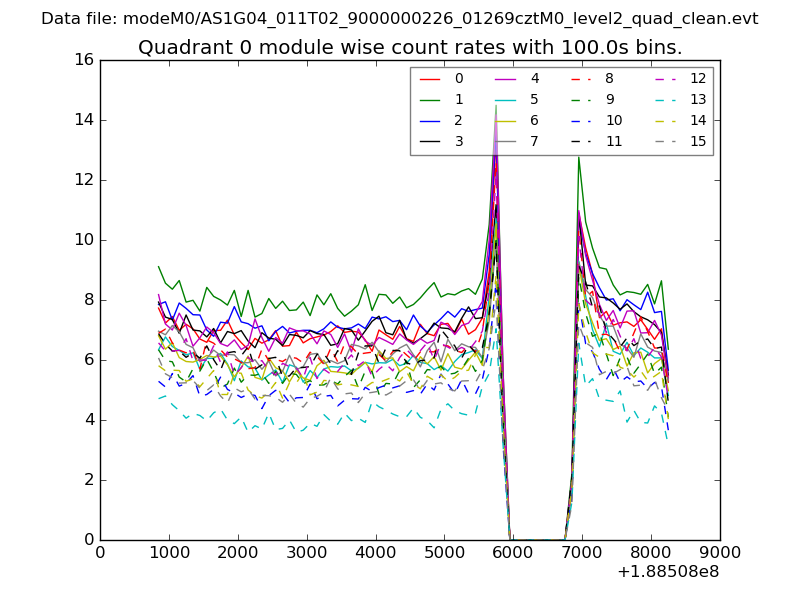 |
 |
| Module-wise count rates for Quadrant B Data is divided into 100 sec bins |
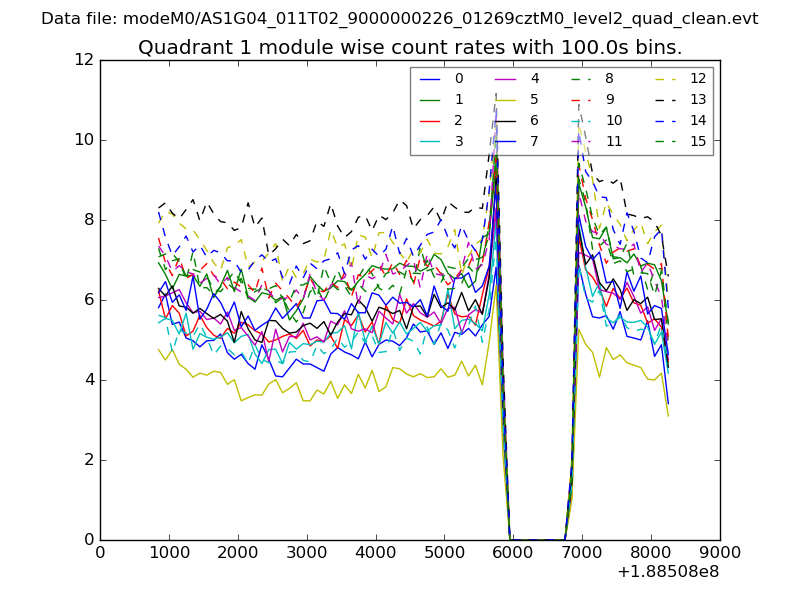 |
 |
| Module-wise count rates for Quadrant C Data is divided into 100 sec bins |
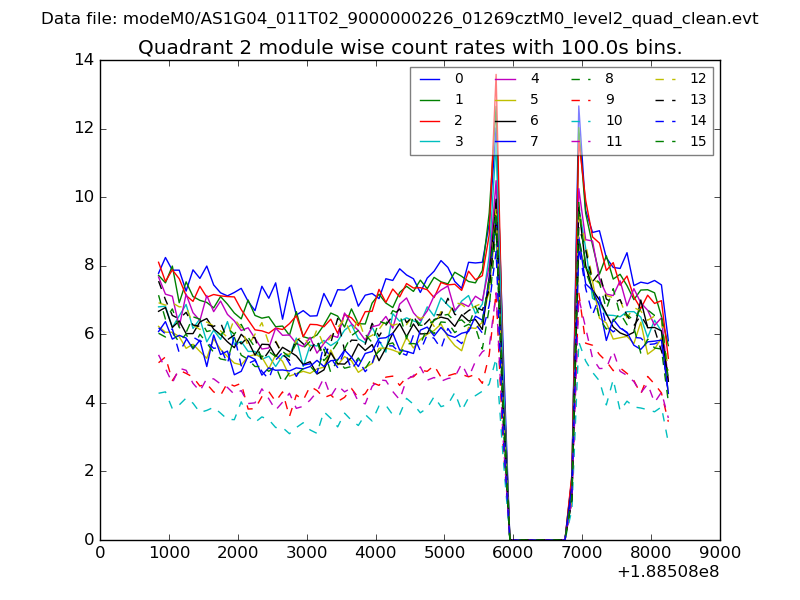 |
 |
| Module-wise count rates for Quadrant D Data is divided into 100 sec bins |
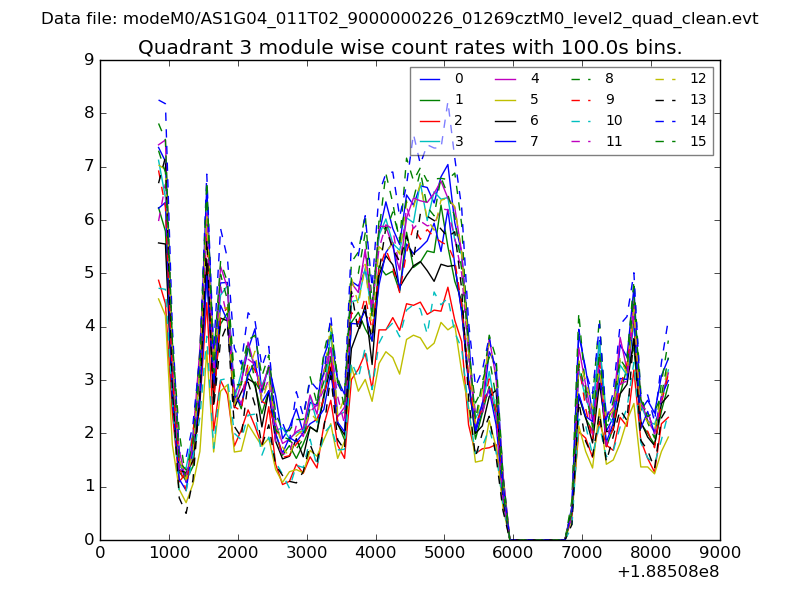 |
 |
| Parameter | Plot |
|---|---|
| CZT HV Monitor | 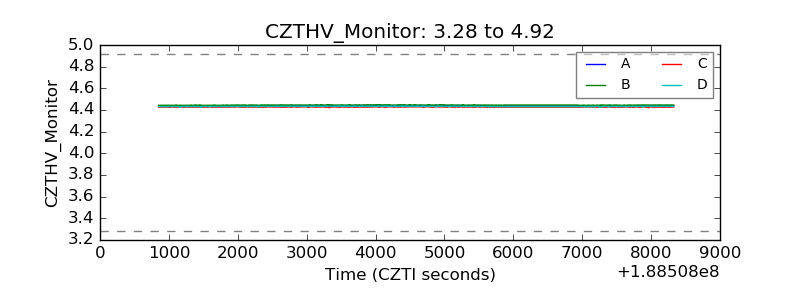 |
| D_VDD | 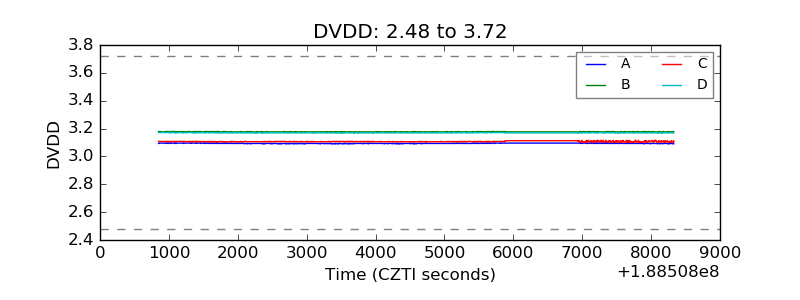 |
| Temperature 1 | 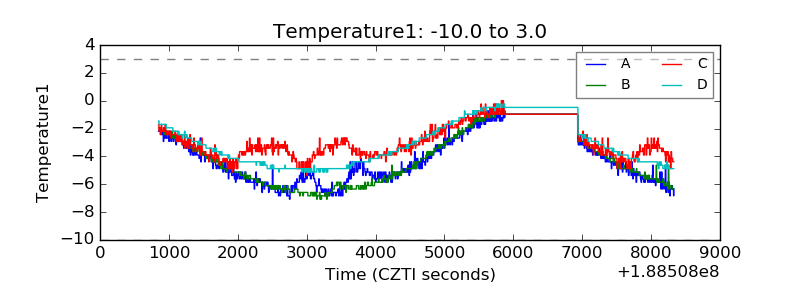 |
| Veto HV Monitor | 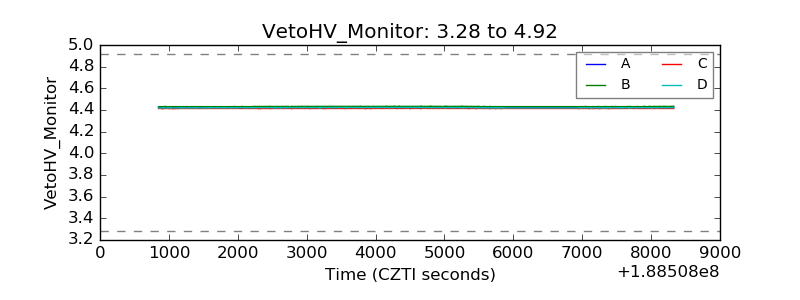 |
| Veto LLD | 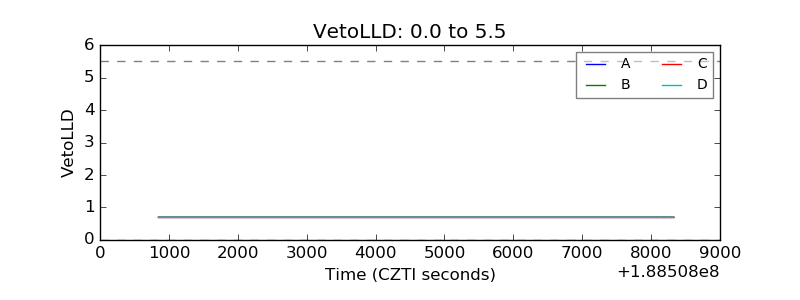 |
| Alpha Counter | 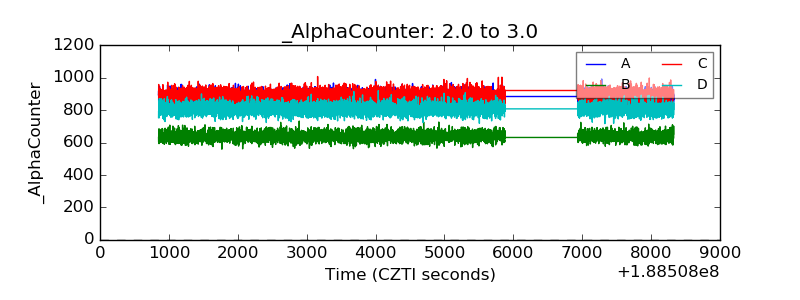 |
| _CPM_Rate | 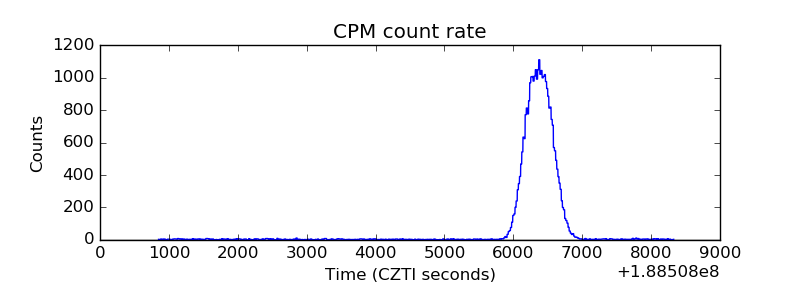 |
| CZT Counter | 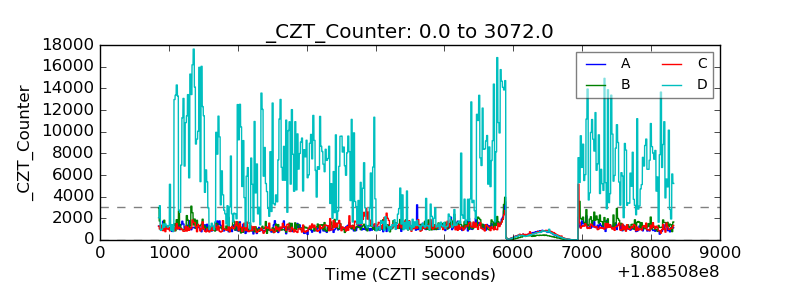 |
| +2.5 Volts monitor |  |
| +5 Volts monitor |  |
| _ROLL_ROT | 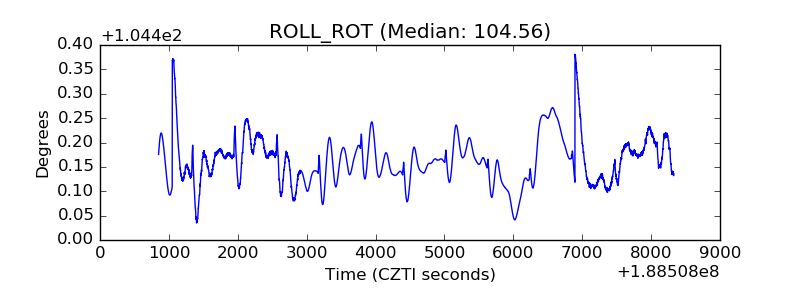 |
| _Roll_DEC | 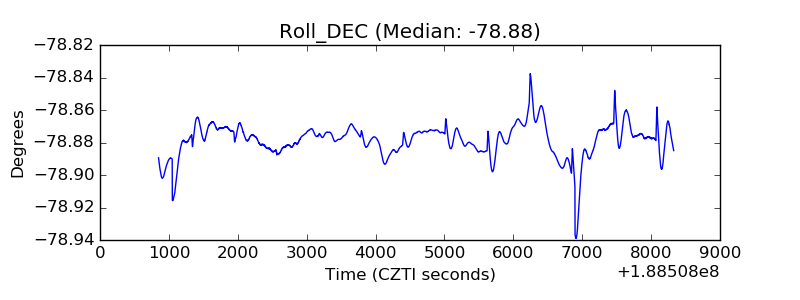 |
| _Roll_RA | 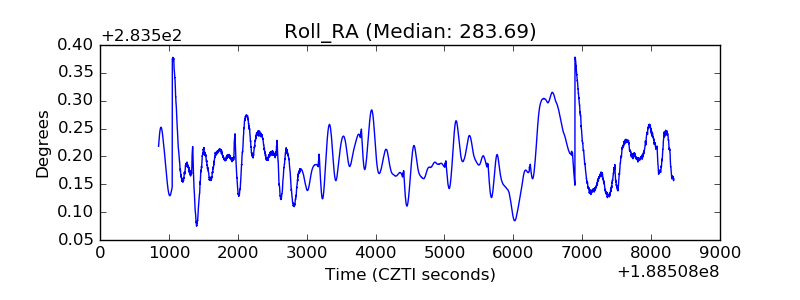 |
| Veto Counter | 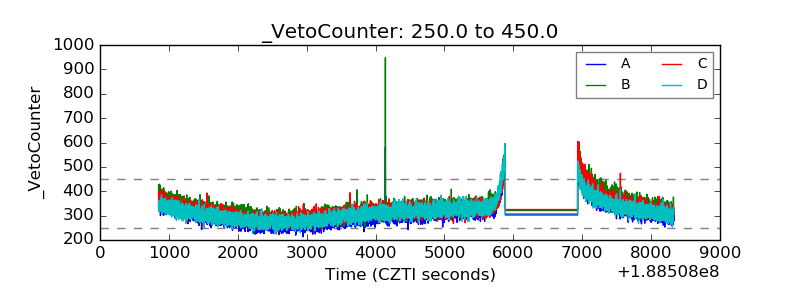 |