| Param | Original file | Final file |
|---|---|---|
| Filename | modeM0/AS1G04_011T02_9000000226_01271cztM0_level2.evt | modeM0/AS1G04_011T02_9000000226_01271cztM0_level2_quad_clean.evt |
| Size (bytes) | 1,343,517,120 | 92,839,680 |
| Size | 1.3 GB | 88.5 MB |
| Events in quadrant A | 7,392,269 | 659,138 |
| Events in quadrant B | 8,998,041 | 653,970 |
| Events in quadrant C | 7,541,294 | 637,680 |
| Events in quadrant D | 16,341,479 | 419,432 |
| Mode SS | |||
|---|---|---|---|
| Quadrant | BADHDUFLAG | Total packets | Discarded packets |
| A | 0 | 128 | 0 |
| B | 0 | 128 | 0 |
| C | 0 | 128 | 0 |
| D | 0 | 128 | 0 |
| Mode M9 | |||
|---|---|---|---|
| Quadrant | BADHDUFLAG | Total packets | Discarded packets |
| A | 0 | 12 | 0 |
| B | 0 | 12 | 0 |
| C | 0 | 12 | 0 |
| D | 0 | 13 | 0 |
| Mode M0 | |||
|---|---|---|---|
| Quadrant | BADHDUFLAG | Total packets | Discarded packets |
| A | 0 | 26486 | 3 |
| B | 0 | 31153 | 2 |
| C | 0 | 26889 | 2 |
| D | 0 | 53564 | 2 |
| Quadrant | Total seconds | Saturated seconds | Saturation percentage |
|---|---|---|---|
| A | 6300 | 12 | 0.190476% |
| B | 6300 | 73 | 1.158730% |
| C | 6300 | 22 | 0.349206% |
| D | 6300 | 3695 | 58.650794% |
Noise dominated data is calculated using 1-second bins in cleaned event files. If a bin has >2000 counts, and if more than 50% of those come from <1% of pixels, then it is considered to be noise-dominated and hence unusable.
| Quadrant | # 1 sec bins | Bins with >0 counts | Bins with >2000 counts | High rate bins dominated by noise | Noise dominated (total time) | Noise dominated (detector-on time) | Marked lightcurve |
|---|---|---|---|---|---|---|---|
| A | 7505 | 6300 | 146 | 146 | 1.95% | 2.32% | 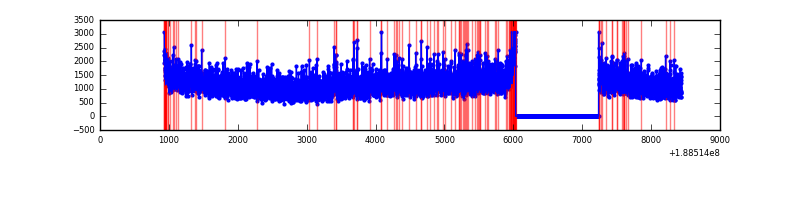 |
| B | 7504 | 6299 | 644 | 644 | 8.58% | 10.22% | 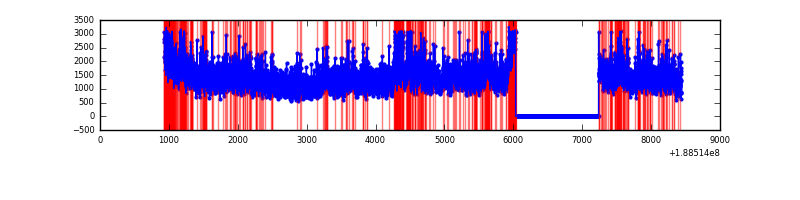 |
| C | 7505 | 6300 | 109 | 109 | 1.45% | 1.73% | 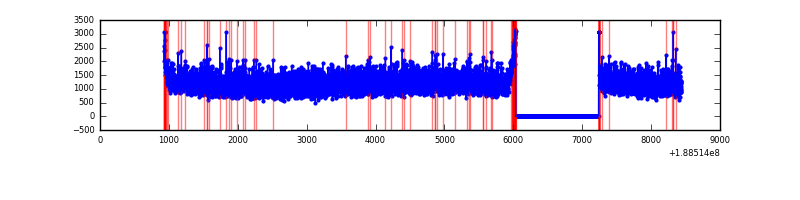 |
| D | 7505 | 6300 | 4830 | 4830 | 64.36% | 76.67% | 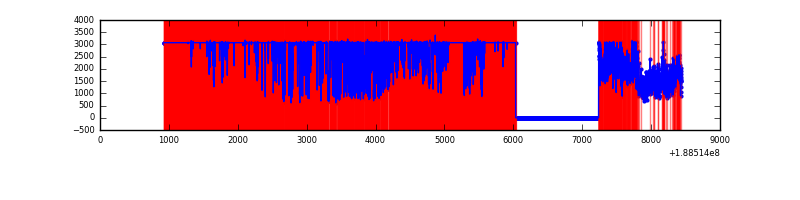 |
Top three noisy pixels from each quadrant. If the there are fewer than three noisy pixels in the level2.evt file, extra rows are filled as -1
| Pixel properties | Quadrant properties | ||||||
|---|---|---|---|---|---|---|---|
| Quadrant | DetID | PixID | Counts | Sigma | Mean | Median | Sigma |
| A | 8 | 14 | 52445 | 109.8 | 1910 | 1923 | 460.1 |
| A | 8 | 15 | 11073 | 19.89 | 1910 | 1923 | 460.1 |
| A | 13 | 235 | 6426 | 9.79 | 1910 | 1923 | 460.1 |
| B | 8 | 4 | 707700 | 1499.09 | 2008 | 2016 | 470.7 |
| B | 3 | 204 | 321261 | 678.17 | 2008 | 2016 | 470.7 |
| B | 6 | 53 | 178431 | 374.76 | 2008 | 2016 | 470.7 |
| C | 15 | 241 | 285667 | 565.54 | 1810 | 1873 | 501.8 |
| C | 8 | 208 | 111597 | 218.66 | 1810 | 1873 | 501.8 |
| C | 7 | 159 | 32163 | 60.36 | 1810 | 1873 | 501.8 |
| D | 13 | 169 | 9465413 | 24145.13 | 1282 | 1322 | 392.0 |
| D | 10 | 84 | 1992587 | 5080.19 | 1282 | 1322 | 392.0 |
| D | 12 | 22 | 19345 | 45.98 | 1282 | 1322 | 392.0 |
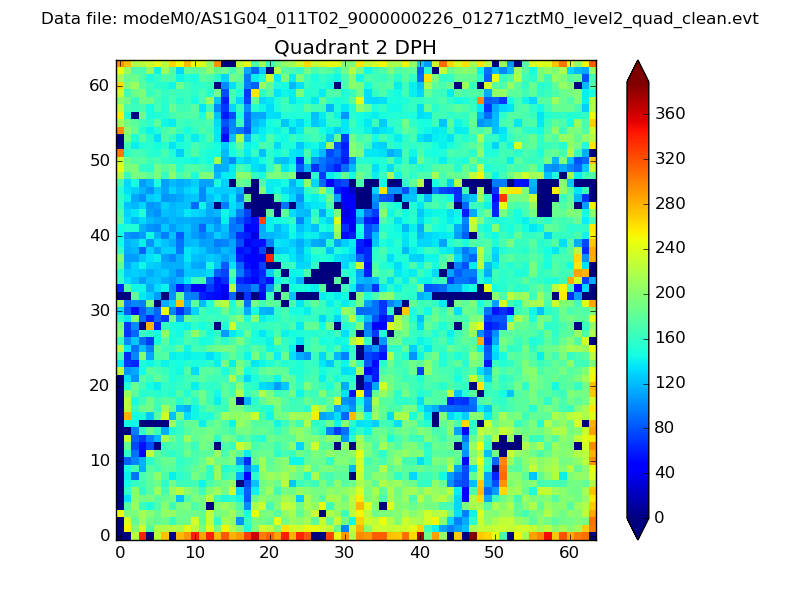
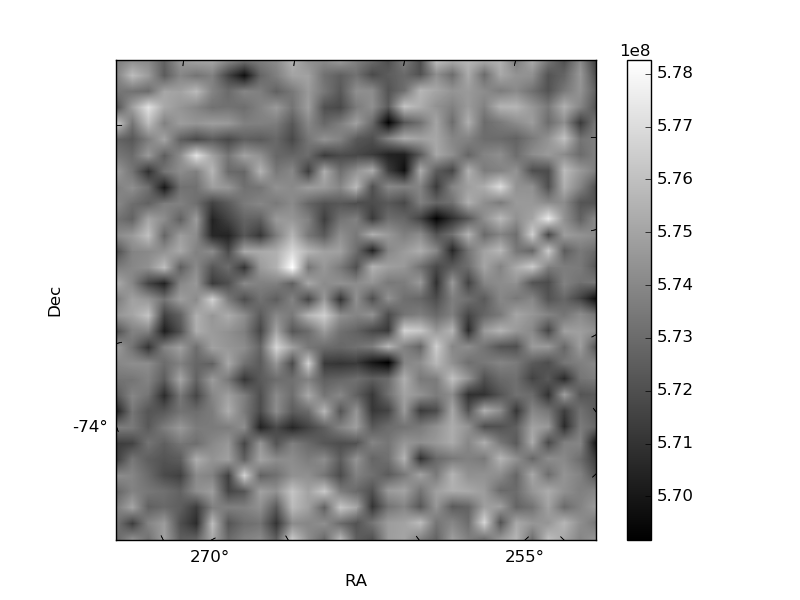
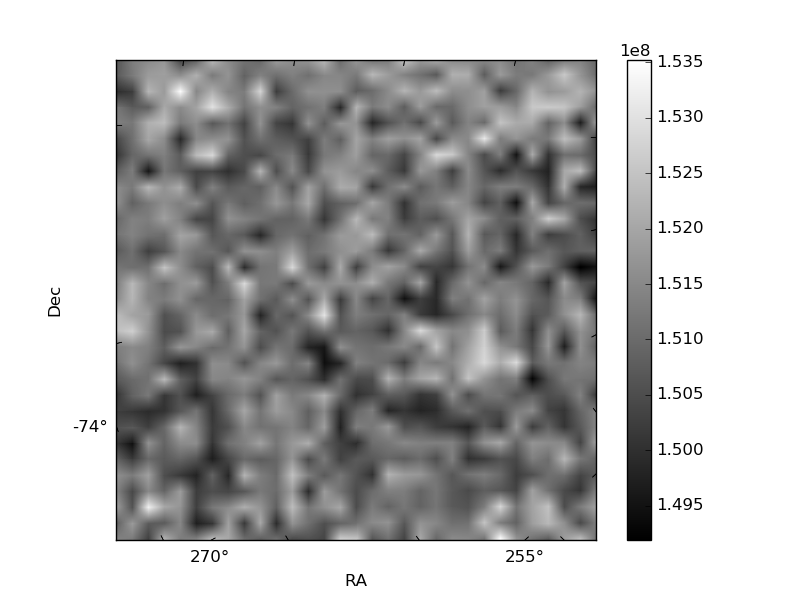
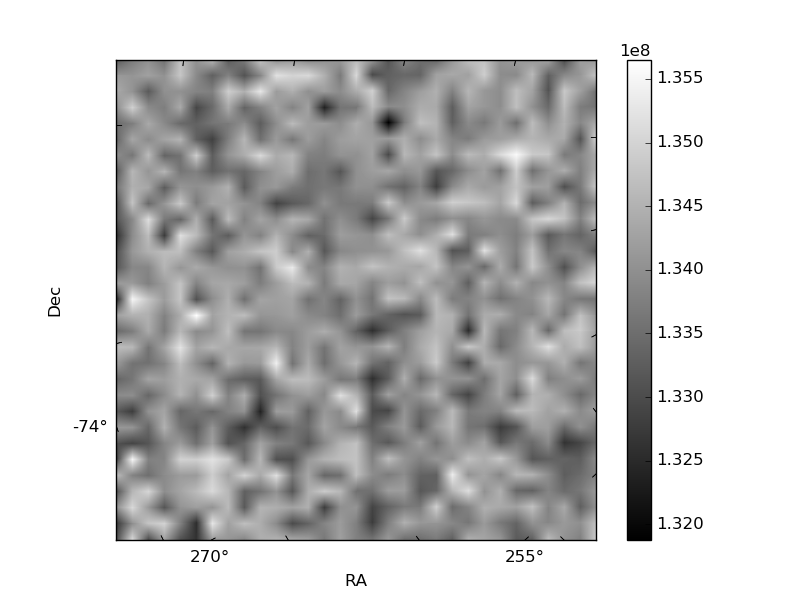
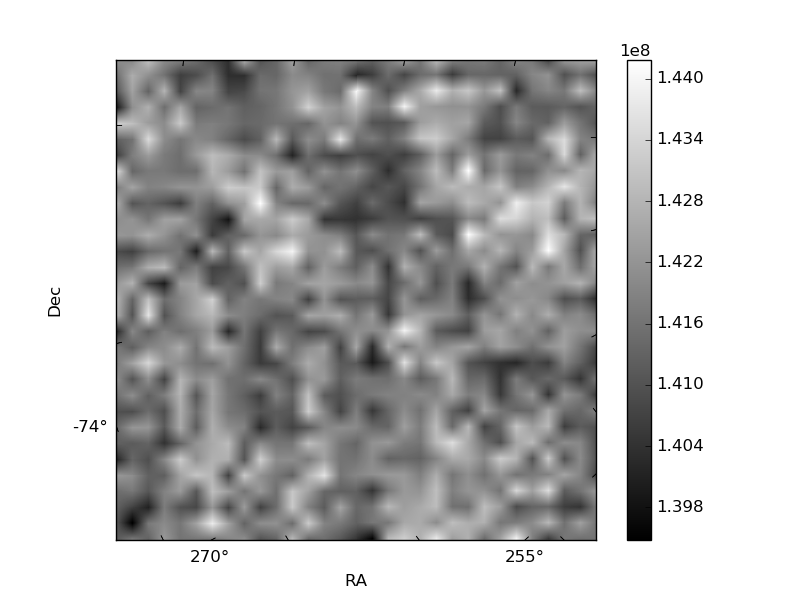
Histogram calculated using DETX and DETY for each event in the final _common_clean file
| Quadrant A | 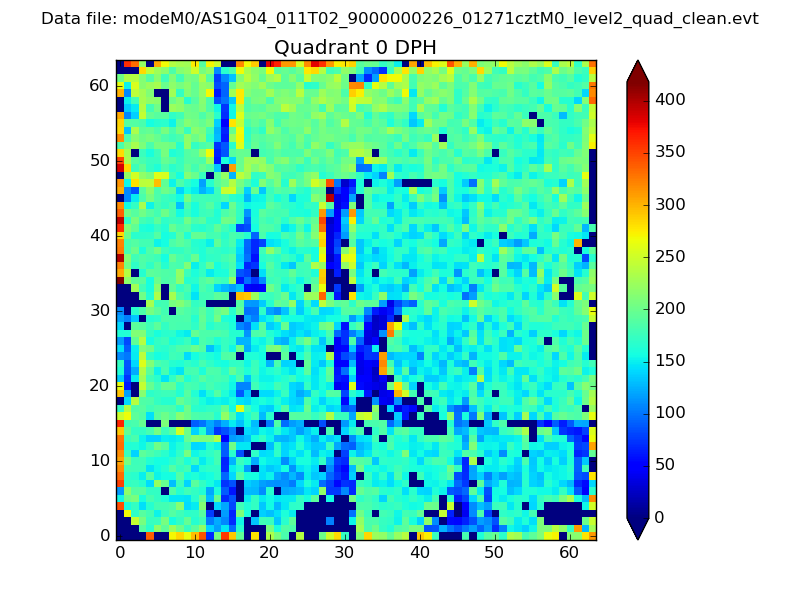 |
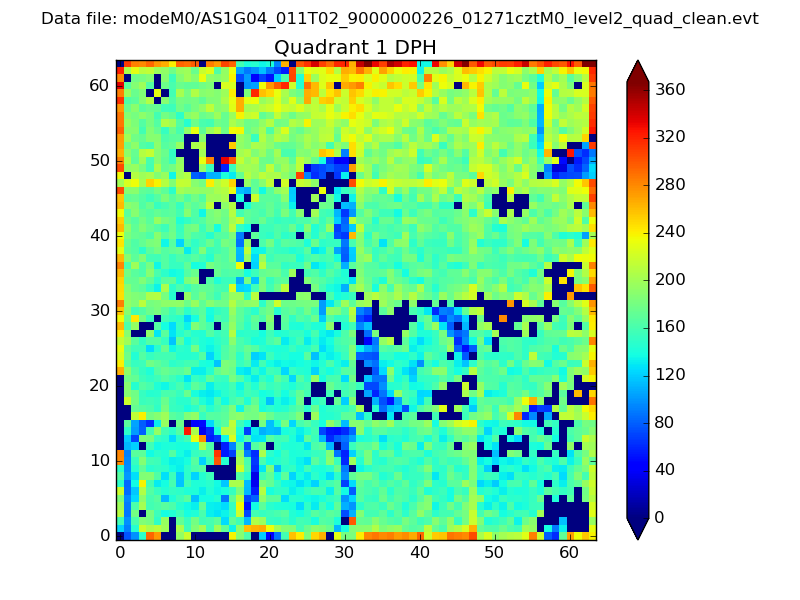 |
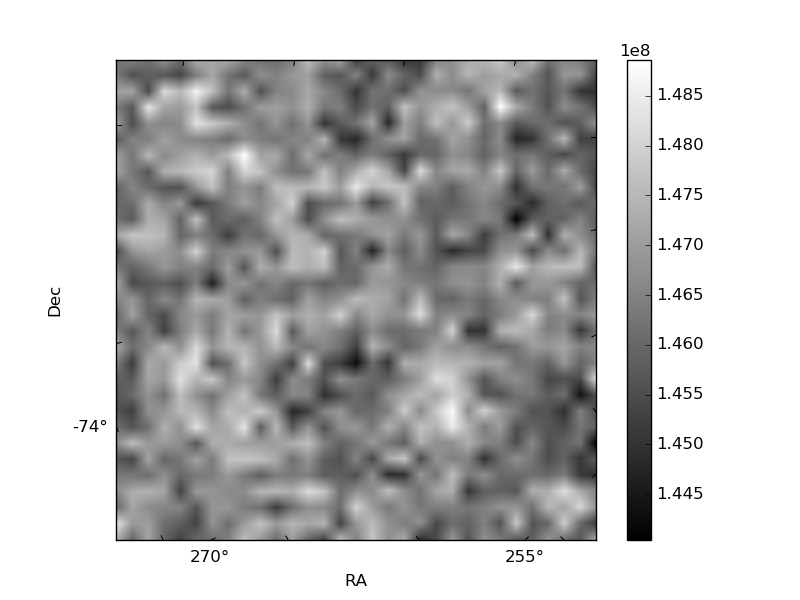
Quadrant B |
|---|---|---|---|
| Quadrant D | 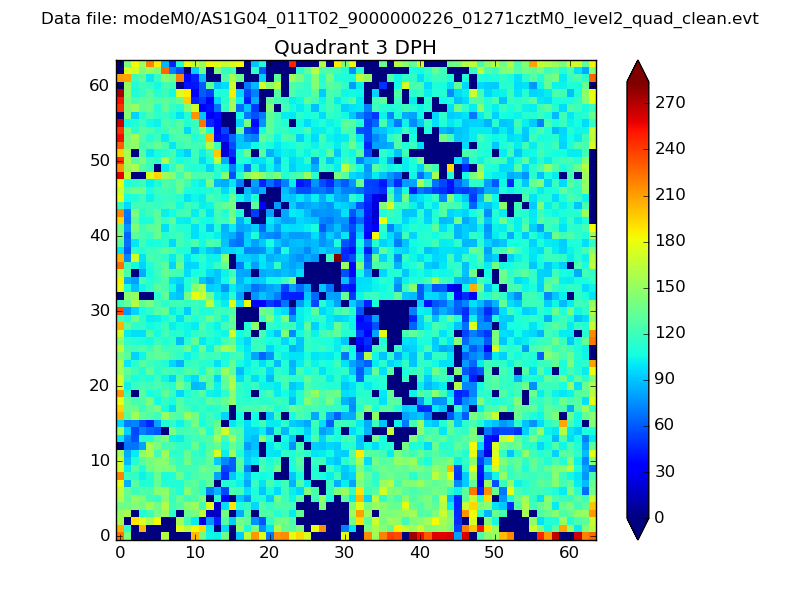 |
 |
Quadrant C |
| Plot type | Count rate plots | Images |
|---|---|---|
| Comparison with Poisson distribution Blue bars denote a histogram of data divided into 1 sec bins. Red curve is a Poisson curve with rate = median count rate of data. |
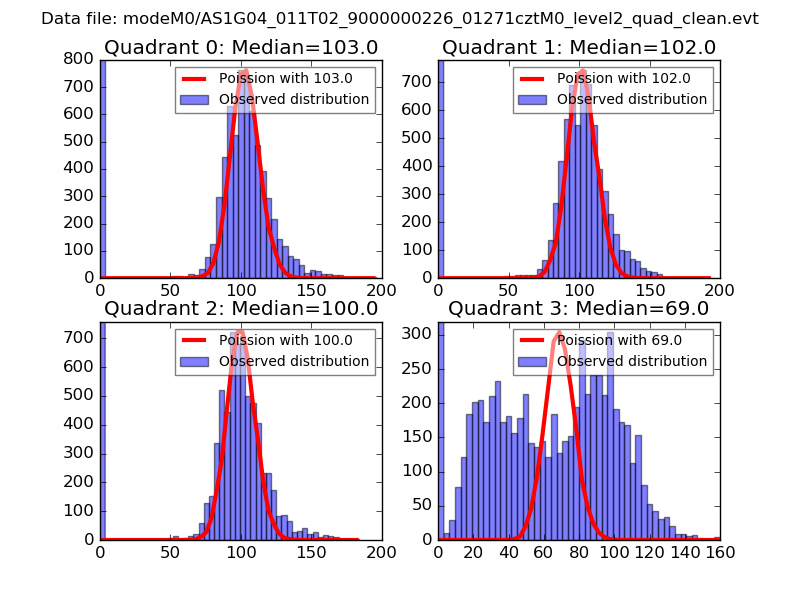 |
 |
| Quadrant-wise count rates Data is divided into 100 sec bins |
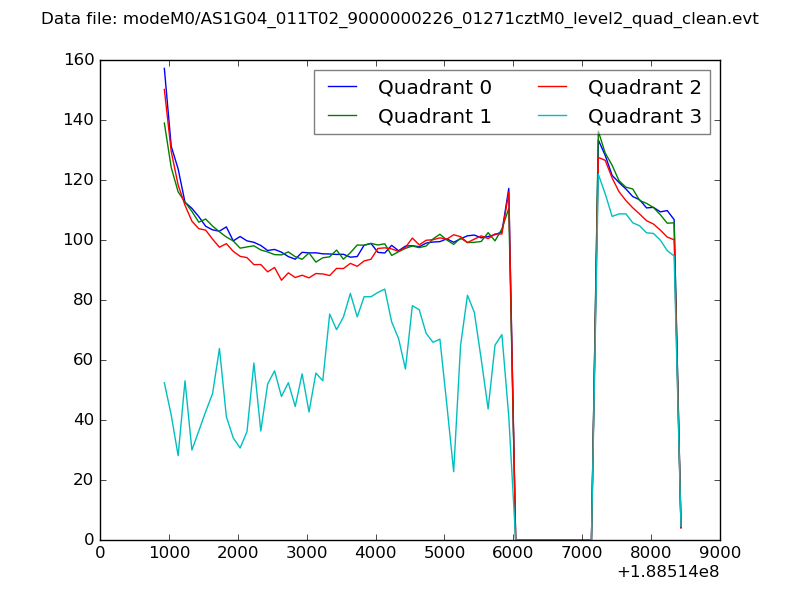 |
|
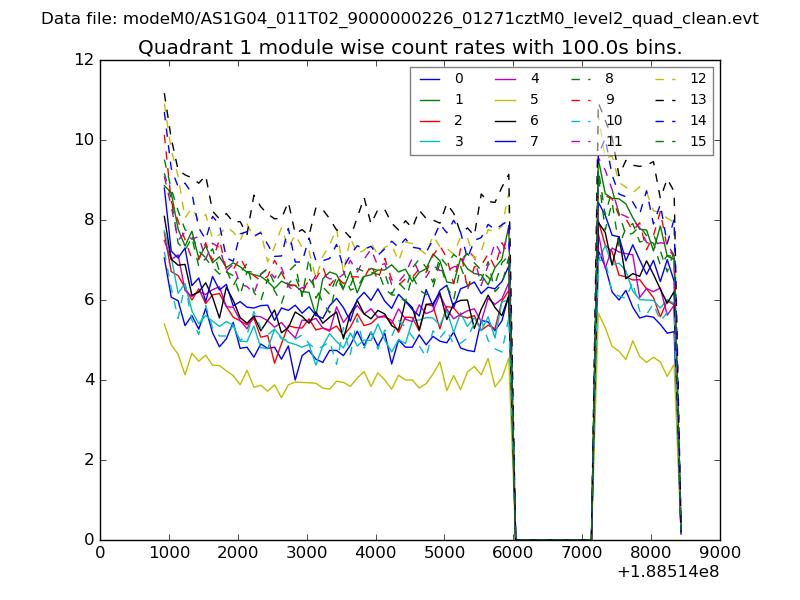
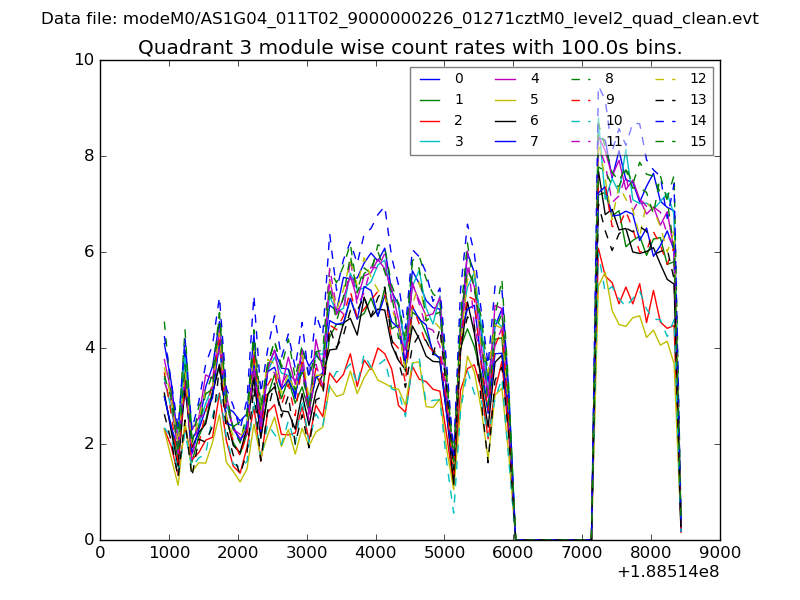
| Module-wise count rates for Quadrant A Data is divided into 100 sec bins |
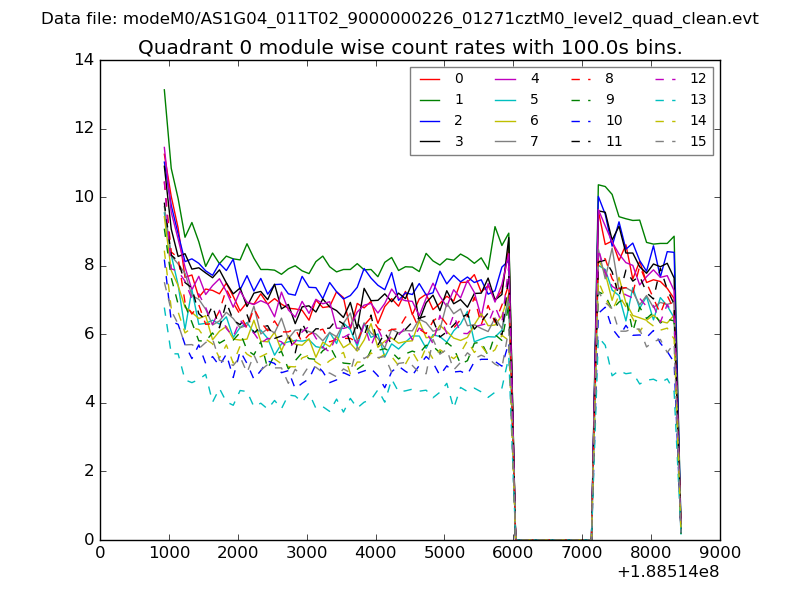 |
 |
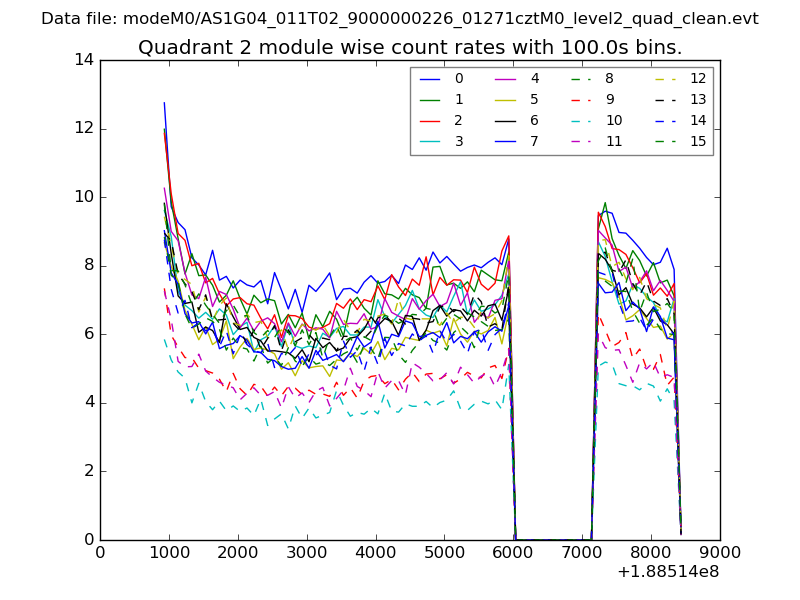
| Module-wise count rates for Quadrant B Data is divided into 100 sec bins |
 |
 |
| Module-wise count rates for Quadrant C Data is divided into 100 sec bins |
 |
 |
| Module-wise count rates for Quadrant D Data is divided into 100 sec bins |
 |
 |
| Parameter | Plot |
|---|---|
| CZT HV Monitor | 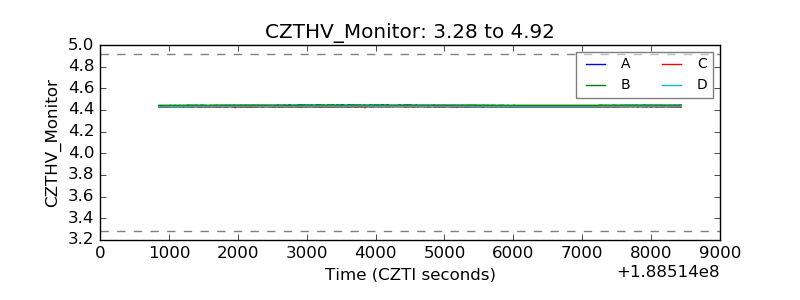 |
| D_VDD | 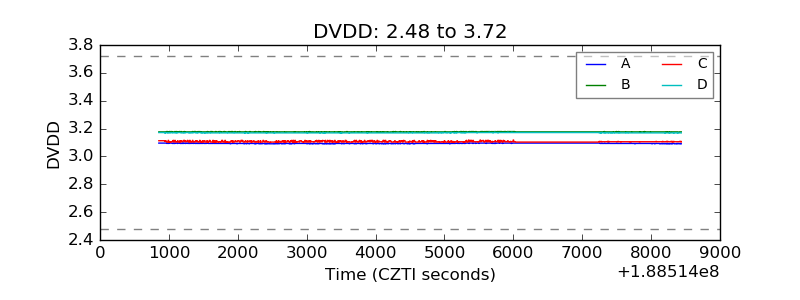 |
| Temperature 1 | 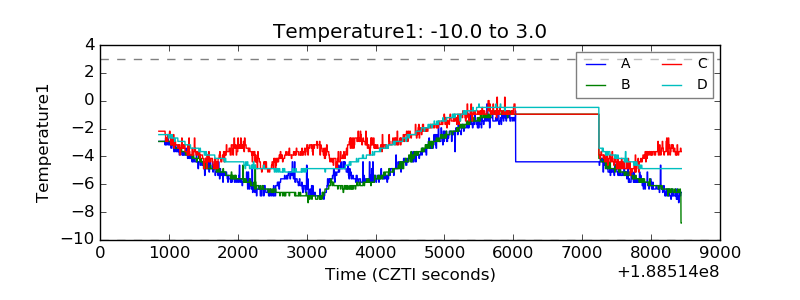 |
| Veto HV Monitor | 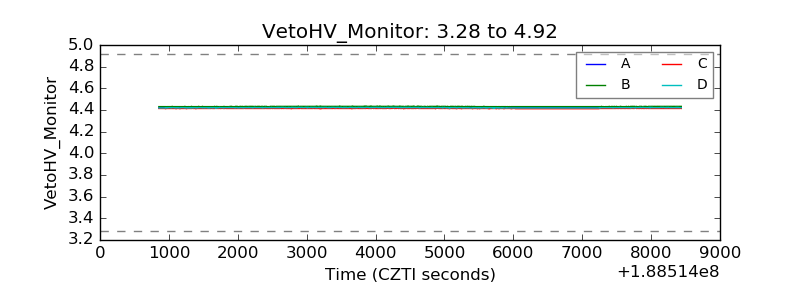 |
| Veto LLD | 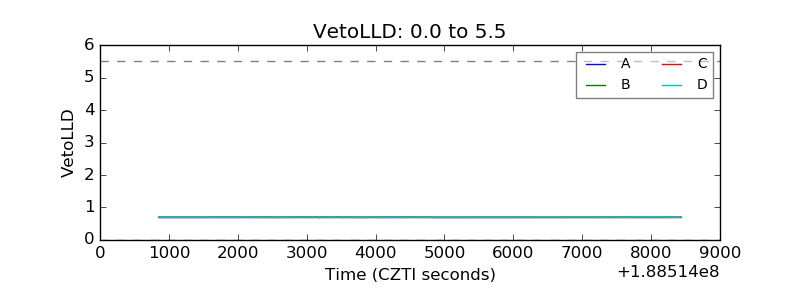 |
| Alpha Counter | 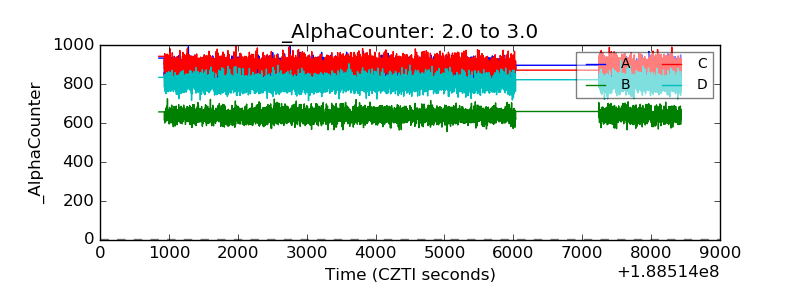 |
| _CPM_Rate | 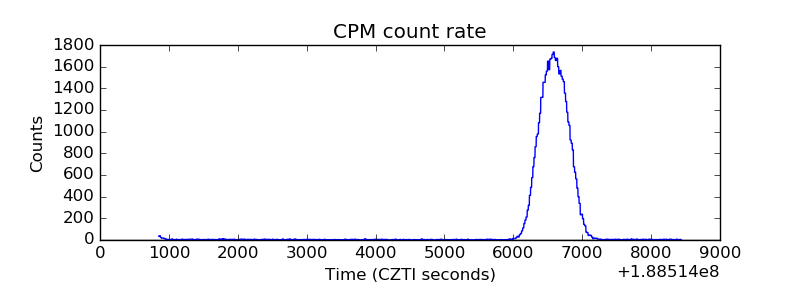 |
| CZT Counter | 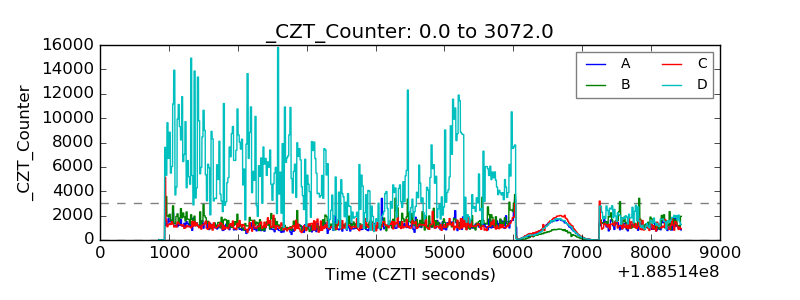 |
| +2.5 Volts monitor | 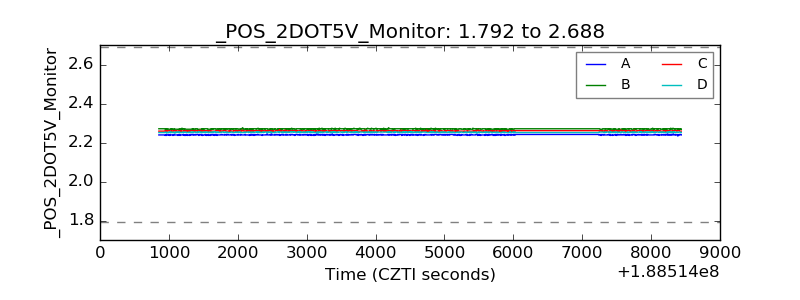 |
| +5 Volts monitor | 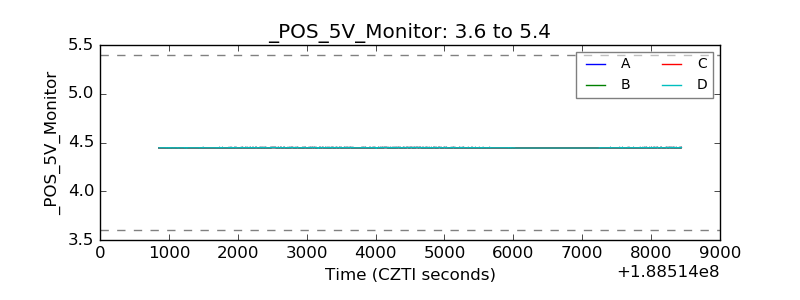 |
| _ROLL_ROT | 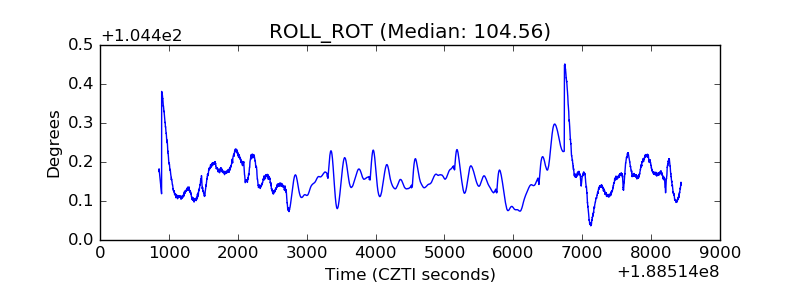 |
| _Roll_DEC | 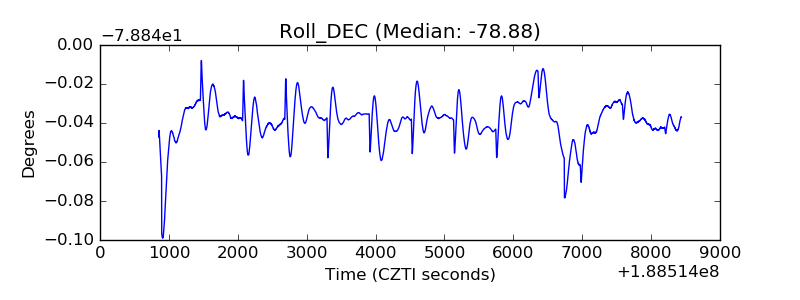 |
| _Roll_RA | 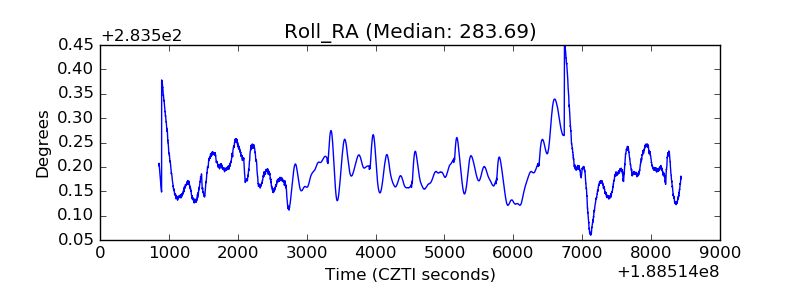 |
| Veto Counter | 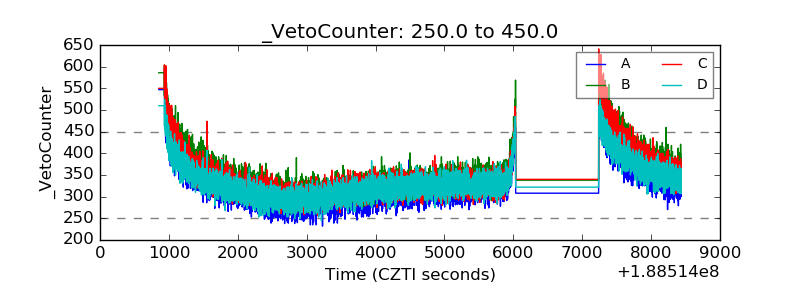 |