| Param | Original file | Final file |
|---|---|---|
| Filename | modeM0/AS1G04_011T02_9000000226_01272cztM0_level2.evt | modeM0/AS1G04_011T02_9000000226_01272cztM0_level2_quad_clean.evt |
| Size (bytes) | 1,213,704,000 | 107,239,680 |
| Size | 1.1 GB | 102.3 MB |
| Events in quadrant A | 7,683,085 | 716,523 |
| Events in quadrant B | 8,929,100 | 723,685 |
| Events in quadrant C | 7,967,153 | 695,011 |
| Events in quadrant D | 11,742,668 | 652,277 |
| Mode SS | |||
|---|---|---|---|
| Quadrant | BADHDUFLAG | Total packets | Discarded packets |
| A | 0 | 136 | 0 |
| B | 0 | 136 | 0 |
| C | 0 | 136 | 0 |
| D | 0 | 136 | 0 |
| Mode M9 | |||
|---|---|---|---|
| Quadrant | BADHDUFLAG | Total packets | Discarded packets |
| A | 0 | 18 | 0 |
| B | 0 | 18 | 0 |
| C | 0 | 18 | 0 |
| D | 0 | 19 | 0 |
| Mode M0 | |||
|---|---|---|---|
| Quadrant | BADHDUFLAG | Total packets | Discarded packets |
| A | 0 | 27459 | 3 |
| B | 0 | 31153 | 2 |
| C | 0 | 28296 | 2 |
| D | 0 | 39503 | 2 |
| Quadrant | Total seconds | Saturated seconds | Saturation percentage |
|---|---|---|---|
| A | 6593 | 3 | 0.045503% |
| B | 6593 | 29 | 0.439860% |
| C | 6593 | 21 | 0.318520% |
| D | 6593 | 294 | 4.459275% |
Noise dominated data is calculated using 1-second bins in cleaned event files. If a bin has >2000 counts, and if more than 50% of those come from <1% of pixels, then it is considered to be noise-dominated and hence unusable.
| Quadrant | # 1 sec bins | Bins with >0 counts | Bins with >2000 counts | High rate bins dominated by noise | Noise dominated (total time) | Noise dominated (detector-on time) | Marked lightcurve |
|---|---|---|---|---|---|---|---|
| A | 7858 | 6594 | 143 | 143 | 1.82% | 2.17% | 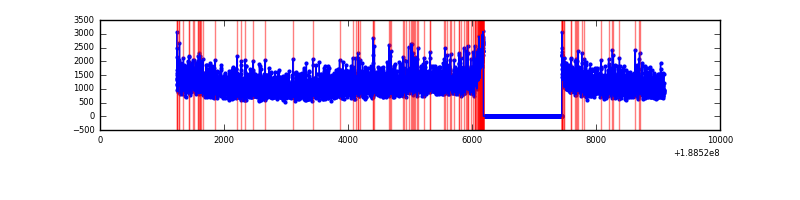 |
| B | 7858 | 6593 | 447 | 447 | 5.69% | 6.78% | 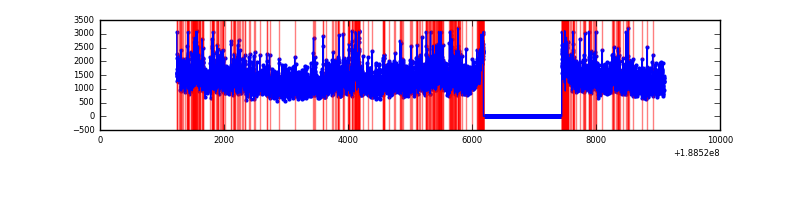 |
| C | 7858 | 6594 | 133 | 133 | 1.69% | 2.02% | 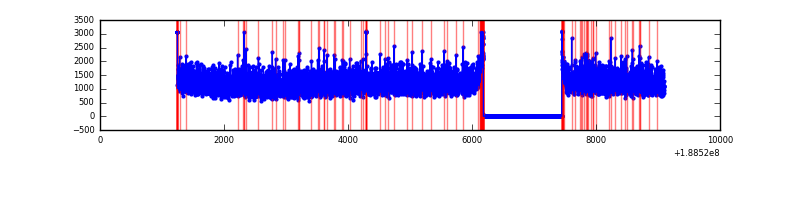 |
| D | 7858 | 6593 | 1847 | 1847 | 23.50% | 28.01% | 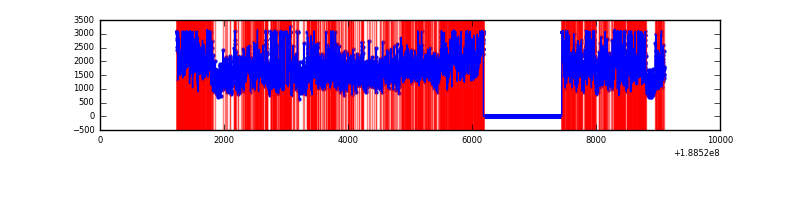 |
Top three noisy pixels from each quadrant. If the there are fewer than three noisy pixels in the level2.evt file, extra rows are filled as -1
| Pixel properties | Quadrant properties | ||||||
|---|---|---|---|---|---|---|---|
| Quadrant | DetID | PixID | Counts | Sigma | Mean | Median | Sigma |
| A | 11 | 79 | 8049 | 12.78 | 1998 | 2012 | 472.4 |
| A | 3 | 111 | 6284 | 9.04 | 1998 | 2012 | 472.4 |
| A | 13 | 235 | 5509 | 7.4 | 1998 | 2012 | 472.4 |
| B | 8 | 4 | 648026 | 1319.29 | 2102 | 2108 | 489.6 |
| B | 6 | 53 | 170387 | 343.71 | 2102 | 2108 | 489.6 |
| B | 15 | 22 | 62351 | 123.05 | 2102 | 2108 | 489.6 |
| C | 15 | 241 | 297803 | 556.16 | 1928 | 1994 | 531.9 |
| C | 8 | 208 | 54197 | 98.15 | 1928 | 1994 | 531.9 |
| C | 7 | 159 | 26969 | 46.96 | 1928 | 1994 | 531.9 |
| D | 13 | 169 | 4419297 | 7913.46 | 1829 | 1896 | 558.2 |
| D | 10 | 84 | 347401 | 618.95 | 1829 | 1896 | 558.2 |
| D | 13 | 205 | 35332 | 59.9 | 1829 | 1896 | 558.2 |
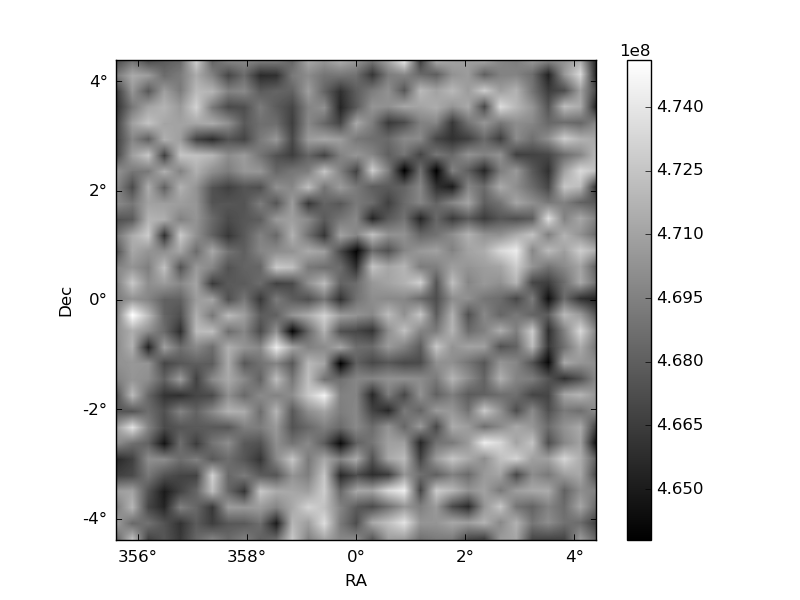
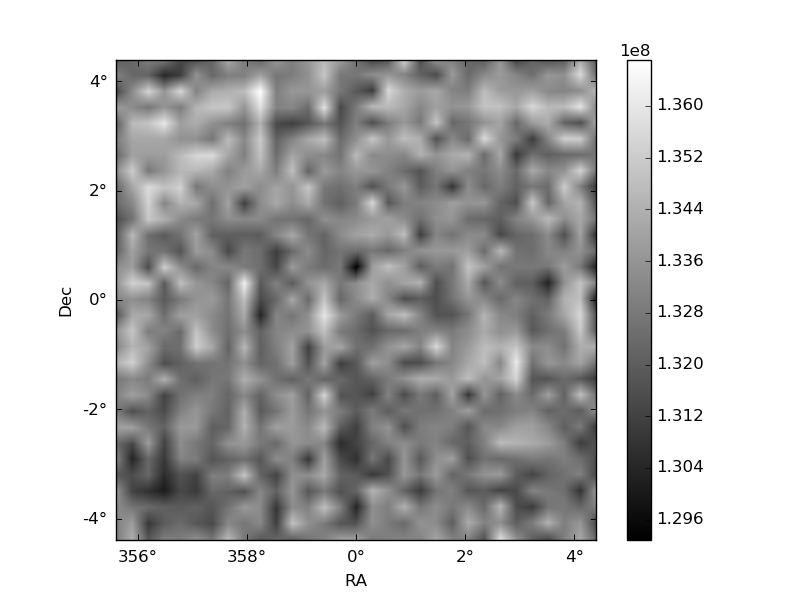
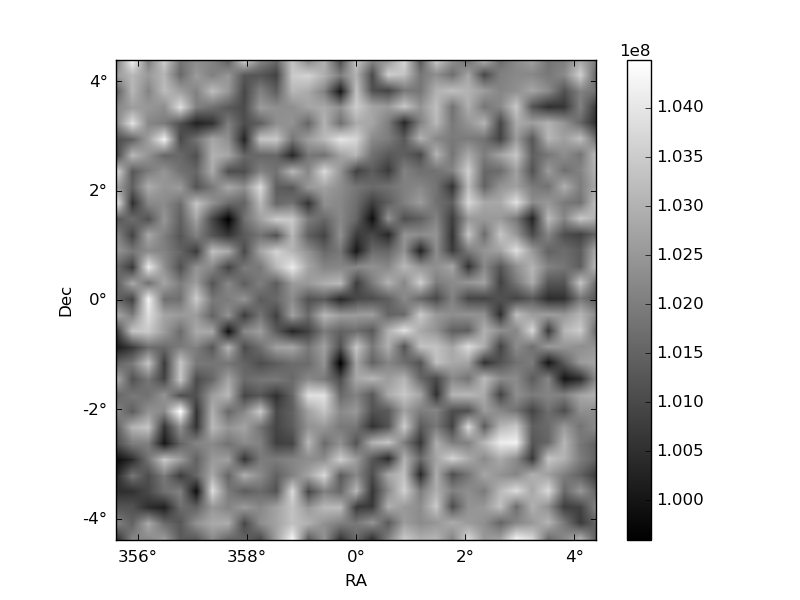
Histogram calculated using DETX and DETY for each event in the final _common_clean file
| Quadrant A |  |
 |
Quadrant B |
|---|---|---|---|
| Quadrant D |  |
 |
Quadrant C |
| Plot type | Count rate plots | Images |
|---|---|---|
| Comparison with Poisson distribution Blue bars denote a histogram of data divided into 1 sec bins. Red curve is a Poisson curve with rate = median count rate of data. |
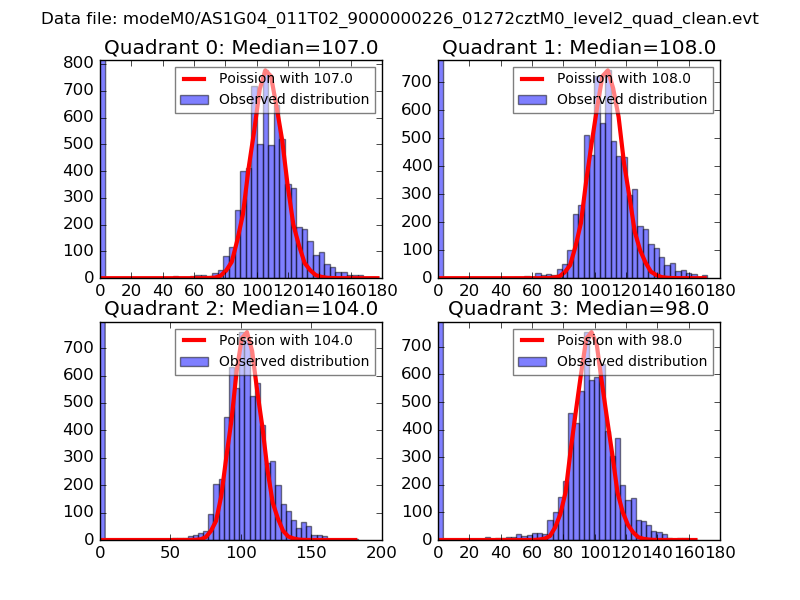 |
 |
| Quadrant-wise count rates Data is divided into 100 sec bins |
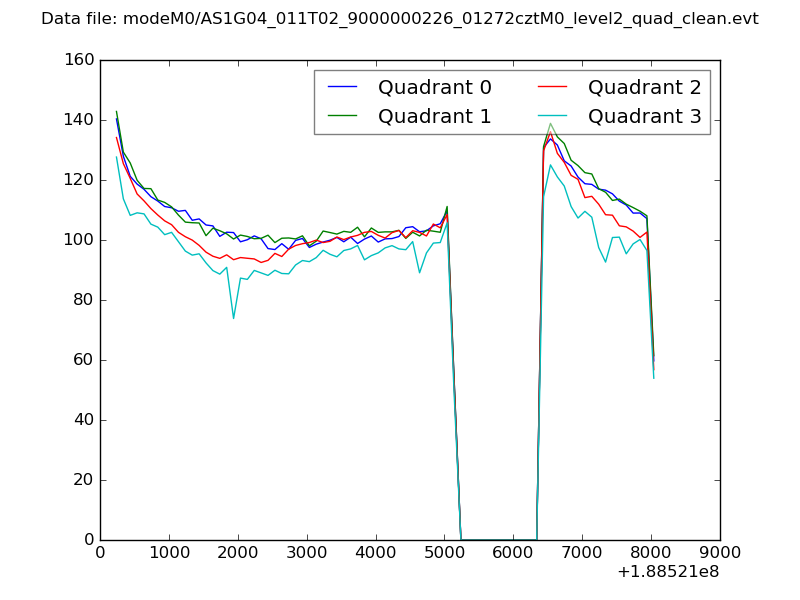 |
|
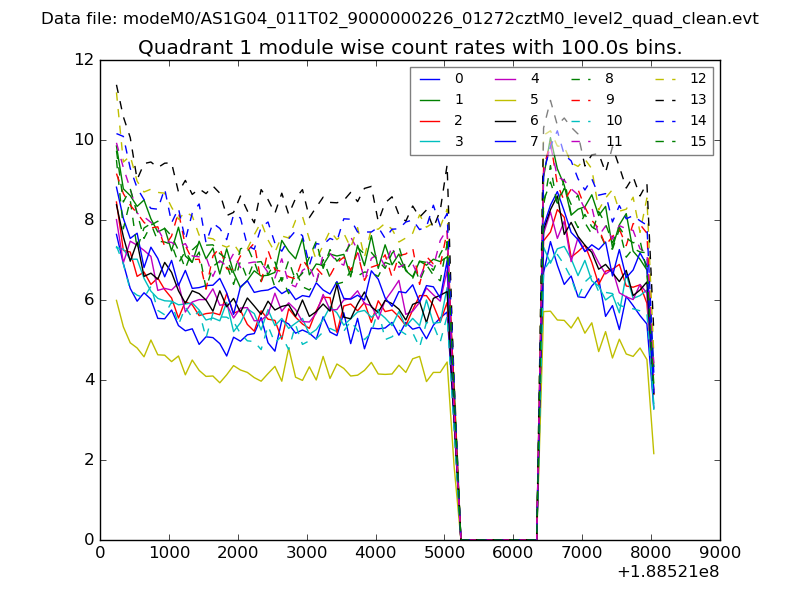
| Module-wise count rates for Quadrant A Data is divided into 100 sec bins |
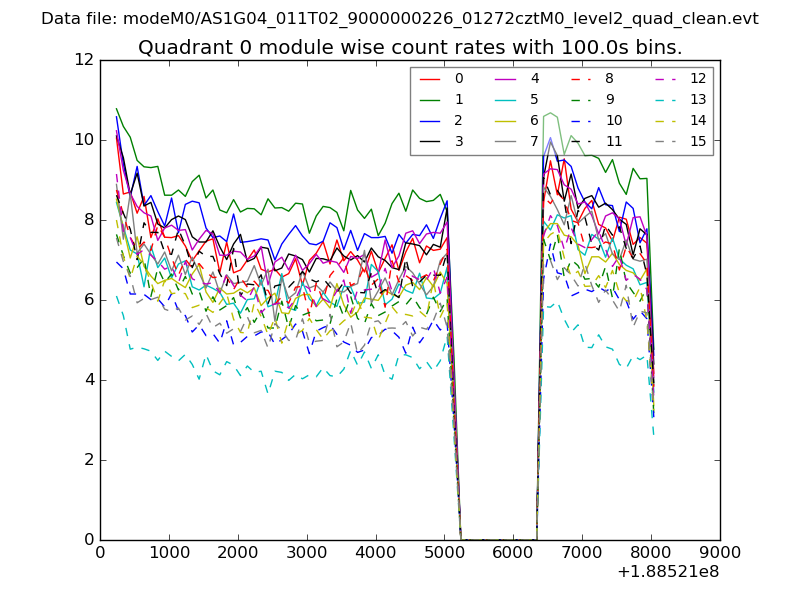 |
 |
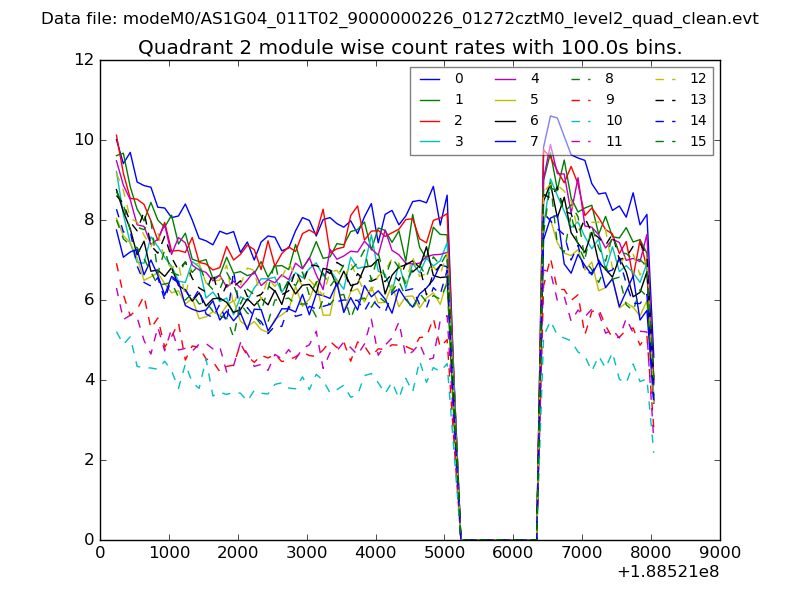
| Module-wise count rates for Quadrant B Data is divided into 100 sec bins |
 |
 |
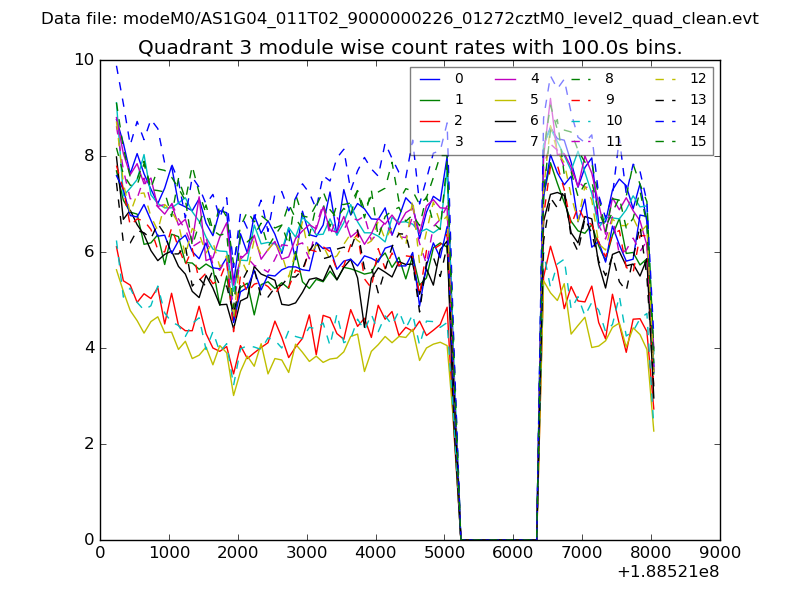
| Module-wise count rates for Quadrant C Data is divided into 100 sec bins |
 |
 |
| Module-wise count rates for Quadrant D Data is divided into 100 sec bins |
 |
 |
| Parameter | Plot |
|---|---|
| CZT HV Monitor | 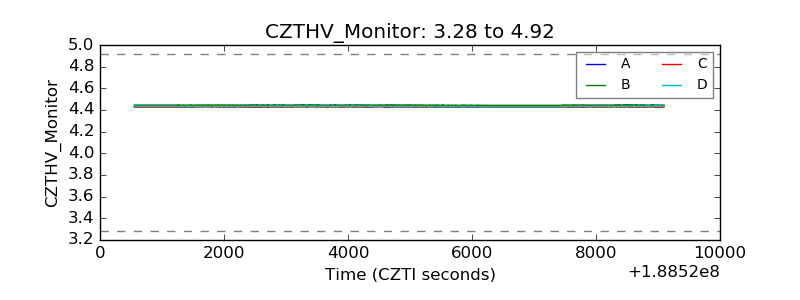 |
| D_VDD | 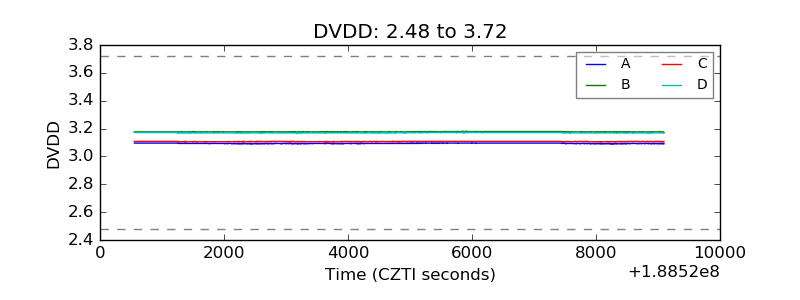 |
| Temperature 1 | 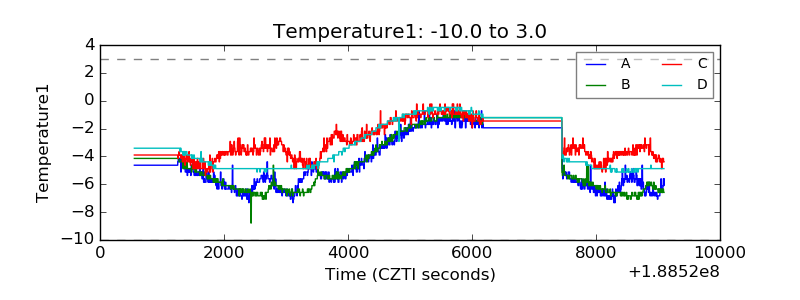 |
| Veto HV Monitor | 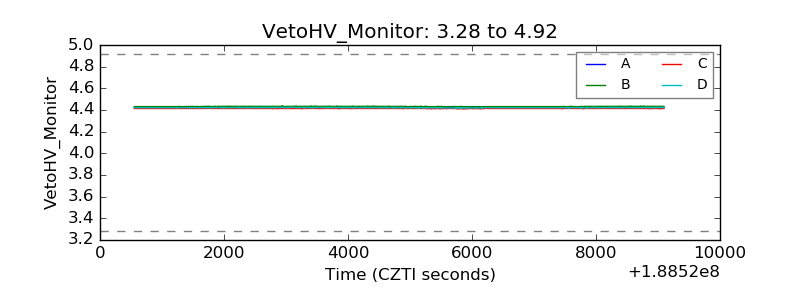 |
| Veto LLD | 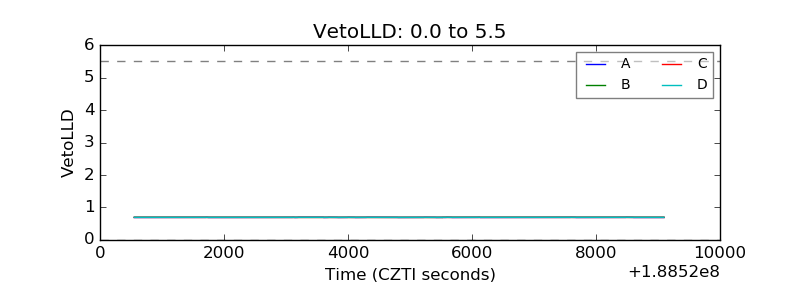 |
| Alpha Counter | 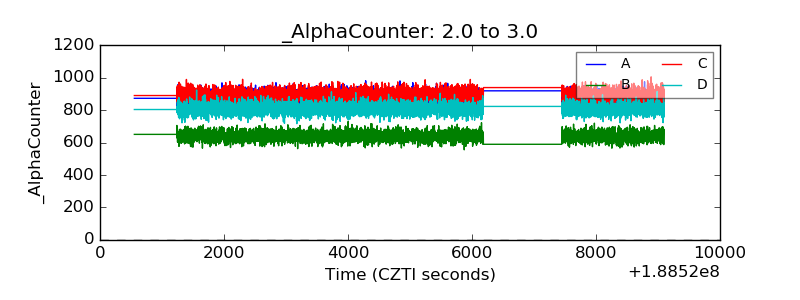 |
| _CPM_Rate | 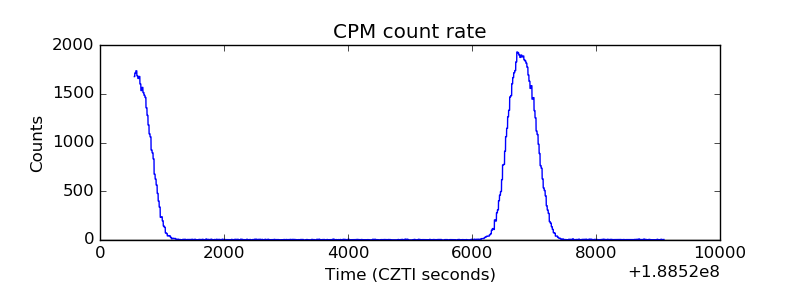 |
| CZT Counter | 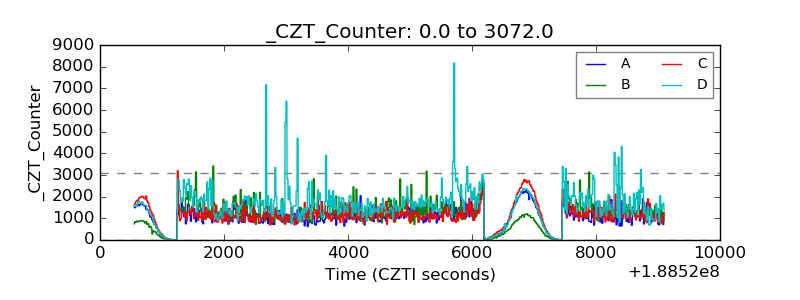 |
| +2.5 Volts monitor |  |
| +5 Volts monitor | 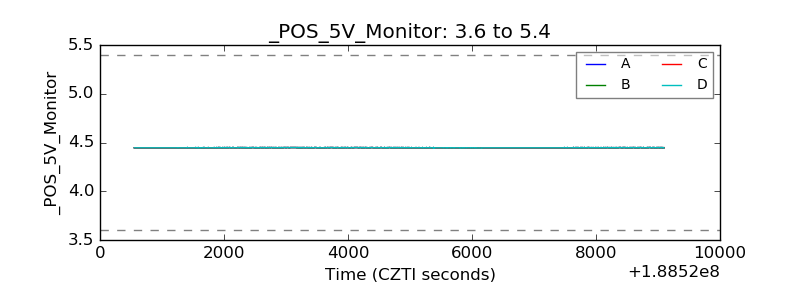 |
| _ROLL_ROT | 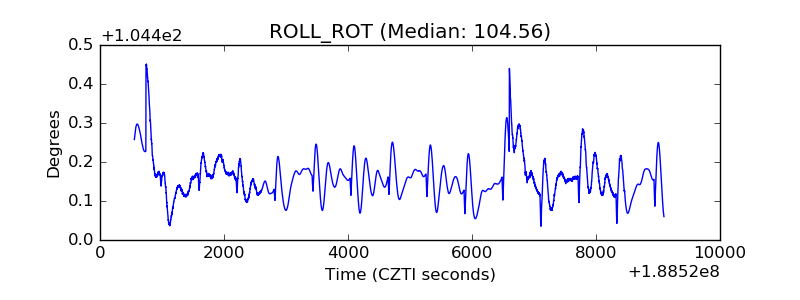 |
| _Roll_DEC | 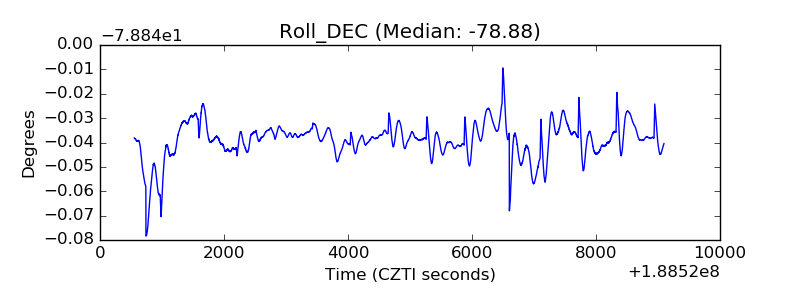 |
| _Roll_RA | 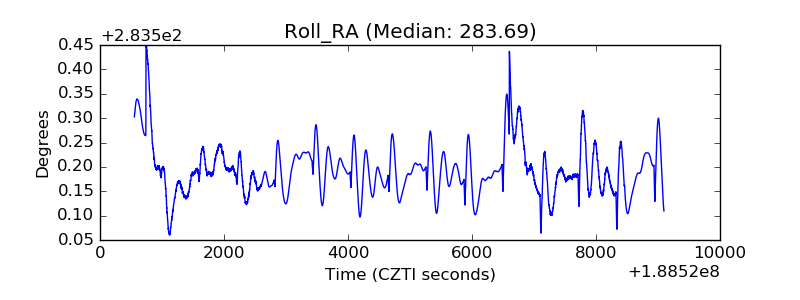 |
| Veto Counter | 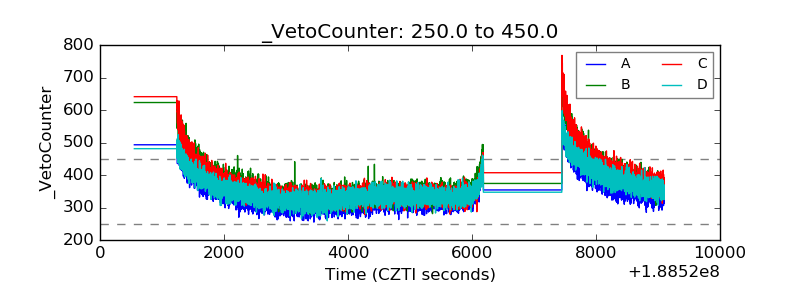 |