| Param | Original file | Final file |
|---|---|---|
| Filename | modeM0/AS1G04_011T02_9000000226_01274cztM0_level2.evt | modeM0/AS1G04_011T02_9000000226_01274cztM0_level2_quad_clean.evt |
| Size (bytes) | 1,178,409,600 | 90,060,480 |
| Size | 1.1 GB | 85.9 MB |
| Events in quadrant A | 6,670,382 | 611,807 |
| Events in quadrant B | 7,909,778 | 614,145 |
| Events in quadrant C | 7,117,418 | 602,746 |
| Events in quadrant D | 13,618,964 | 502,908 |
| Mode SS | |||
|---|---|---|---|
| Quadrant | BADHDUFLAG | Total packets | Discarded packets |
| A | 0 | 114 | 0 |
| B | 0 | 114 | 0 |
| C | 0 | 114 | 0 |
| D | 0 | 114 | 0 |
| Mode M9 | |||
|---|---|---|---|
| Quadrant | BADHDUFLAG | Total packets | Discarded packets |
| A | 0 | 13 | 0 |
| B | 0 | 13 | 0 |
| C | 0 | 13 | 0 |
| D | 0 | 13 | 0 |
| Mode M0 | |||
|---|---|---|---|
| Quadrant | BADHDUFLAG | Total packets | Discarded packets |
| A | 0 | 23853 | 2 |
| B | 0 | 27509 | 1 |
| C | 0 | 25139 | 1 |
| D | 0 | 44651 | 1 |
| Quadrant | Total seconds | Saturated seconds | Saturation percentage |
|---|---|---|---|
| A | 5651 | 6 | 0.106176% |
| B | 5651 | 108 | 1.911166% |
| C | 5651 | 7 | 0.123872% |
| D | 5651 | 1698 | 30.047779% |
Noise dominated data is calculated using 1-second bins in cleaned event files. If a bin has >2000 counts, and if more than 50% of those come from <1% of pixels, then it is considered to be noise-dominated and hence unusable.
| Quadrant | # 1 sec bins | Bins with >0 counts | Bins with >2000 counts | High rate bins dominated by noise | Noise dominated (total time) | Noise dominated (detector-on time) | Marked lightcurve |
|---|---|---|---|---|---|---|---|
| A | 6941 | 5651 | 139 | 139 | 2.00% | 2.46% | 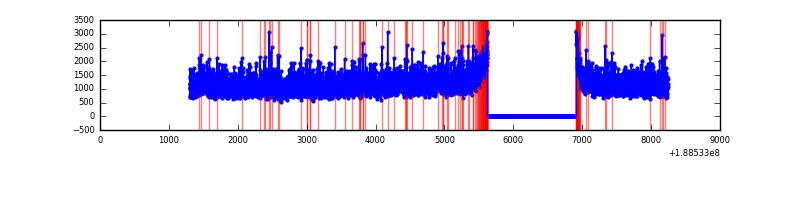 |
| B | 6941 | 5652 | 527 | 527 | 7.59% | 9.32% | 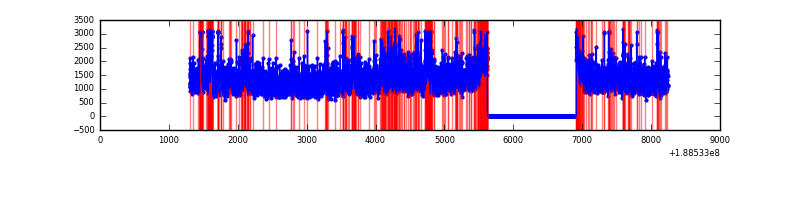 |
| C | 6941 | 5652 | 235 | 235 | 3.39% | 4.16% | 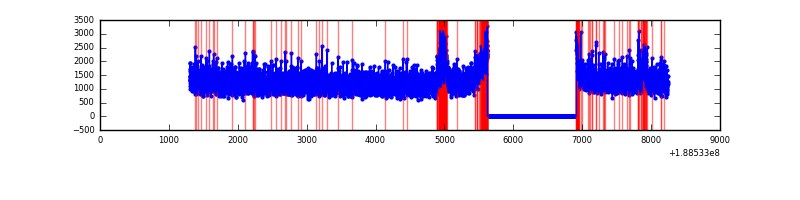 |
| D | 6940 | 5650 | 4067 | 4067 | 58.60% | 71.98% | 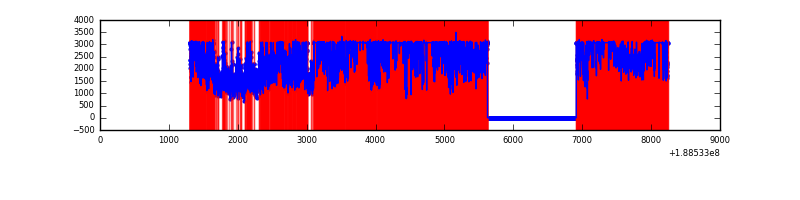 |
Top three noisy pixels from each quadrant. If the there are fewer than three noisy pixels in the level2.evt file, extra rows are filled as -1
| Pixel properties | Quadrant properties | ||||||
|---|---|---|---|---|---|---|---|
| Quadrant | DetID | PixID | Counts | Sigma | Mean | Median | Sigma |
| A | 12 | 243 | 14781 | 31.78 | 1731 | 1739 | 410.3 |
| A | 15 | 127 | 9854 | 19.78 | 1731 | 1739 | 410.3 |
| A | 11 | 79 | 8084 | 15.46 | 1731 | 1739 | 410.3 |
| B | 8 | 4 | 569411 | 1343.0 | 1805 | 1811 | 422.6 |
| B | 6 | 53 | 238850 | 560.86 | 1805 | 1811 | 422.6 |
| B | 12 | 52 | 163986 | 383.72 | 1805 | 1811 | 422.6 |
| C | 15 | 241 | 266916 | 576.67 | 1673 | 1732 | 459.9 |
| C | 8 | 208 | 234975 | 507.21 | 1673 | 1732 | 459.9 |
| C | 3 | 79 | 32580 | 67.08 | 1673 | 1732 | 459.9 |
| D | 13 | 169 | 5958809 | 13056.0 | 1494 | 1546 | 456.3 |
| D | 12 | 22 | 1253919 | 2744.71 | 1494 | 1546 | 456.3 |
| D | 10 | 84 | 571432 | 1248.97 | 1494 | 1546 | 456.3 |
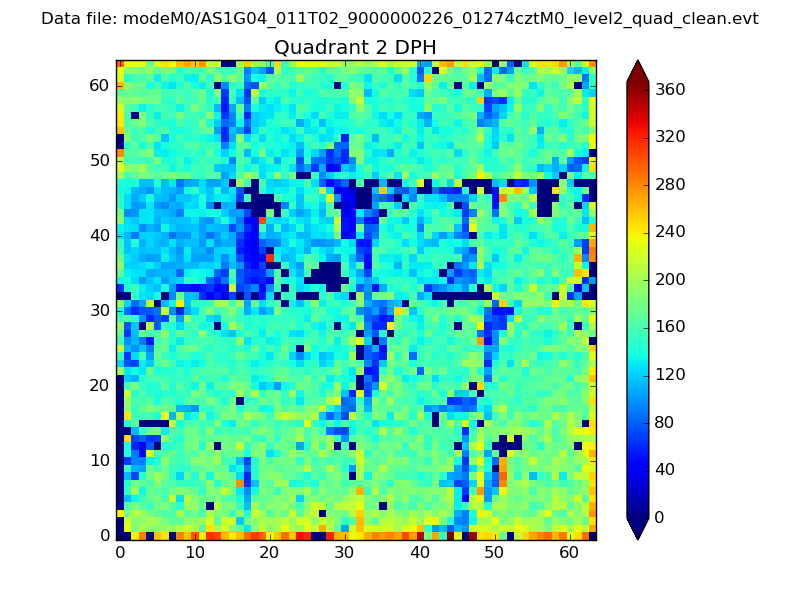
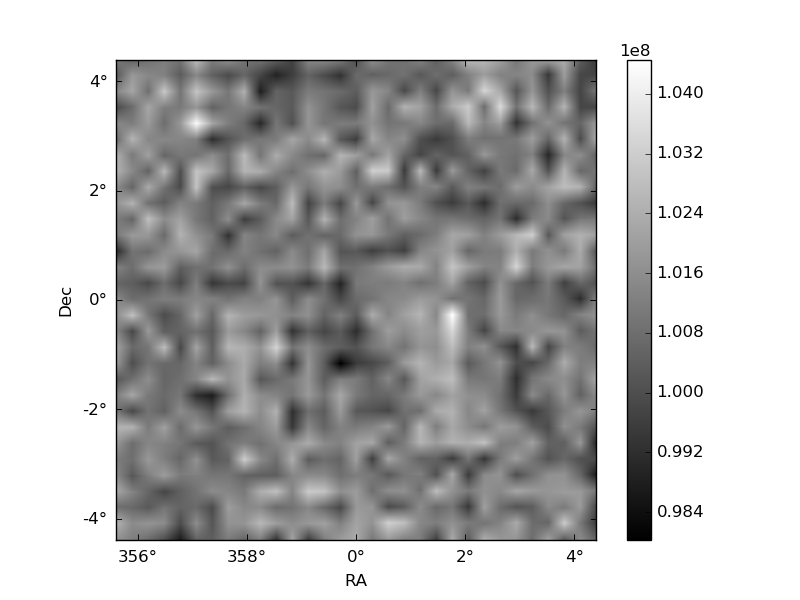
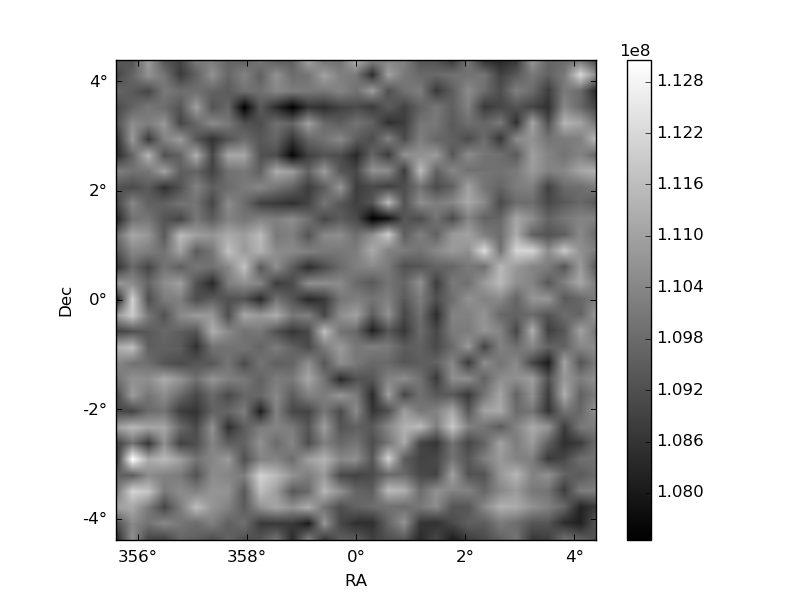
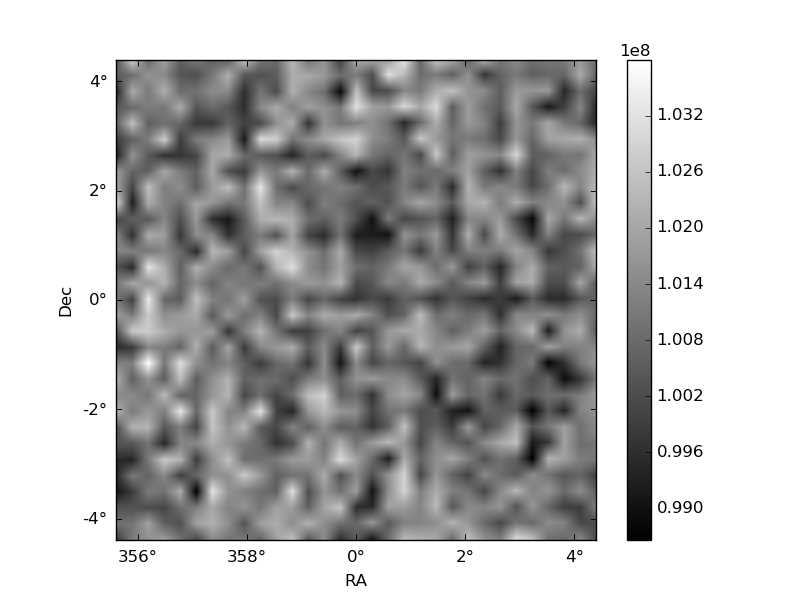
Histogram calculated using DETX and DETY for each event in the final _common_clean file
| Quadrant A | 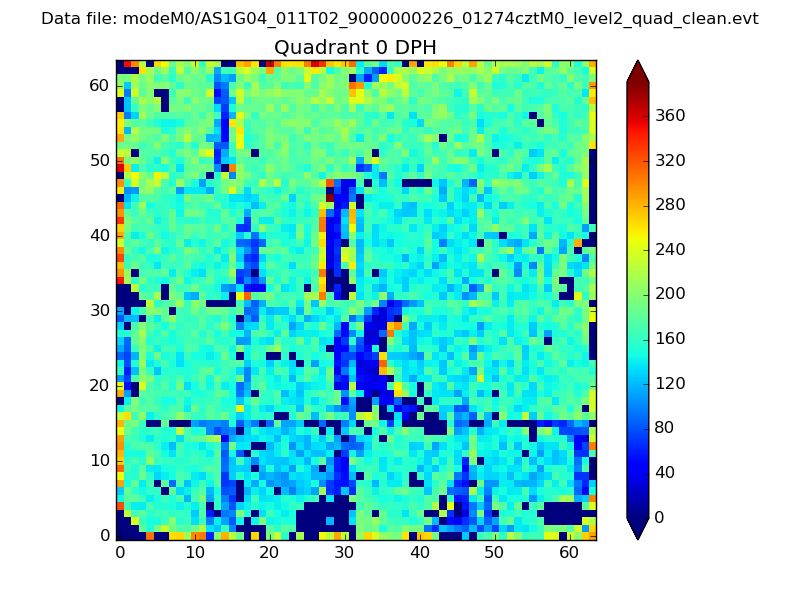 |
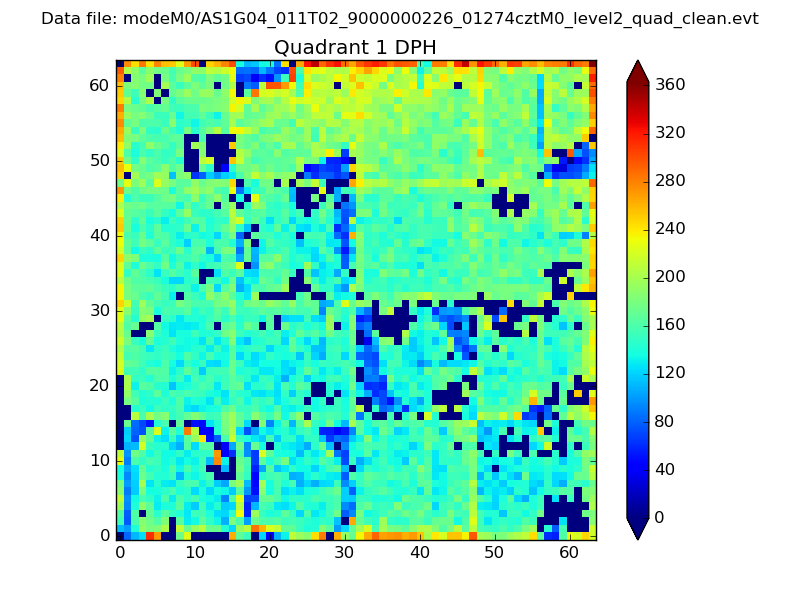 |
Quadrant B |
|---|---|---|---|
| Quadrant D | 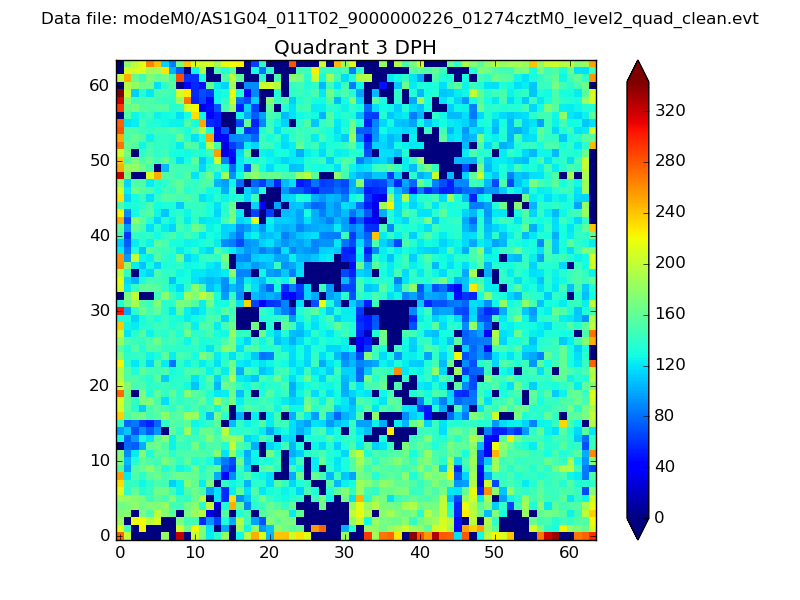 |
 |
Quadrant C |
| Plot type | Count rate plots | Images |
|---|---|---|
| Comparison with Poisson distribution Blue bars denote a histogram of data divided into 1 sec bins. Red curve is a Poisson curve with rate = median count rate of data. |
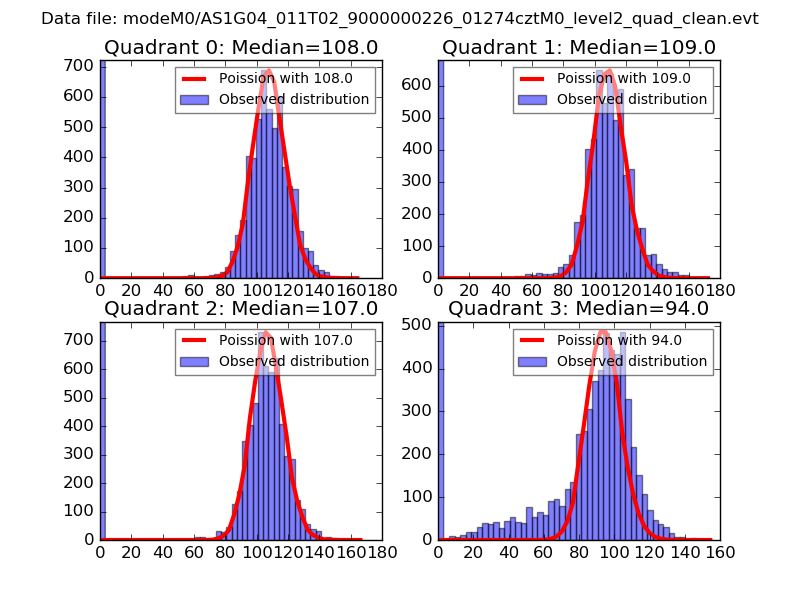 |
 |
| Quadrant-wise count rates Data is divided into 100 sec bins |
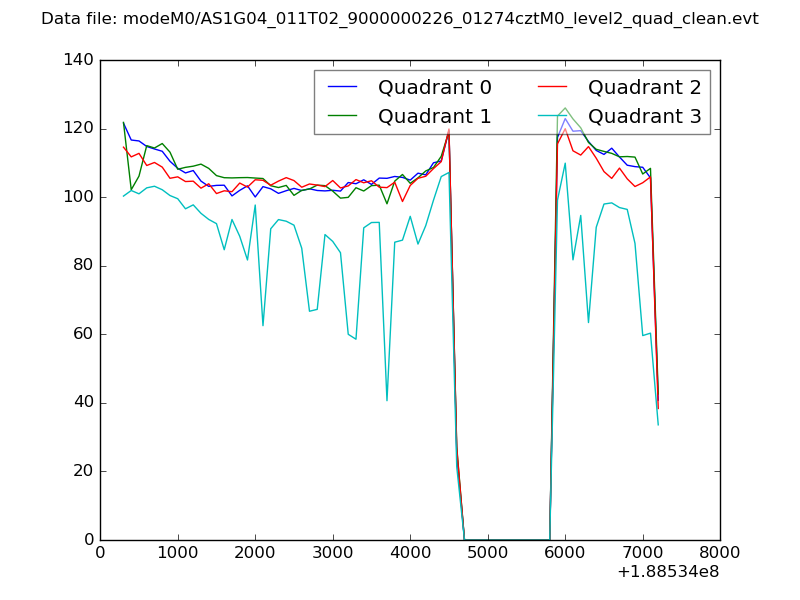 |
|
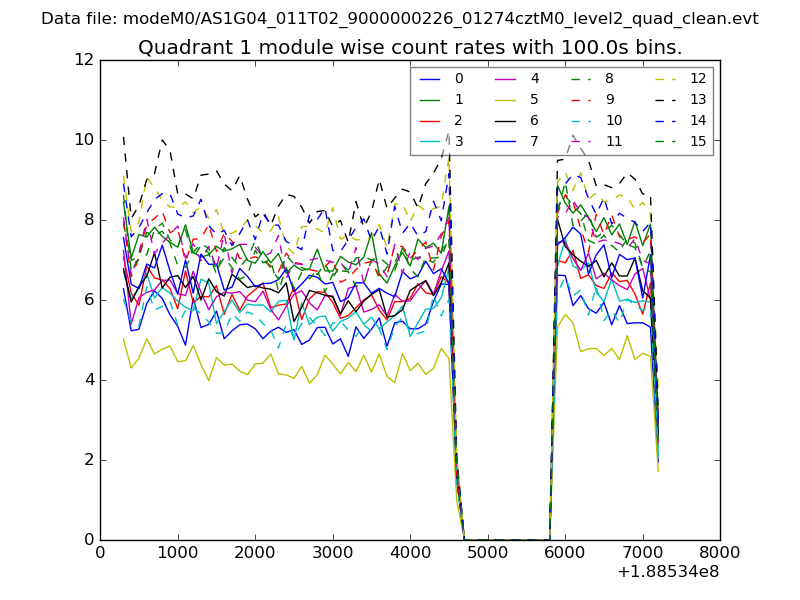
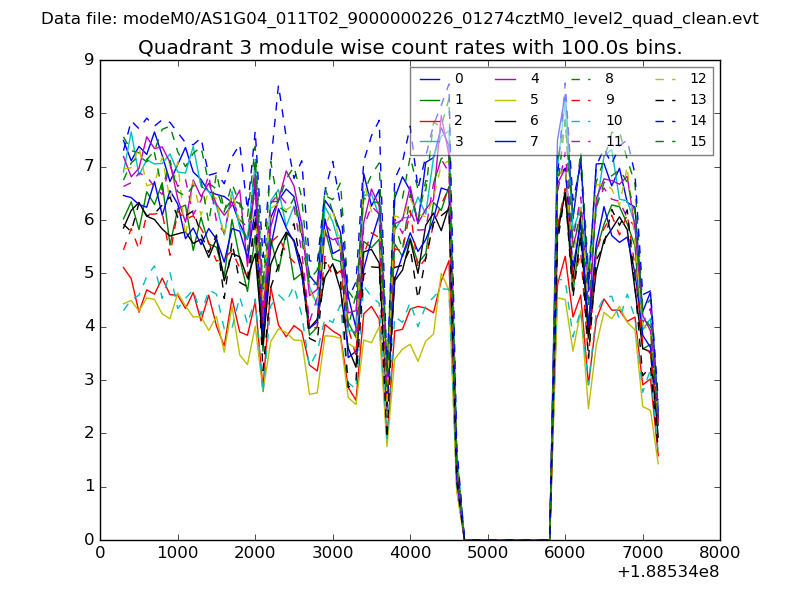
| Module-wise count rates for Quadrant A Data is divided into 100 sec bins |
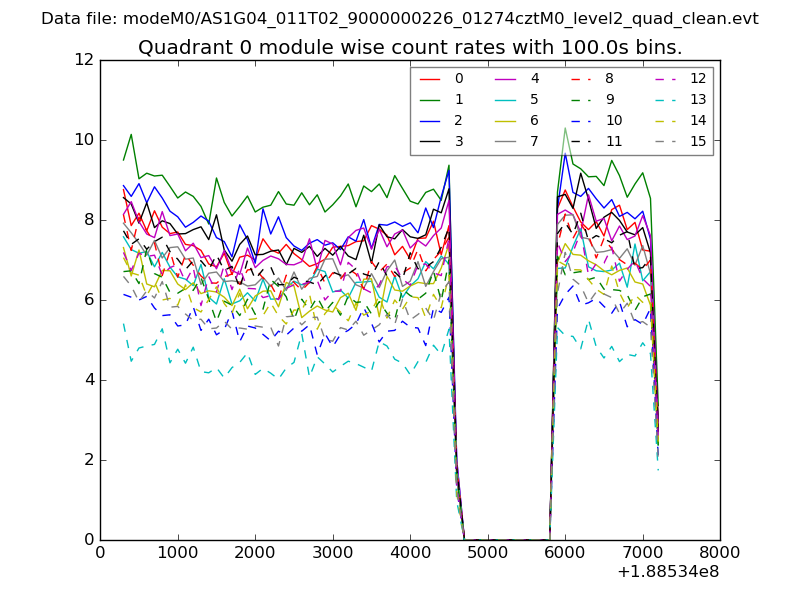 |
 |
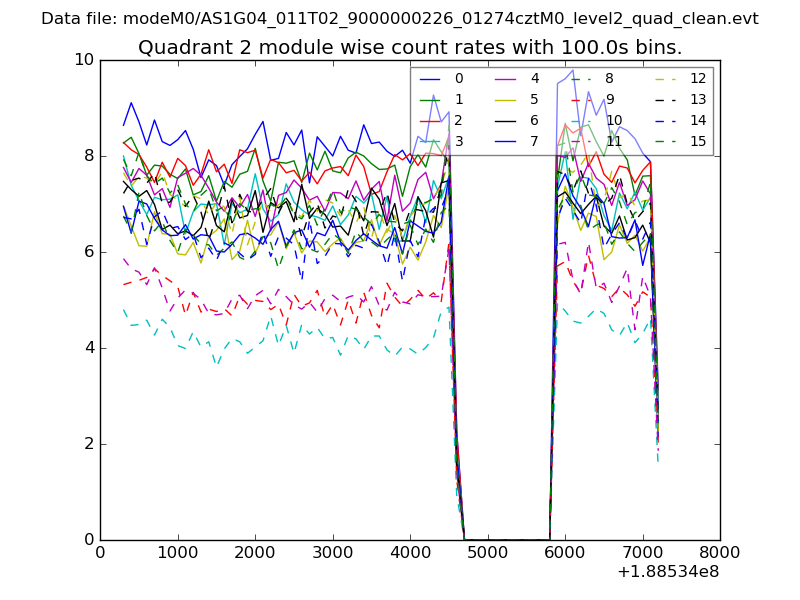
| Module-wise count rates for Quadrant B Data is divided into 100 sec bins |
 |
 |
| Module-wise count rates for Quadrant C Data is divided into 100 sec bins |
 |
 |
| Module-wise count rates for Quadrant D Data is divided into 100 sec bins |
 |
 |
| Parameter | Plot |
|---|---|
| CZT HV Monitor | 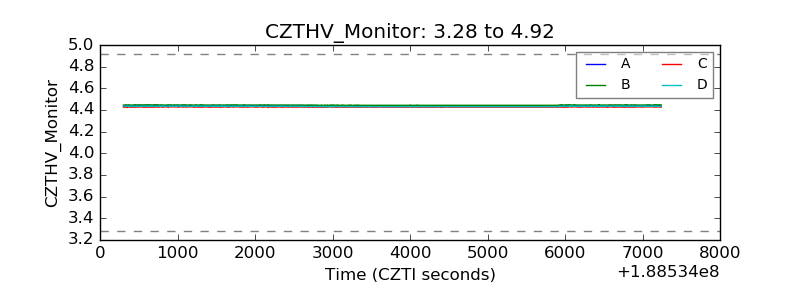 |
| D_VDD | 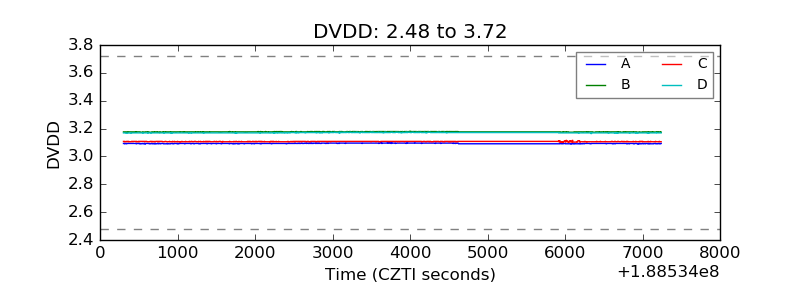 |
| Temperature 1 | 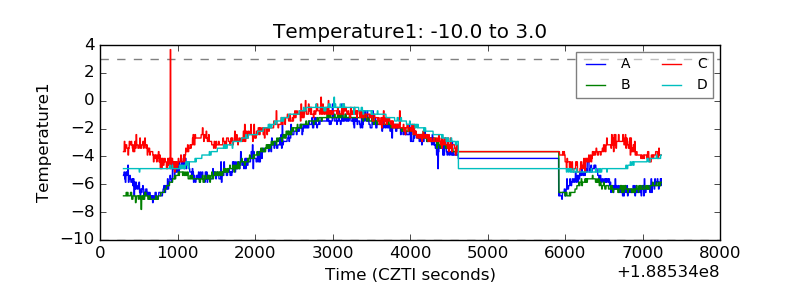 |
| Veto HV Monitor | 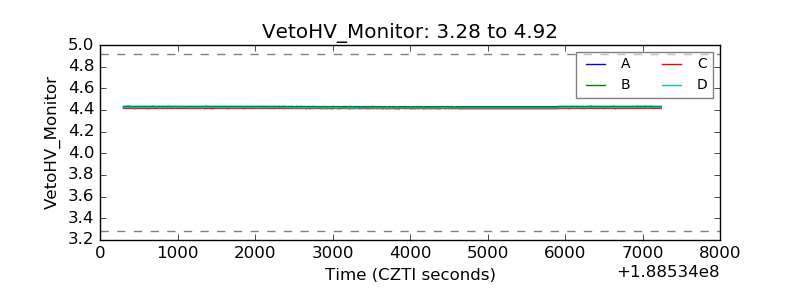 |
| Veto LLD | 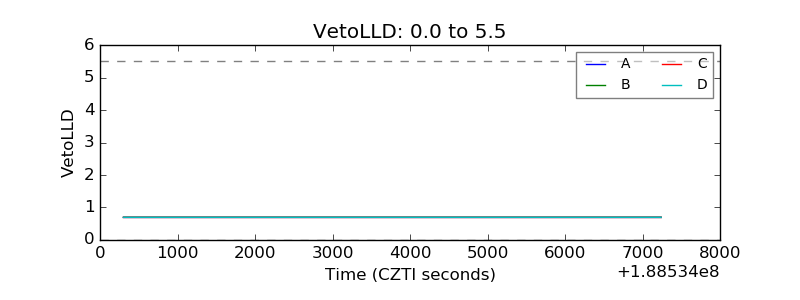 |
| Alpha Counter | 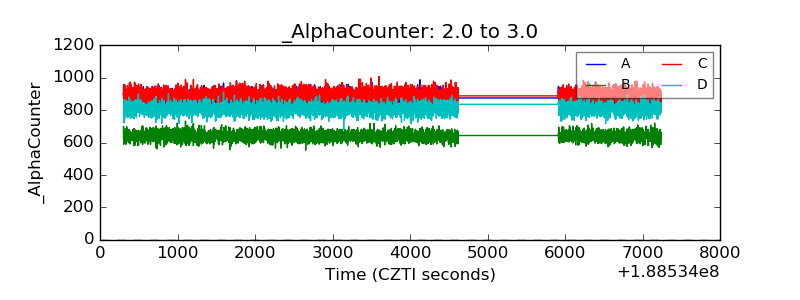 |
| _CPM_Rate | 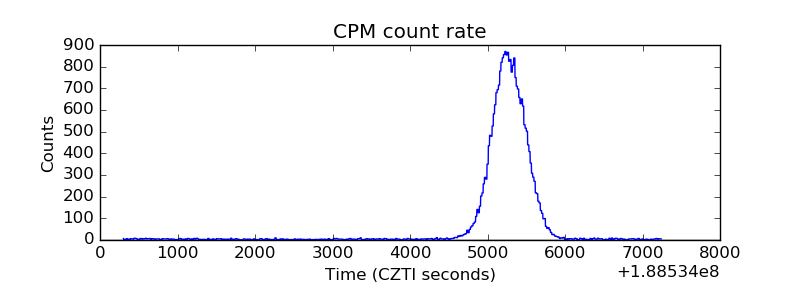 |
| CZT Counter | 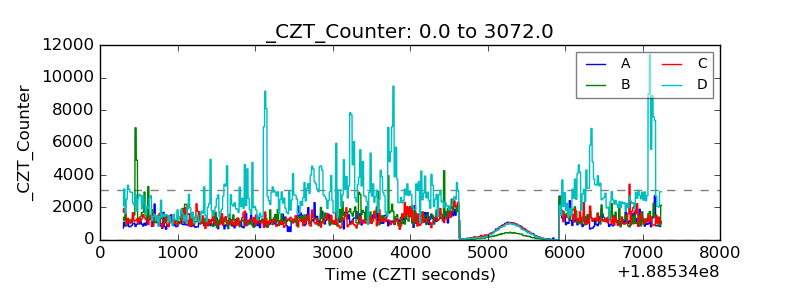 |
| +2.5 Volts monitor | 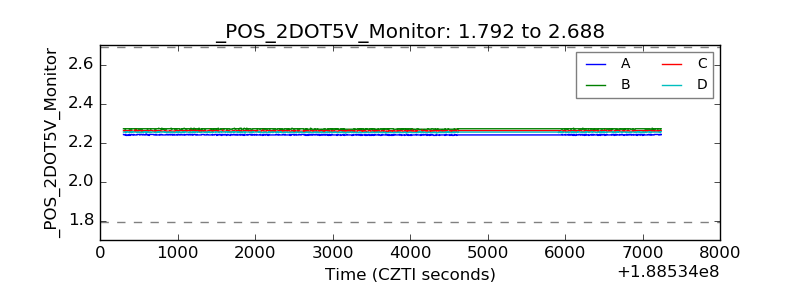 |
| +5 Volts monitor | 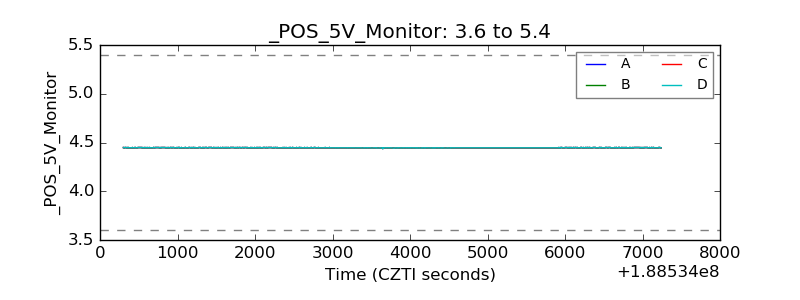 |
| _ROLL_ROT | 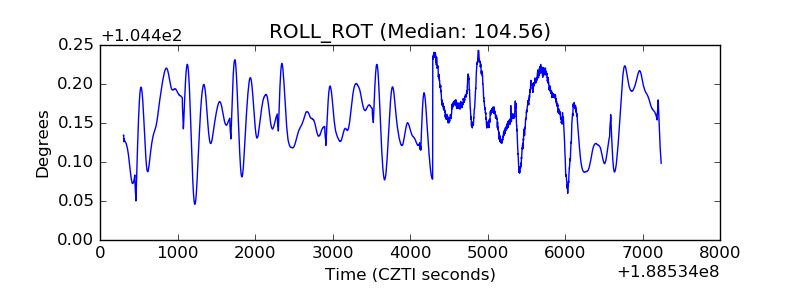 |
| _Roll_DEC | 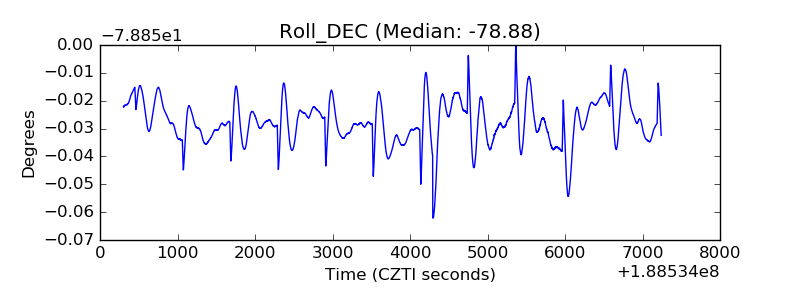 |
| _Roll_RA | 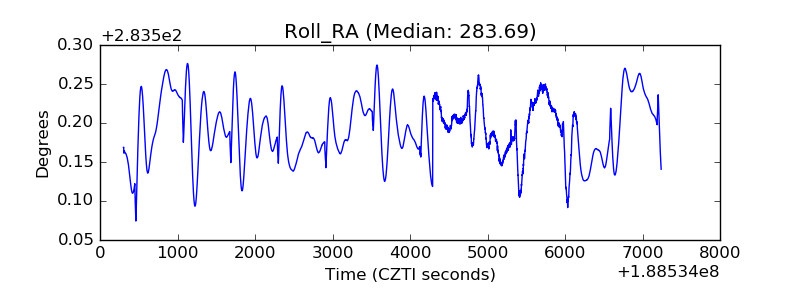 |
| Veto Counter | 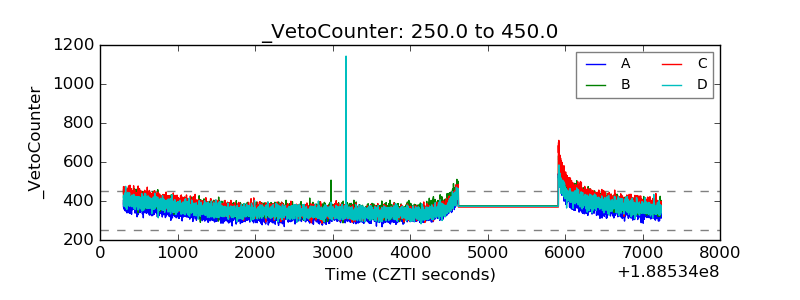 |