| Param | Original file | Final file |
|---|---|---|
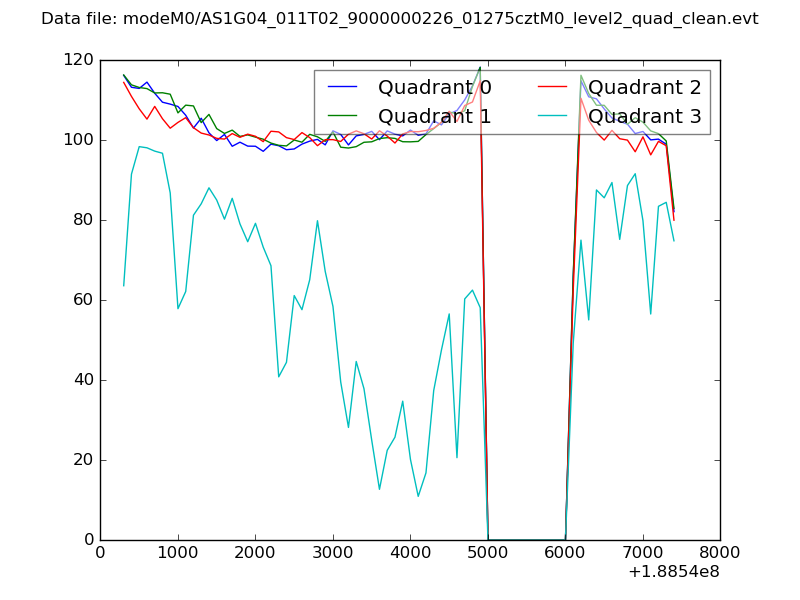
| Filename | modeM0/AS1G04_011T02_9000000226_01275cztM0_level2.evt | modeM0/AS1G04_011T02_9000000226_01275cztM0_level2_quad_clean.evt |
| Size (bytes) | 1,321,470,720 | 88,755,840 |
| Size | 1.2 GB | 84.6 MB |
| Events in quadrant A | 7,142,337 | 628,519 |
| Events in quadrant B | 8,207,913 | 631,505 |
| Events in quadrant C | 7,431,889 | 620,457 |
| Events in quadrant D | 16,840,938 | 384,200 |
| Mode SS | |||
|---|---|---|---|
| Quadrant | BADHDUFLAG | Total packets | Discarded packets |
| A | 0 | 122 | 0 |
| B | 0 | 122 | 0 |
| C | 0 | 122 | 0 |
| D | 0 | 122 | 0 |
| Mode M9 | |||
|---|---|---|---|
| Quadrant | BADHDUFLAG | Total packets | Discarded packets |
| A | 0 | 12 | 0 |
| B | 0 | 12 | 0 |
| C | 0 | 12 | 0 |
| D | 0 | 12 | 0 |
| Mode M0 | |||
|---|---|---|---|
| Quadrant | BADHDUFLAG | Total packets | Discarded packets |
| A | 0 | 25488 | 2 |
| B | 0 | 28683 | 1 |
| C | 0 | 26383 | 1 |
| D | 0 | 54890 | 1 |
| Quadrant | Total seconds | Saturated seconds | Saturation percentage |
|---|---|---|---|
| A | 6035 | 5 | 0.082850% |
| B | 6035 | 53 | 0.878210% |
| C | 6035 | 11 | 0.182270% |
| D | 6035 | 3830 | 63.463132% |
Noise dominated data is calculated using 1-second bins in cleaned event files. If a bin has >2000 counts, and if more than 50% of those come from <1% of pixels, then it is considered to be noise-dominated and hence unusable.
| Quadrant | # 1 sec bins | Bins with >0 counts | Bins with >2000 counts | High rate bins dominated by noise | Noise dominated (total time) | Noise dominated (detector-on time) | Marked lightcurve |
|---|---|---|---|---|---|---|---|
| A | 7185 | 6036 | 146 | 146 | 2.03% | 2.42% | 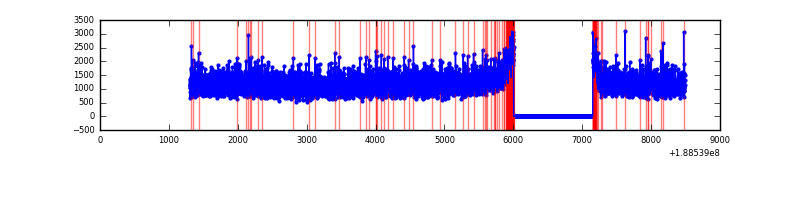 |
| B | 7185 | 6036 | 484 | 484 | 6.74% | 8.02% | 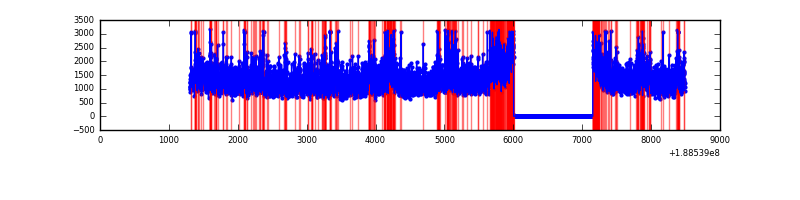 |
| C | 7185 | 6036 | 204 | 204 | 2.84% | 3.38% | 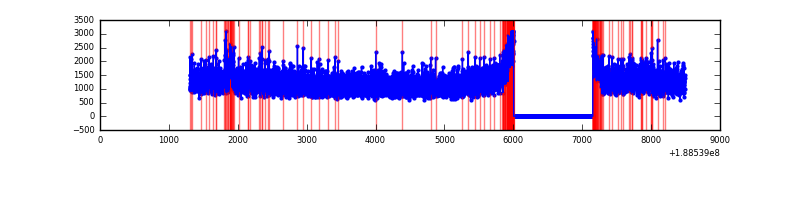 |
| D | 7185 | 6035 | 5511 | 5511 | 76.70% | 91.32% | 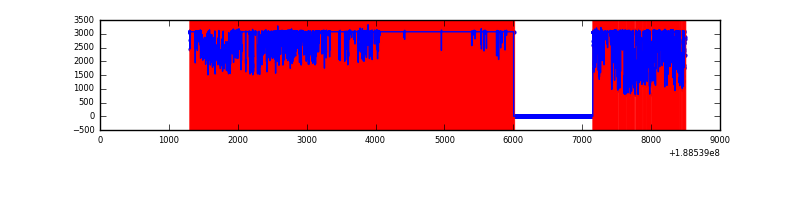 |
Top three noisy pixels from each quadrant. If the there are fewer than three noisy pixels in the level2.evt file, extra rows are filled as -1
| Pixel properties | Quadrant properties | ||||||
|---|---|---|---|---|---|---|---|
| Quadrant | DetID | PixID | Counts | Sigma | Mean | Median | Sigma |
| A | 12 | 243 | 12368 | 23.88 | 1852 | 1860 | 440.0 |
| A | 13 | 9 | 10026 | 18.56 | 1852 | 1860 | 440.0 |
| A | 14 | 236 | 9286 | 16.88 | 1852 | 1860 | 440.0 |
| B | 8 | 4 | 596040 | 1319.23 | 1928 | 1931 | 450.3 |
| B | 6 | 53 | 134436 | 294.23 | 1928 | 1931 | 450.3 |
| B | 15 | 22 | 54430 | 116.58 | 1928 | 1931 | 450.3 |
| C | 15 | 241 | 285231 | 572.61 | 1795 | 1859 | 494.9 |
| C | 8 | 208 | 70861 | 139.43 | 1795 | 1859 | 494.9 |
| C | 3 | 79 | 29962 | 56.79 | 1795 | 1859 | 494.9 |
| D | 13 | 169 | 6119658 | 15990.29 | 1255 | 1300 | 382.6 |
| D | 10 | 84 | 3297241 | 8613.92 | 1255 | 1300 | 382.6 |
| D | 12 | 22 | 2665595 | 6963.12 | 1255 | 1300 | 382.6 |
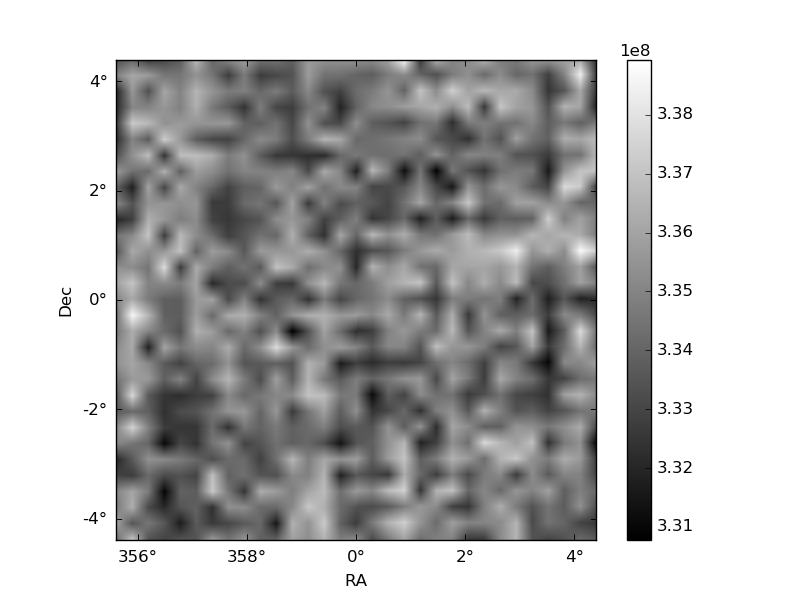
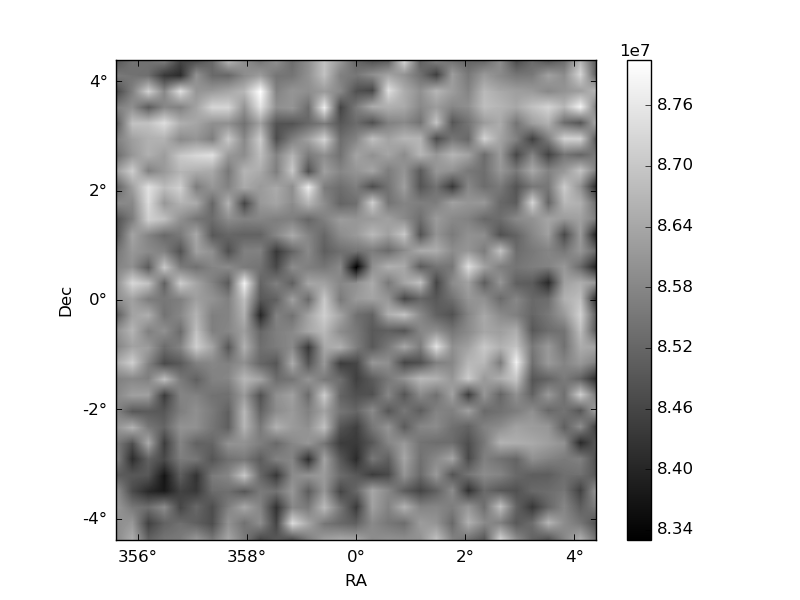
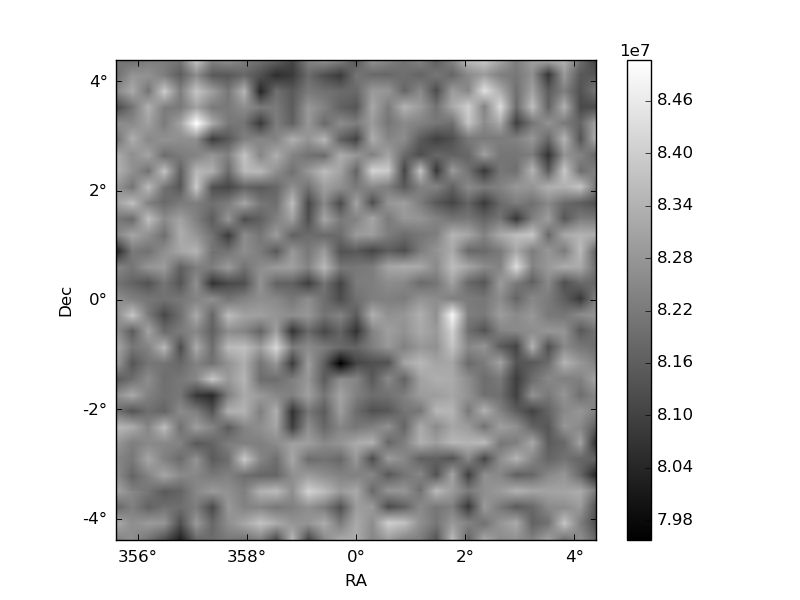
Histogram calculated using DETX and DETY for each event in the final _common_clean file
| Quadrant A | 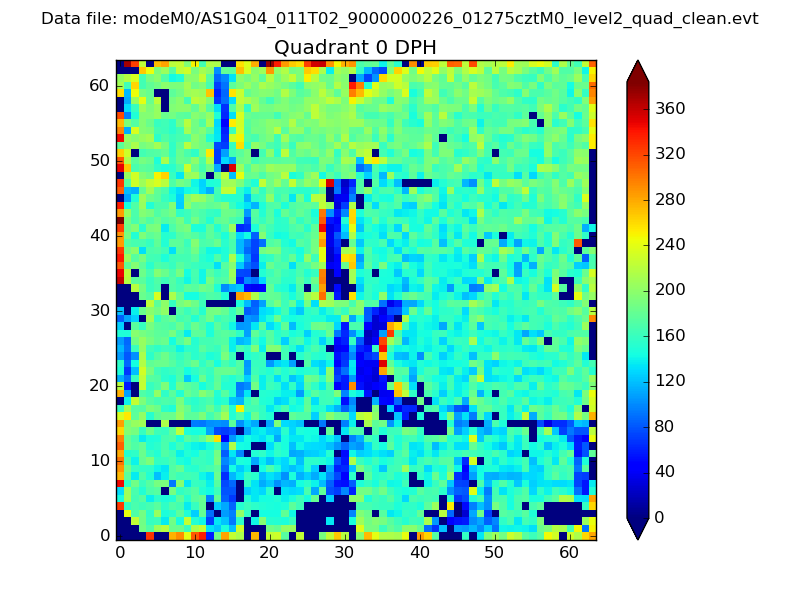 |
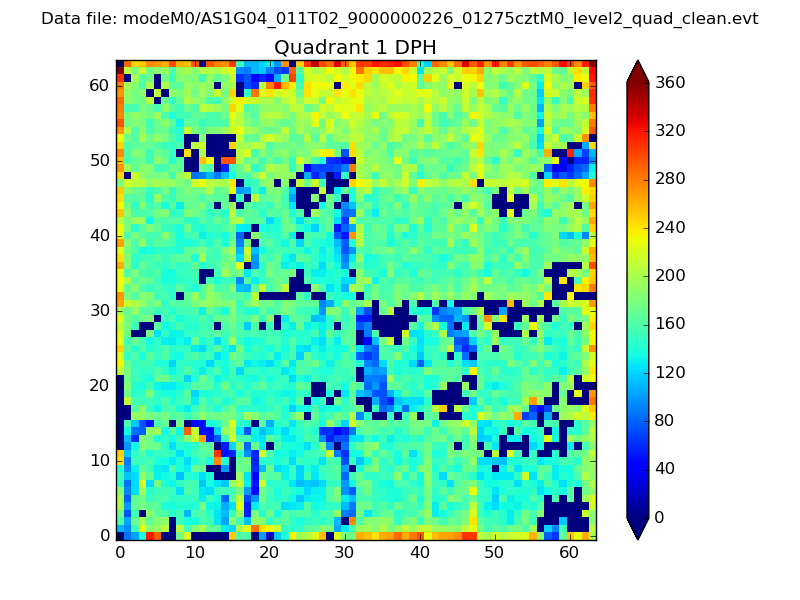 |
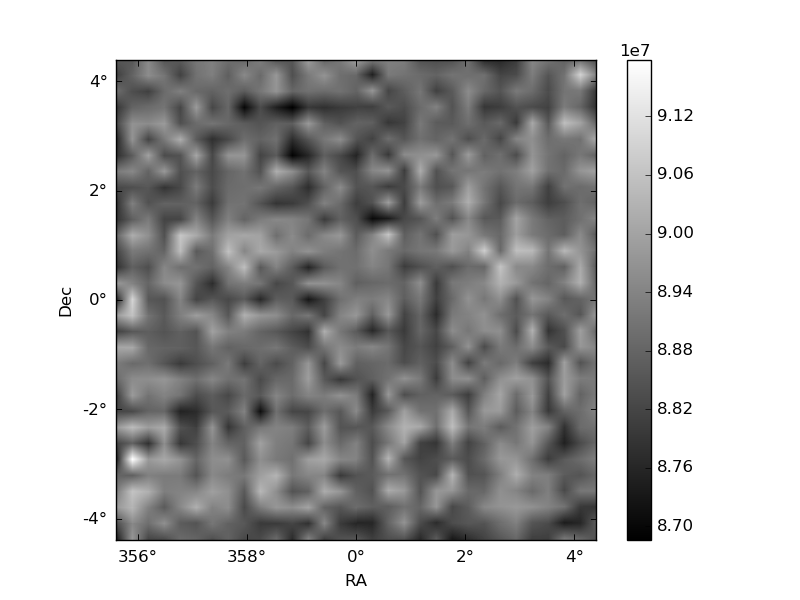
Quadrant B |
|---|---|---|---|
| Quadrant D | 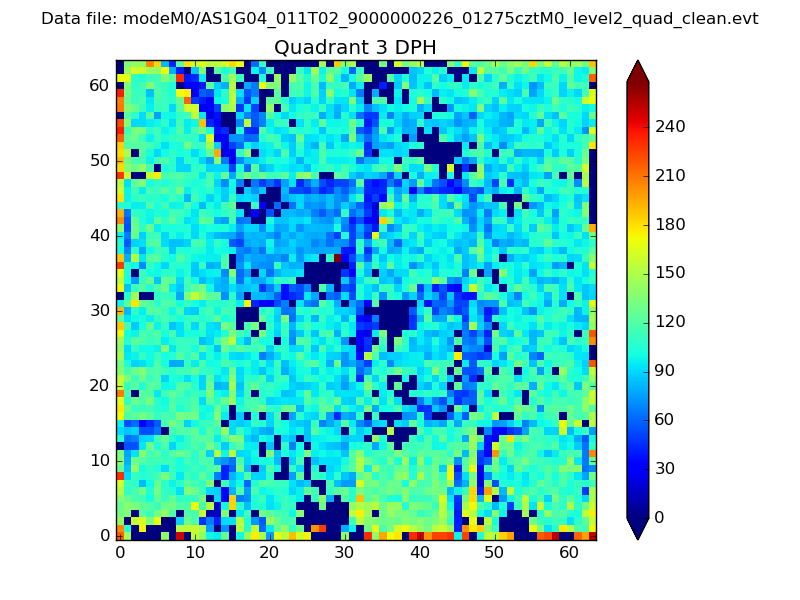 |
 |
Quadrant C |
| Plot type | Count rate plots | Images |
|---|---|---|
| Comparison with Poisson distribution Blue bars denote a histogram of data divided into 1 sec bins. Red curve is a Poisson curve with rate = median count rate of data. |
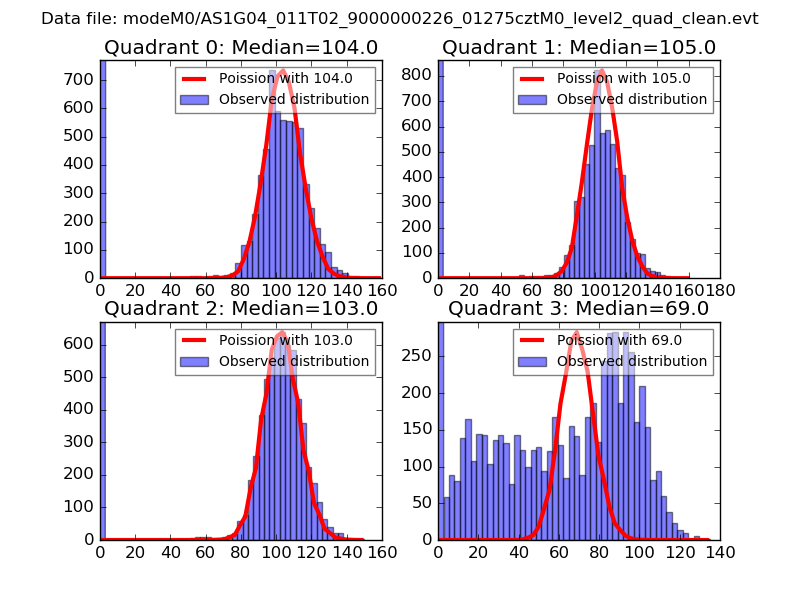 |
 |
| Quadrant-wise count rates Data is divided into 100 sec bins |
 |
|
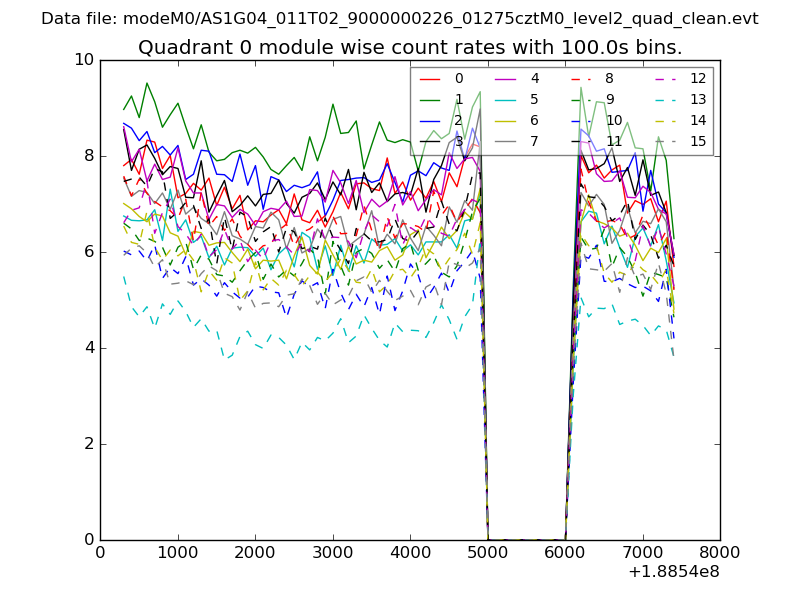
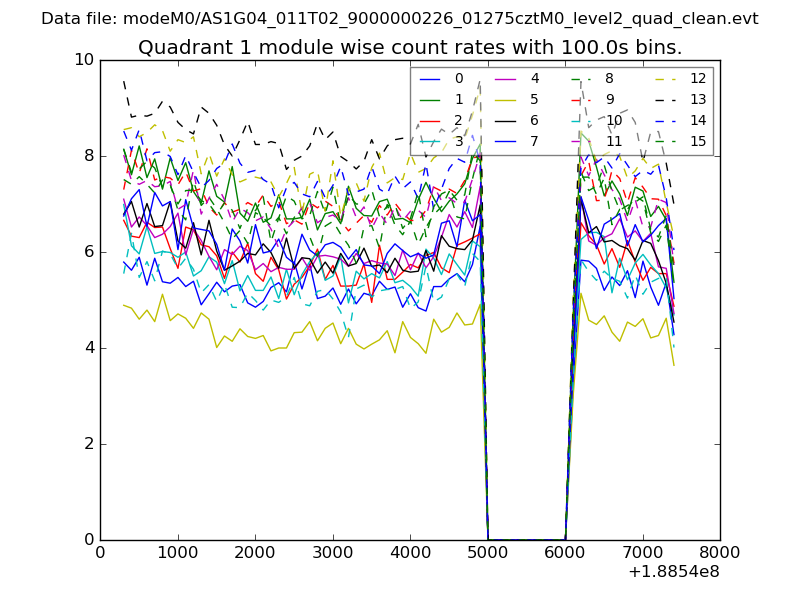
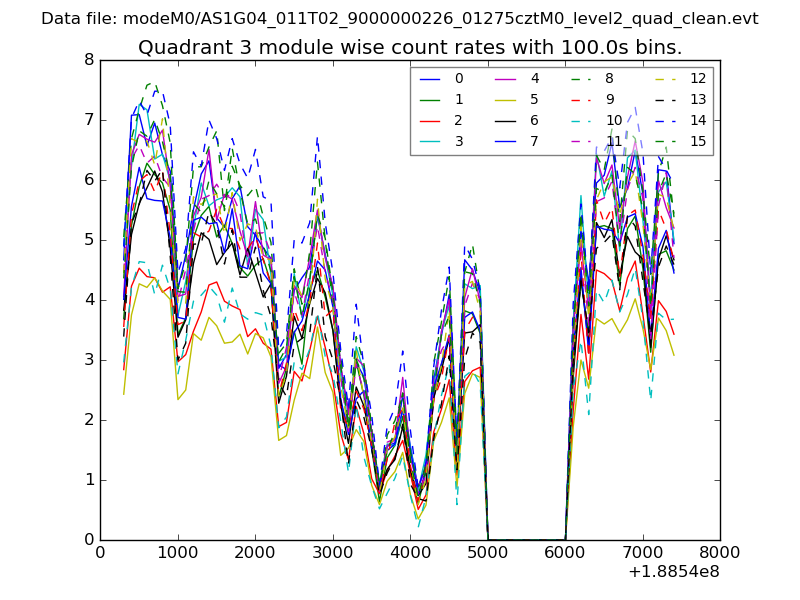
| Module-wise count rates for Quadrant A Data is divided into 100 sec bins |
 |
 |
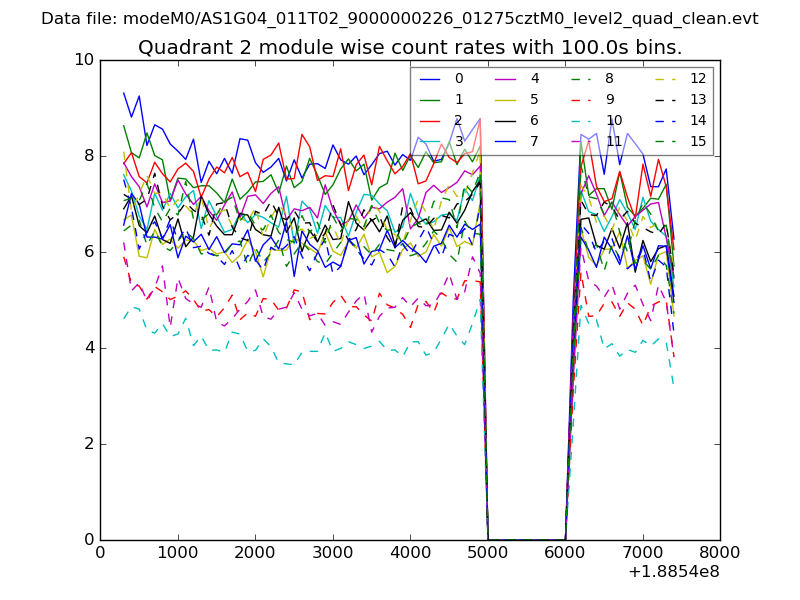
| Module-wise count rates for Quadrant B Data is divided into 100 sec bins |
 |
 |
| Module-wise count rates for Quadrant C Data is divided into 100 sec bins |
 |
 |
| Module-wise count rates for Quadrant D Data is divided into 100 sec bins |
 |
 |
| Parameter | Plot |
|---|---|
| CZT HV Monitor | 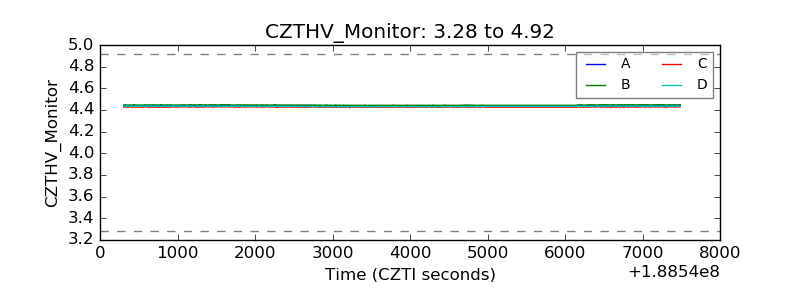 |
| D_VDD | 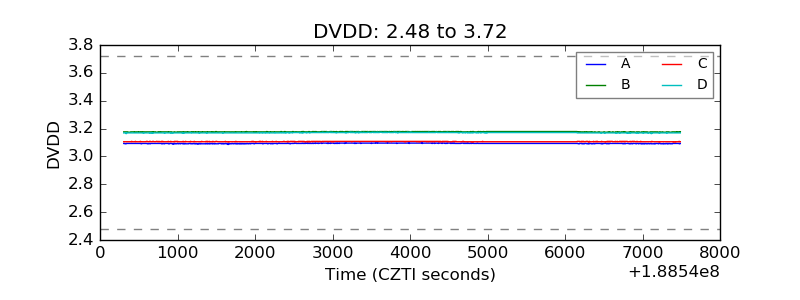 |
| Temperature 1 | 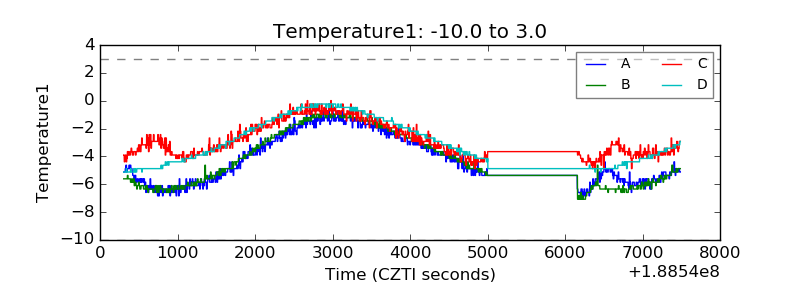 |
| Veto HV Monitor |  |
| Veto LLD | 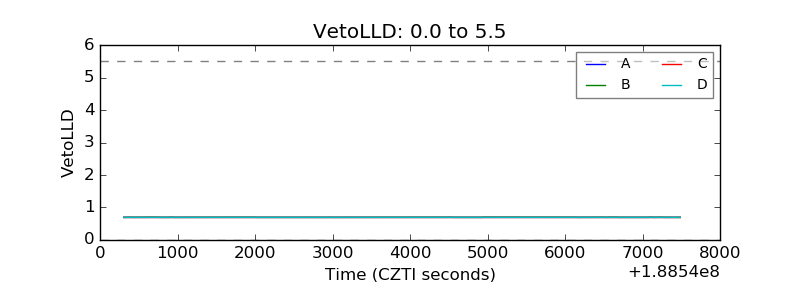 |
| Alpha Counter | 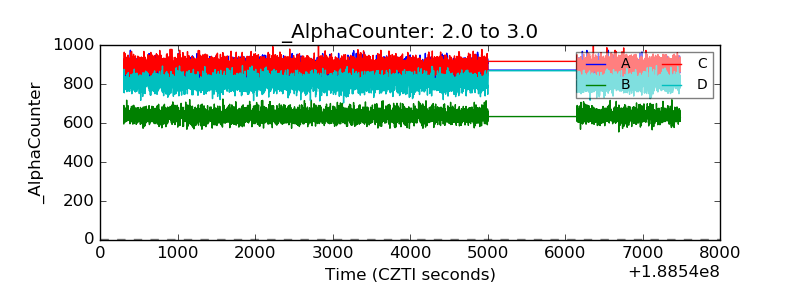 |
| _CPM_Rate | 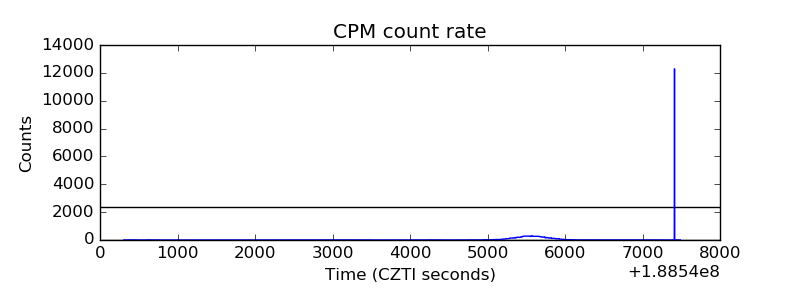 |
| CZT Counter |  |
| +2.5 Volts monitor |  |
| +5 Volts monitor |  |
| _ROLL_ROT | 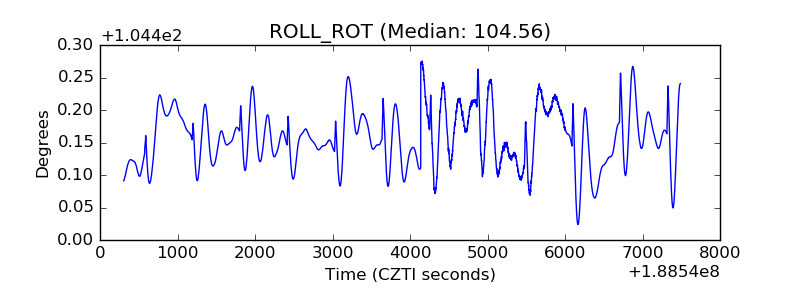 |
| _Roll_DEC | 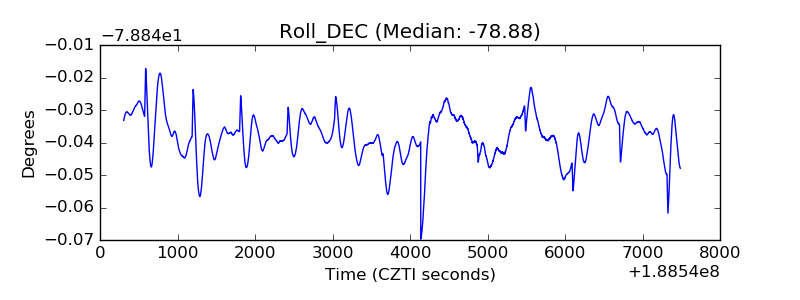 |
| _Roll_RA | 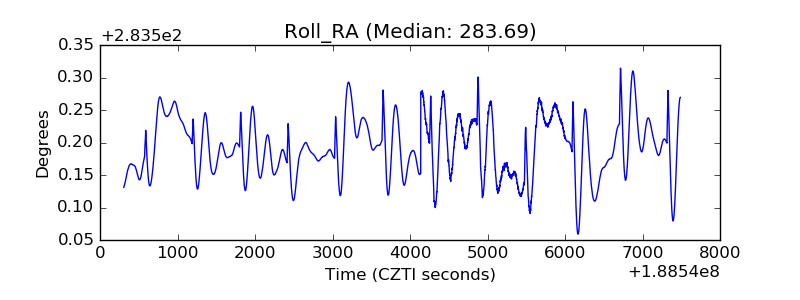 |
| Veto Counter | 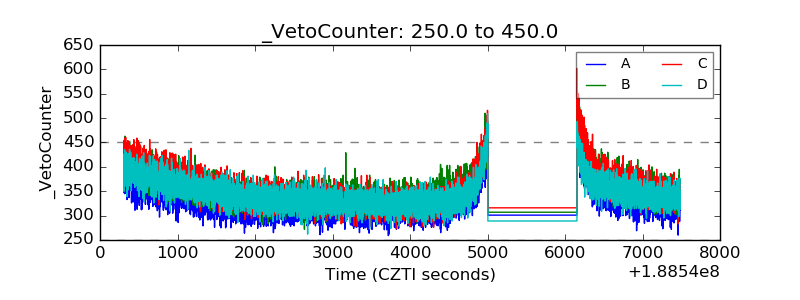 |