| Param | Original file | Final file |
|---|---|---|
| Filename | modeM0/AS1G04_011T02_9000000226_01277cztM0_level2.evt | modeM0/AS1G04_011T02_9000000226_01277cztM0_level2_quad_clean.evt |
| Size (bytes) | 1,682,084,160 | 101,721,600 |
| Size | 1.6 GB | 97.0 MB |
| Events in quadrant A | 9,226,871 | 713,056 |
| Events in quadrant B | 11,071,707 | 708,352 |
| Events in quadrant C | 9,261,822 | 708,130 |
| Events in quadrant D | 20,906,106 | 444,513 |
| Mode SS | |||
|---|---|---|---|
| Quadrant | BADHDUFLAG | Total packets | Discarded packets |
| A | 0 | 146 | 0 |
| B | 0 | 146 | 0 |
| C | 0 | 146 | 0 |
| D | 0 | 146 | 0 |
| Mode M0 | |||
|---|---|---|---|
| Quadrant | BADHDUFLAG | Total packets | Discarded packets |
| A | 0 | 32571 | 3 |
| B | 0 | 38062 | 2 |
| C | 0 | 32701 | 2 |
| D | 0 | 68057 | 2 |
| Quadrant | Total seconds | Saturated seconds | Saturation percentage |
|---|---|---|---|
| A | 7231 | 214 | 2.959480% |
| B | 7231 | 342 | 4.729636% |
| C | 7231 | 165 | 2.281842% |
| D | 7231 | 5368 | 74.235929% |
Noise dominated data is calculated using 1-second bins in cleaned event files. If a bin has >2000 counts, and if more than 50% of those come from <1% of pixels, then it is considered to be noise-dominated and hence unusable.
| Quadrant | # 1 sec bins | Bins with >0 counts | Bins with >2000 counts | High rate bins dominated by noise | Noise dominated (total time) | Noise dominated (detector-on time) | Marked lightcurve |
|---|---|---|---|---|---|---|---|
| A | 7266 | 7233 | 563 | 563 | 7.75% | 7.78% | 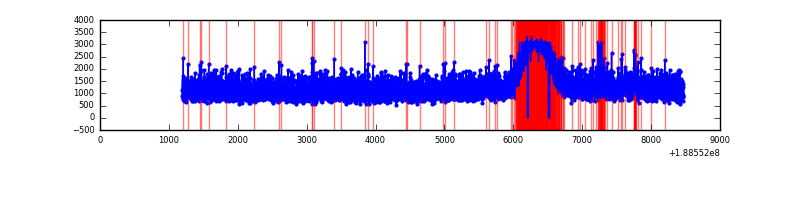 |
| B | 7266 | 7232 | 1228 | 1228 | 16.90% | 16.98% | 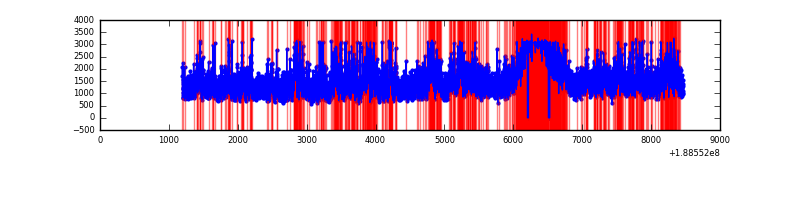 |
| C | 7266 | 7233 | 548 | 548 | 7.54% | 7.58% | 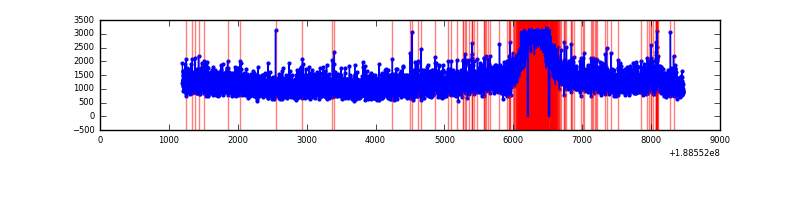 |
| D | 7265 | 7231 | 6791 | 6791 | 93.48% | 93.92% | 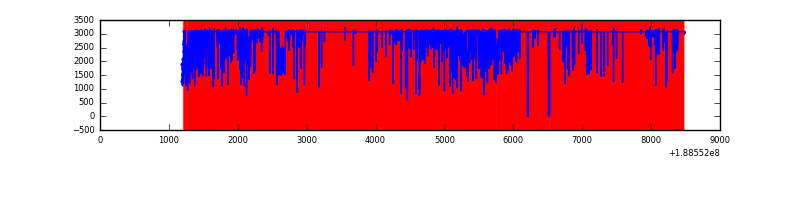 |
Top three noisy pixels from each quadrant. If the there are fewer than three noisy pixels in the level2.evt file, extra rows are filled as -1
| Pixel properties | Quadrant properties | ||||||
|---|---|---|---|---|---|---|---|
| Quadrant | DetID | PixID | Counts | Sigma | Mean | Median | Sigma |
| A | 12 | 243 | 86245 | 145.35 | 2376 | 2382 | 577.0 |
| A | 8 | 14 | 11079 | 15.07 | 2376 | 2382 | 577.0 |
| A | 11 | 79 | 10038 | 13.27 | 2376 | 2382 | 577.0 |
| B | 8 | 4 | 1289587 | 2204.16 | 2431 | 2426 | 584.0 |
| B | 12 | 52 | 213073 | 360.72 | 2431 | 2426 | 584.0 |
| B | 15 | 22 | 157140 | 264.94 | 2431 | 2426 | 584.0 |
| C | 15 | 241 | 355264 | 563.22 | 2226 | 2295 | 626.7 |
| C | 8 | 208 | 113710 | 177.78 | 2226 | 2295 | 626.7 |
| C | 3 | 79 | 54759 | 83.71 | 2226 | 2295 | 626.7 |
| D | 13 | 169 | 14096645 | 28732.28 | 1568 | 1615 | 490.6 |
| D | 10 | 84 | 766913 | 1560.04 | 1568 | 1615 | 490.6 |
| D | 13 | 205 | 70379 | 140.17 | 1568 | 1615 | 490.6 |
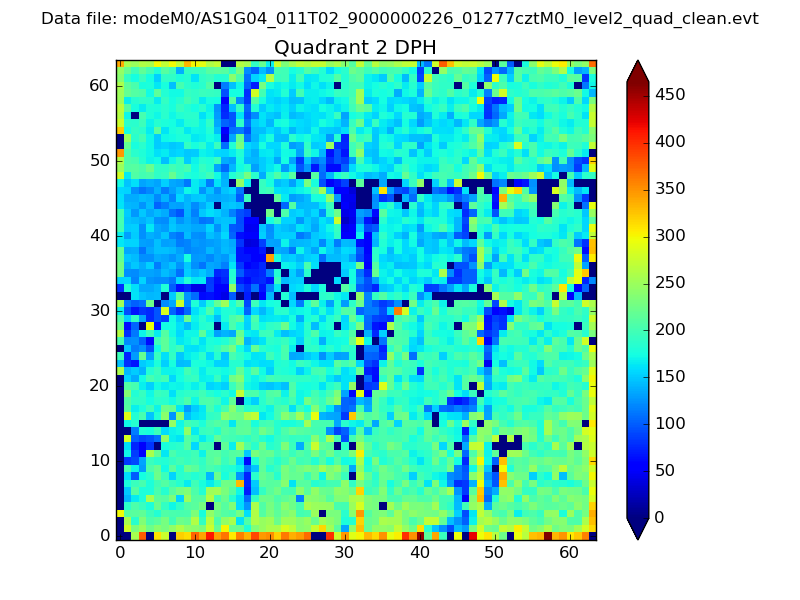
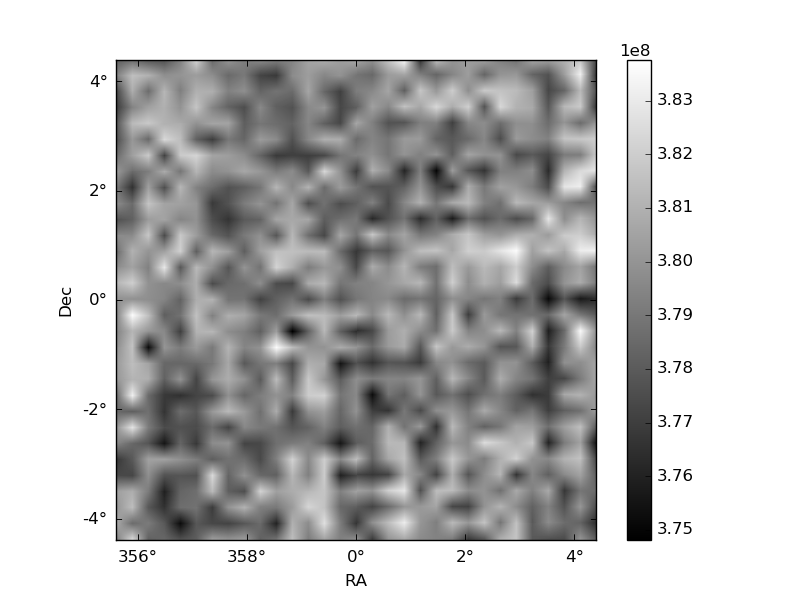
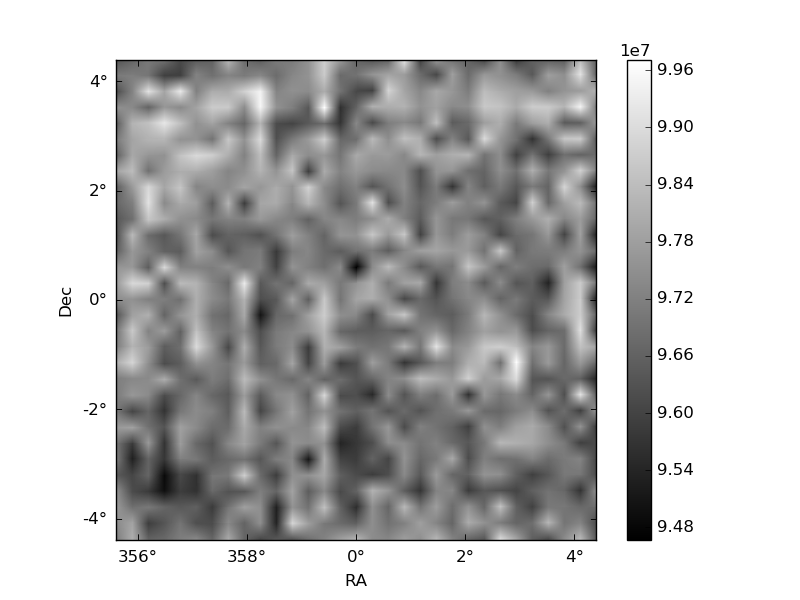
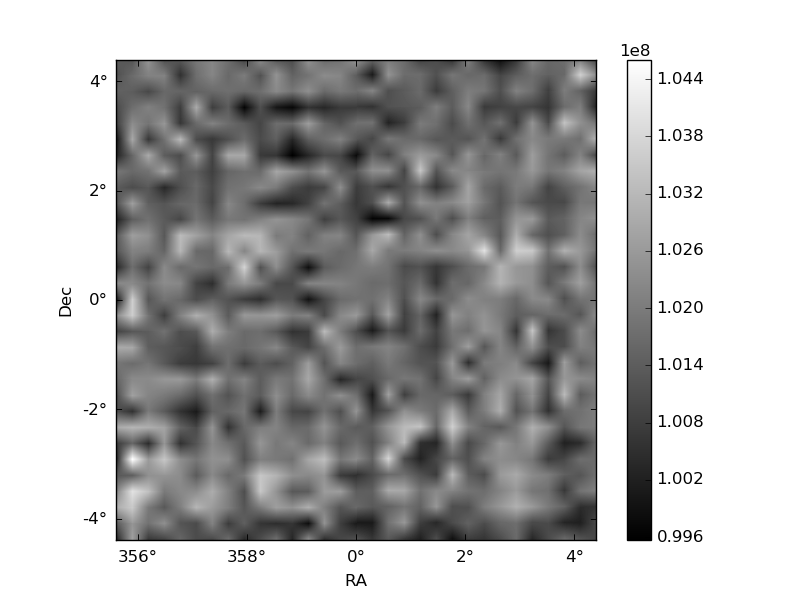
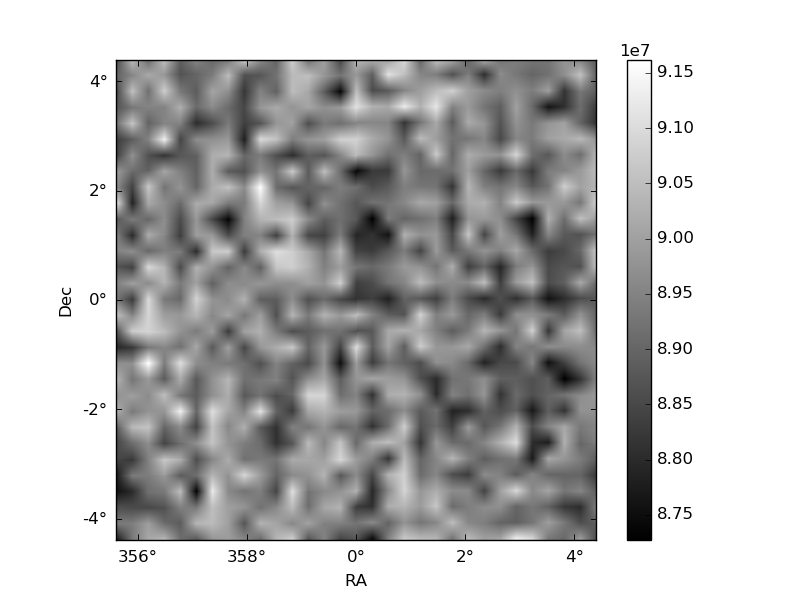
Histogram calculated using DETX and DETY for each event in the final _common_clean file
| Quadrant A | 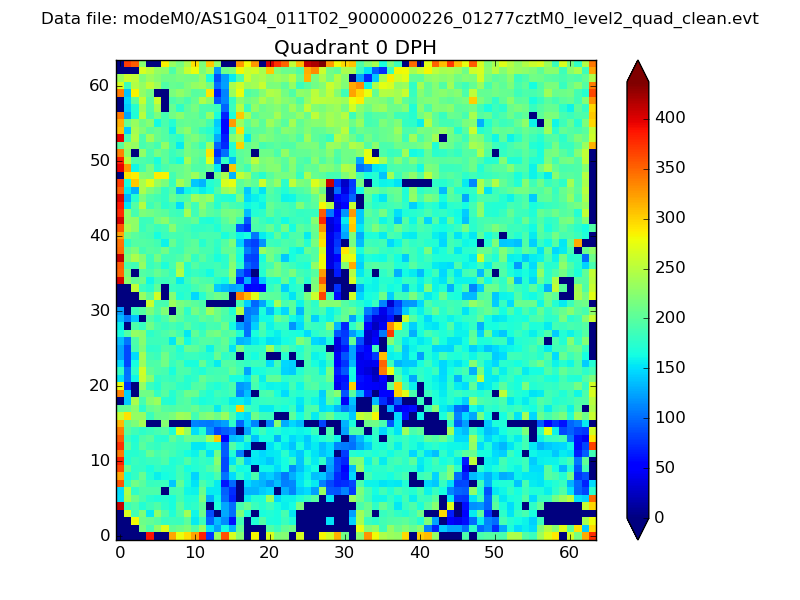 |
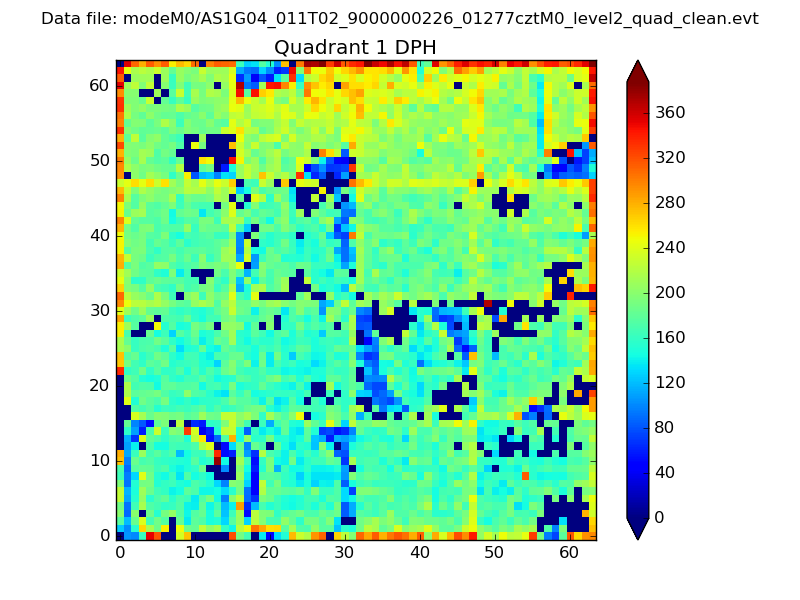 |
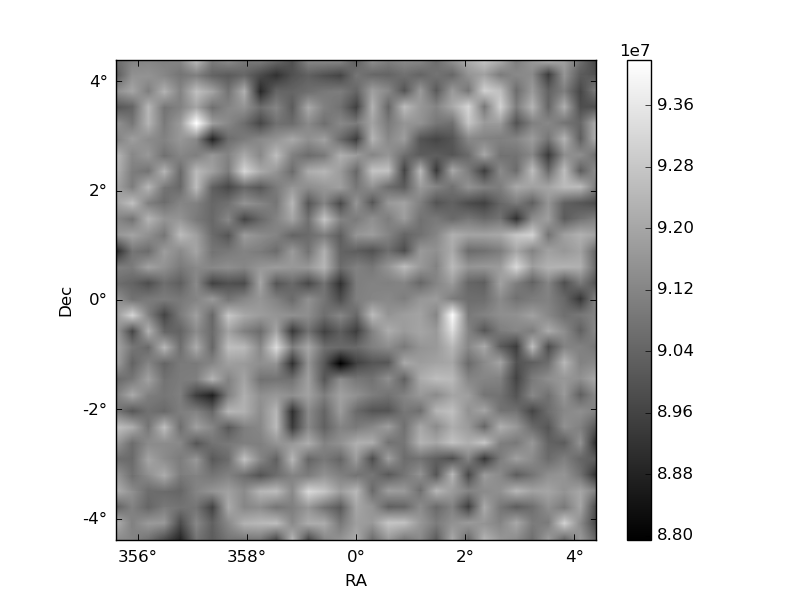
Quadrant B |
|---|---|---|---|
| Quadrant D | 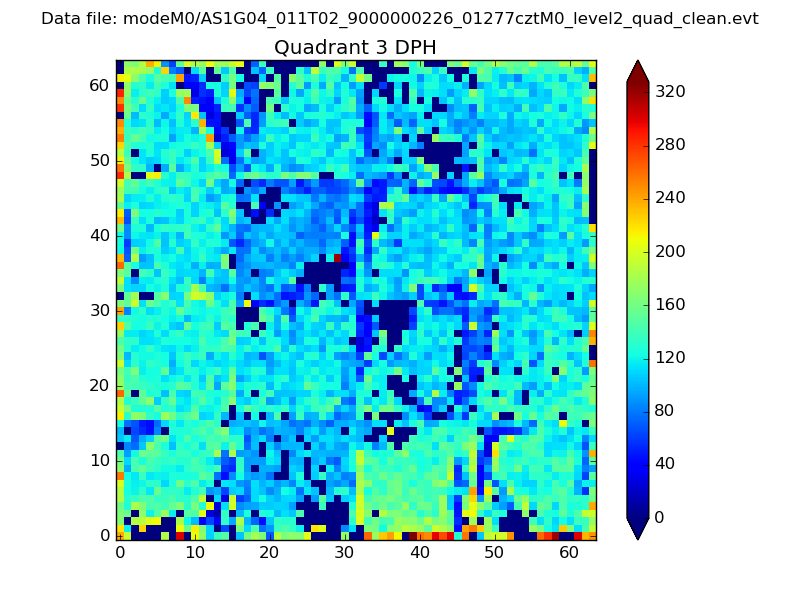 |
 |
Quadrant C |
| Plot type | Count rate plots | Images |
|---|---|---|
| Comparison with Poisson distribution Blue bars denote a histogram of data divided into 1 sec bins. Red curve is a Poisson curve with rate = median count rate of data. |
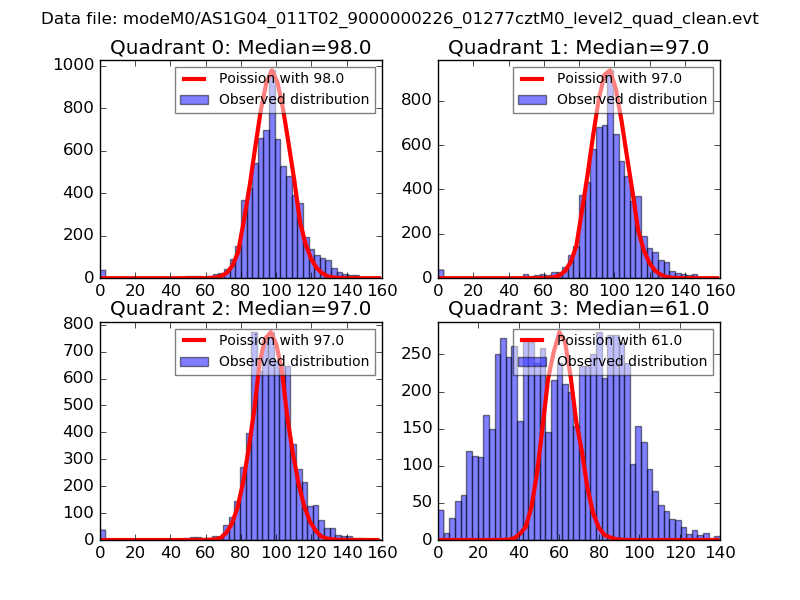 |
 |
| Quadrant-wise count rates Data is divided into 100 sec bins |
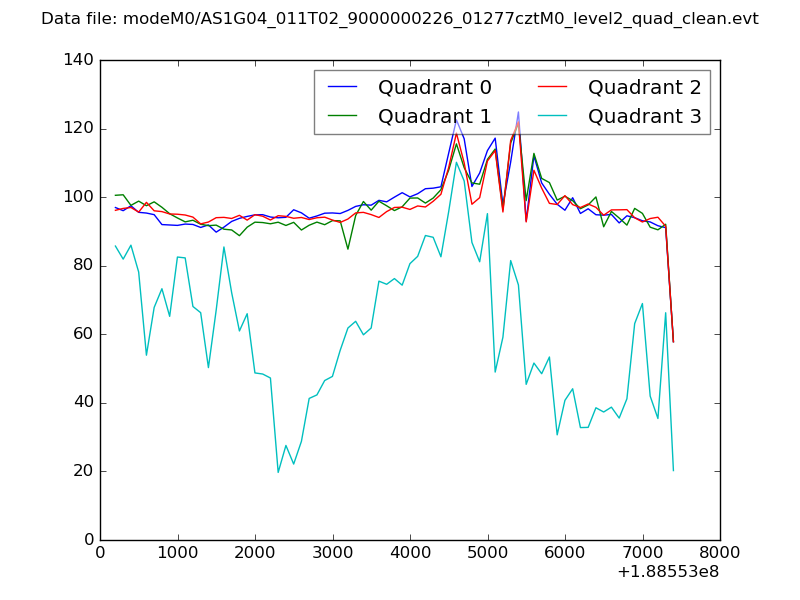 |
|
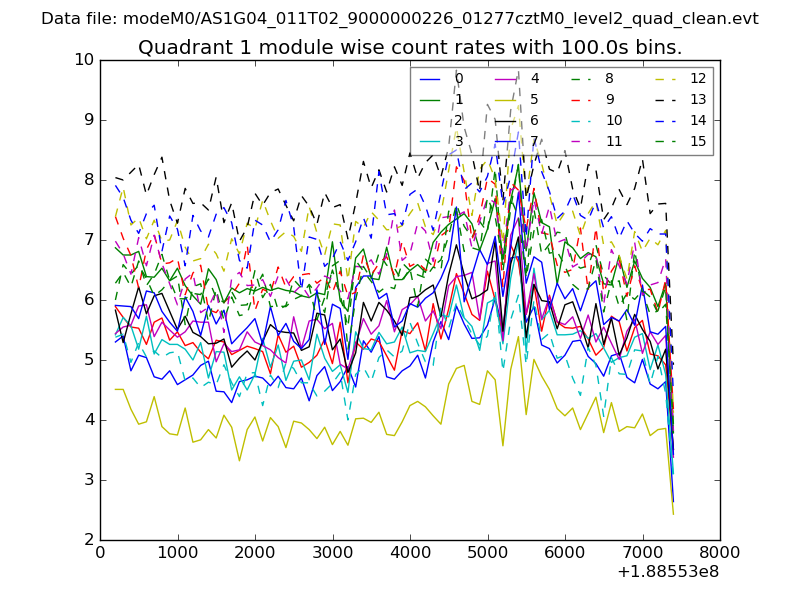
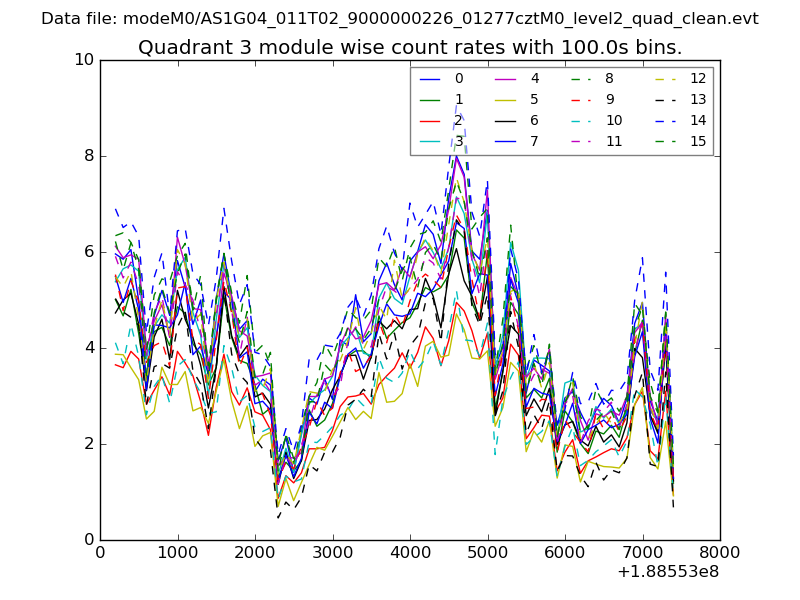
| Module-wise count rates for Quadrant A Data is divided into 100 sec bins |
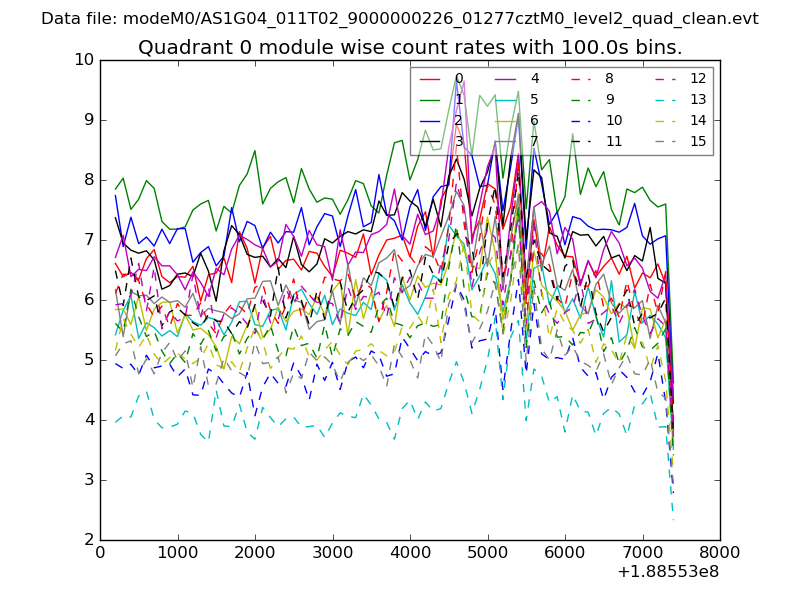 |
 |
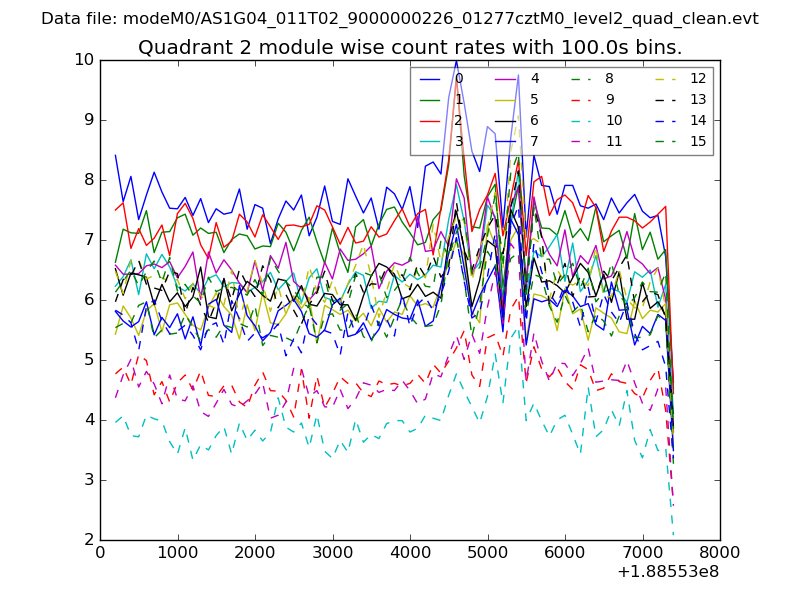
| Module-wise count rates for Quadrant B Data is divided into 100 sec bins |
 |
 |
| Module-wise count rates for Quadrant C Data is divided into 100 sec bins |
 |
 |
| Module-wise count rates for Quadrant D Data is divided into 100 sec bins |
 |
 |
| Parameter | Plot |
|---|---|
| CZT HV Monitor | 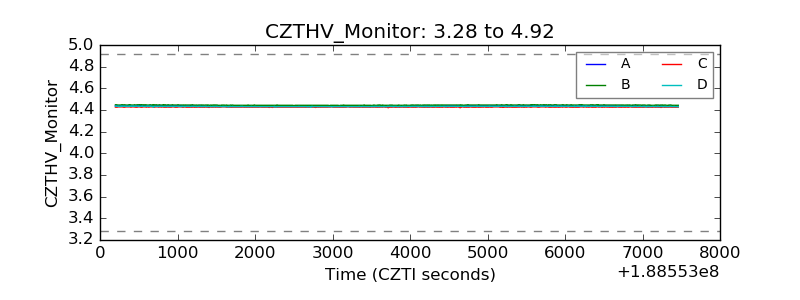 |
| D_VDD | 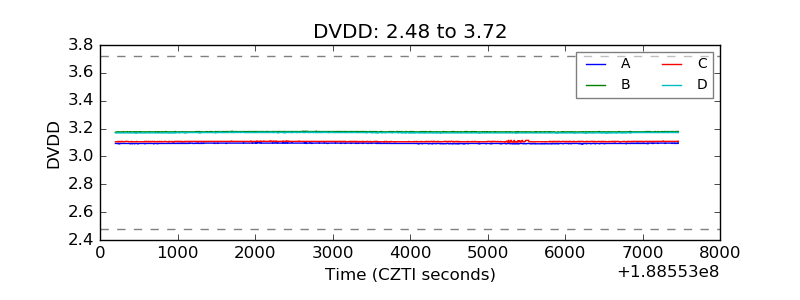 |
| Temperature 1 | 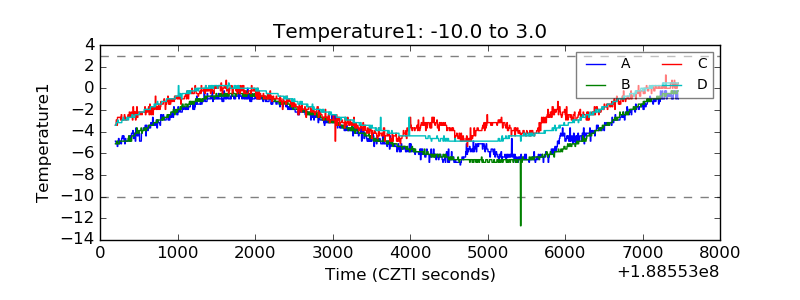 |
| Veto HV Monitor | 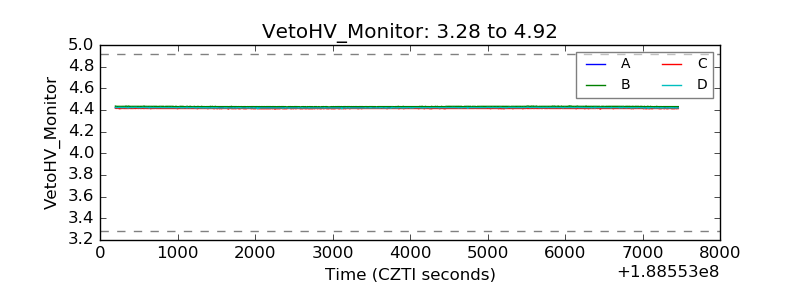 |
| Veto LLD | 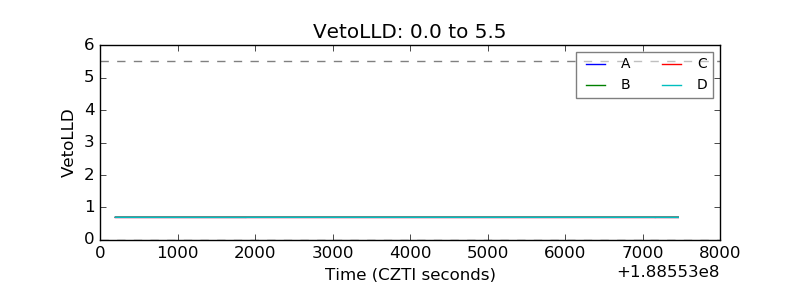 |
| Alpha Counter | 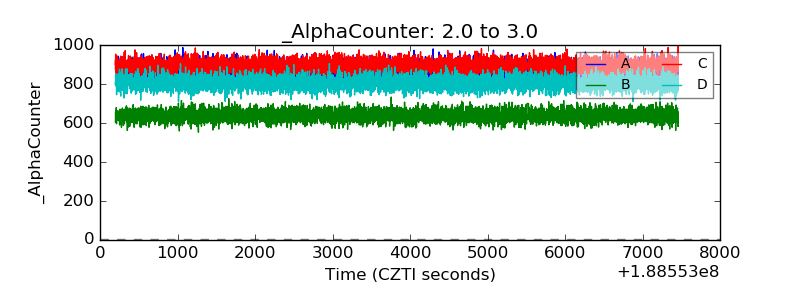 |
| _CPM_Rate | 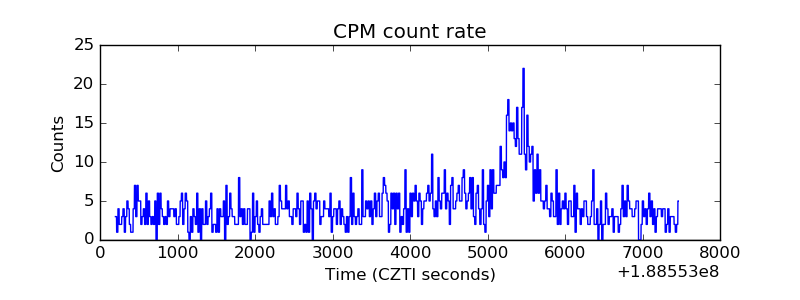 |
| CZT Counter | 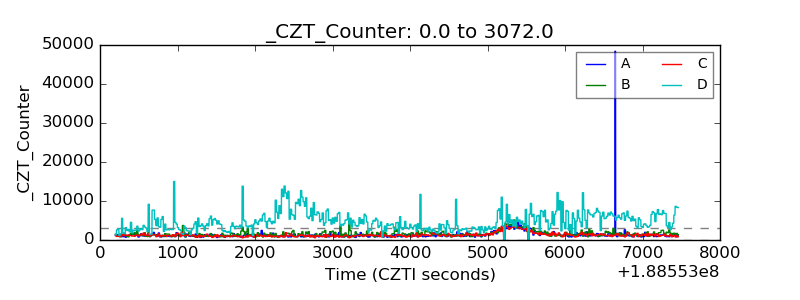 |
| +2.5 Volts monitor |  |
| +5 Volts monitor |  |
| _ROLL_ROT | 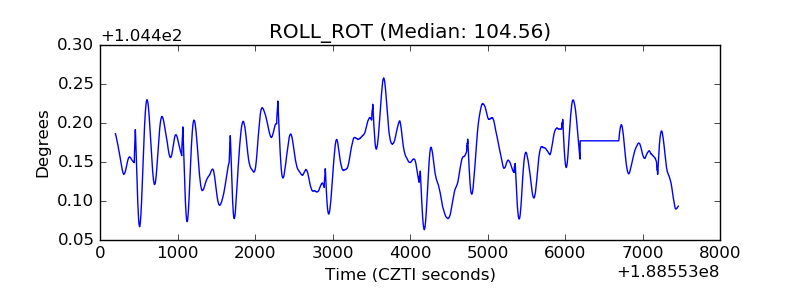 |
| _Roll_DEC | 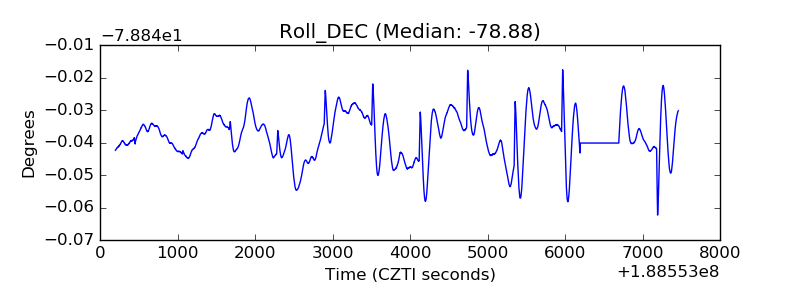 |
| _Roll_RA | 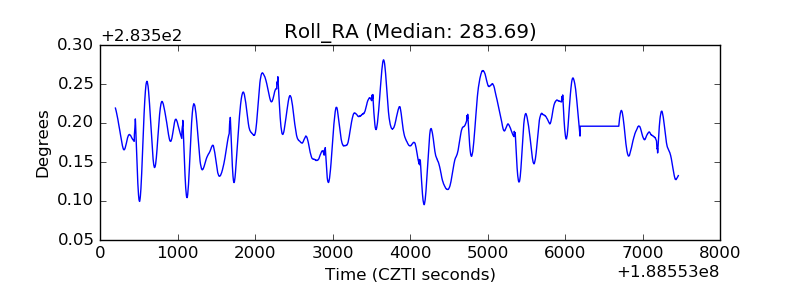 |
| Veto Counter | 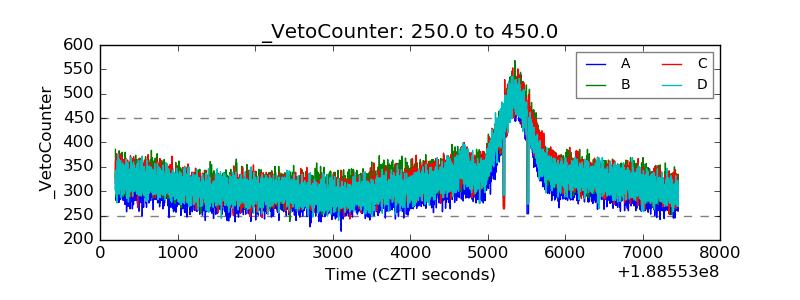 |