| Param | Original file | Final file |
|---|---|---|
| Filename | modeM0/AS1G04_011T02_9000000226_01278cztM0_level2.evt | modeM0/AS1G04_011T02_9000000226_01278cztM0_level2_quad_clean.evt |
| Size (bytes) | 1,524,202,560 | 101,335,680 |
| Size | 1.4 GB | 96.6 MB |
| Events in quadrant A | 8,729,739 | 683,211 |
| Events in quadrant B | 10,290,107 | 678,792 |
| Events in quadrant C | 9,020,288 | 670,382 |
| Events in quadrant D | 17,660,306 | 546,779 |
| Mode SS | |||
|---|---|---|---|
| Quadrant | BADHDUFLAG | Total packets | Discarded packets |
| A | 0 | 140 | 0 |
| B | 0 | 140 | 0 |
| C | 0 | 140 | 0 |
| D | 0 | 140 | 0 |
| Mode M0 | |||
|---|---|---|---|
| Quadrant | BADHDUFLAG | Total packets | Discarded packets |
| A | 0 | 30902 | 1 |
| B | 0 | 35545 | 0 |
| C | 0 | 31771 | 0 |
| D | 0 | 57786 | 0 |
| Quadrant | Total seconds | Saturated seconds | Saturation percentage |
|---|---|---|---|
| A | 7014 | 7 | 0.099800% |
| B | 7014 | 109 | 1.554035% |
| C | 7014 | 35 | 0.499002% |
| D | 7014 | 2707 | 38.594240% |
Noise dominated data is calculated using 1-second bins in cleaned event files. If a bin has >2000 counts, and if more than 50% of those come from <1% of pixels, then it is considered to be noise-dominated and hence unusable.
| Quadrant | # 1 sec bins | Bins with >0 counts | Bins with >2000 counts | High rate bins dominated by noise | Noise dominated (total time) | Noise dominated (detector-on time) | Marked lightcurve |
|---|---|---|---|---|---|---|---|
| A | 7014 | 7014 | 322 | 322 | 4.59% | 4.59% | 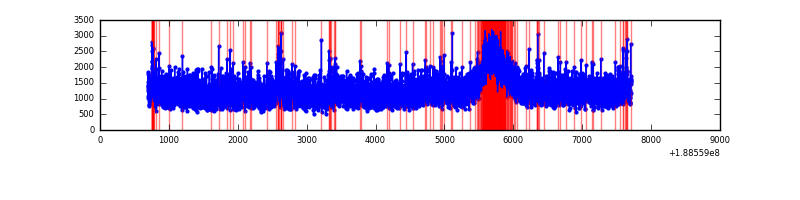 |
| B | 7014 | 7014 | 951 | 951 | 13.56% | 13.56% | 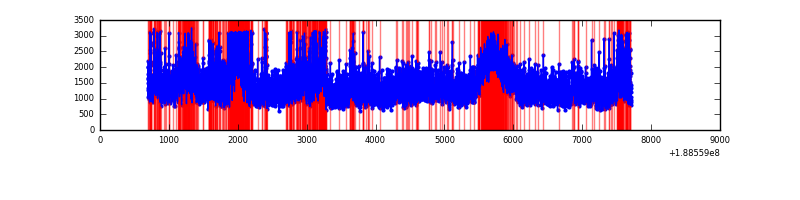 |
| C | 7014 | 7014 | 542 | 542 | 7.73% | 7.73% | 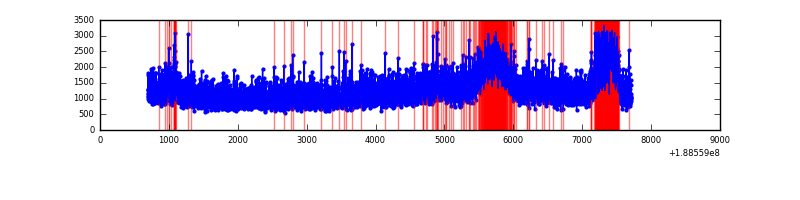 |
| D | 7013 | 7013 | 5322 | 5322 | 75.89% | 75.89% | 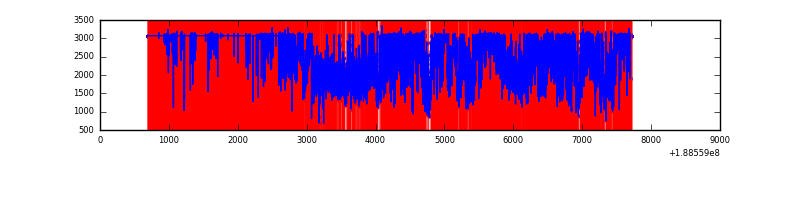 |
Top three noisy pixels from each quadrant. If the there are fewer than three noisy pixels in the level2.evt file, extra rows are filled as -1
| Pixel properties | Quadrant properties | ||||||
|---|---|---|---|---|---|---|---|
| Quadrant | DetID | PixID | Counts | Sigma | Mean | Median | Sigma |
| A | 12 | 243 | 254005 | 473.65 | 2193 | 2204 | 531.6 |
| A | 13 | 9 | 33247 | 58.39 | 2193 | 2204 | 531.6 |
| A | 8 | 14 | 16898 | 27.64 | 2193 | 2204 | 531.6 |
| B | 8 | 4 | 931174 | 1725.87 | 2261 | 2261 | 538.2 |
| B | 12 | 52 | 338147 | 624.06 | 2261 | 2261 | 538.2 |
| B | 6 | 53 | 169465 | 310.66 | 2261 | 2261 | 538.2 |
| C | 8 | 208 | 544197 | 946.23 | 2050 | 2120 | 572.9 |
| C | 15 | 241 | 357473 | 620.29 | 2050 | 2120 | 572.9 |
| C | 3 | 79 | 61057 | 102.88 | 2050 | 2120 | 572.9 |
| D | 13 | 169 | 10503555 | 18832.46 | 1797 | 1869 | 557.6 |
| D | 10 | 84 | 255136 | 454.18 | 1797 | 1869 | 557.6 |
| D | 13 | 205 | 38270 | 65.28 | 1797 | 1869 | 557.6 |
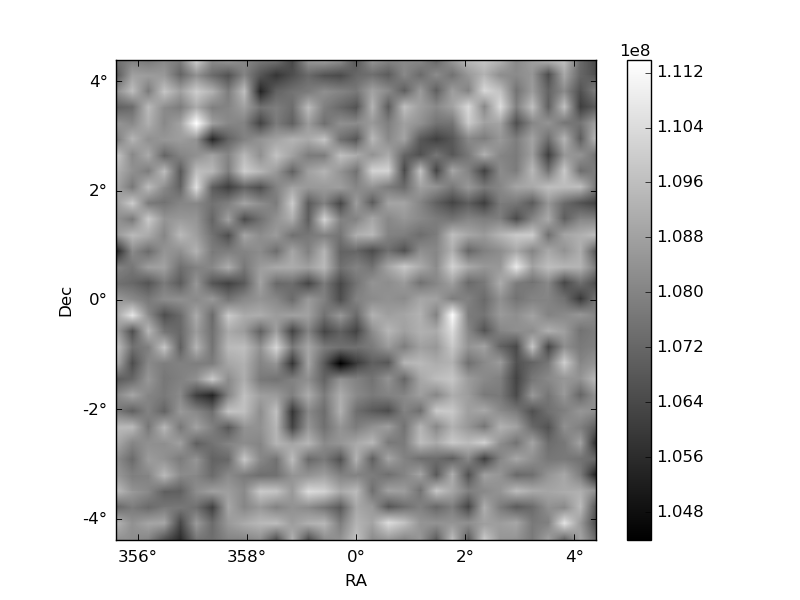
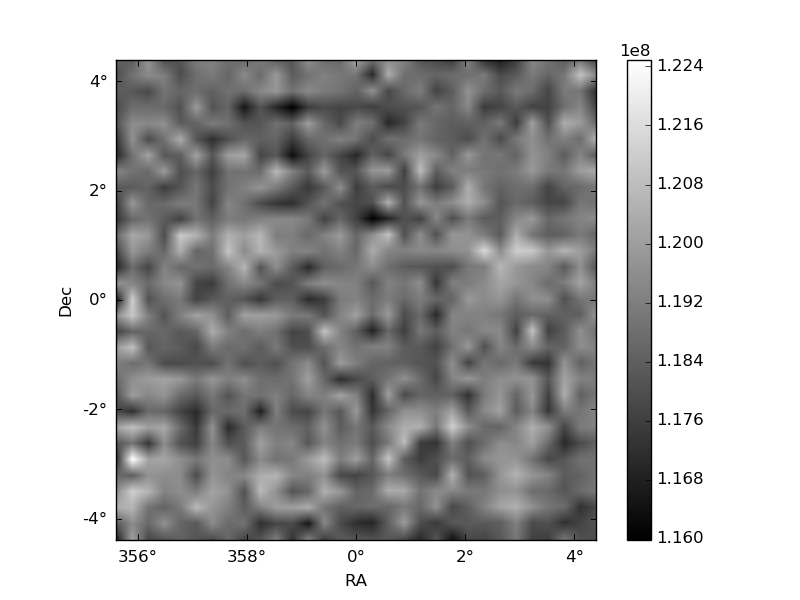
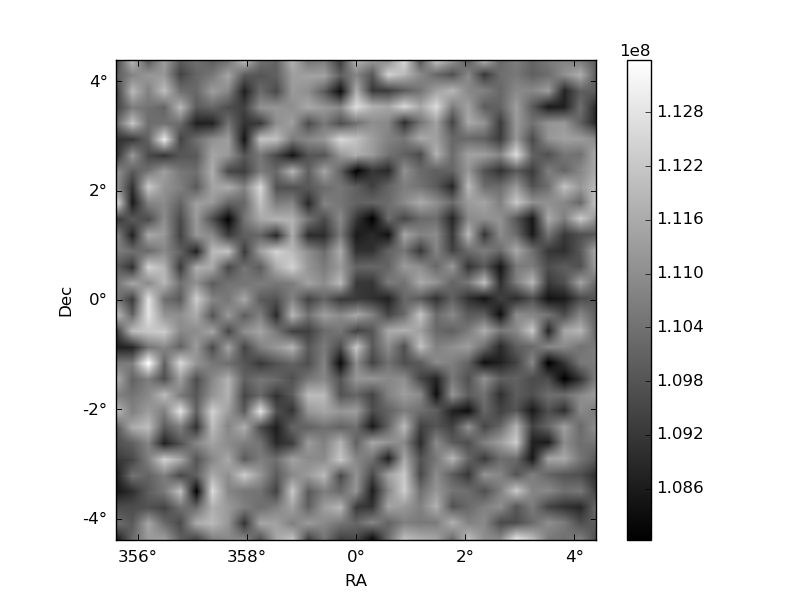
Histogram calculated using DETX and DETY for each event in the final _common_clean file
| Quadrant A | 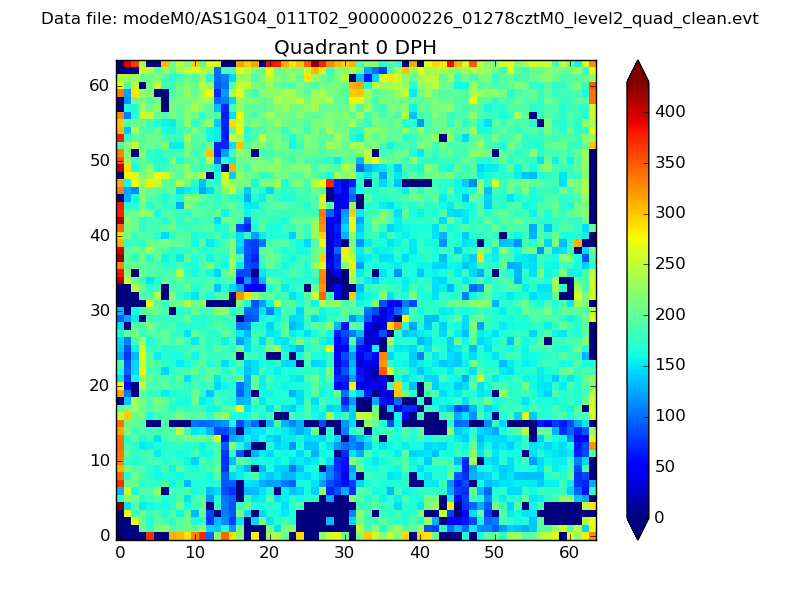 |
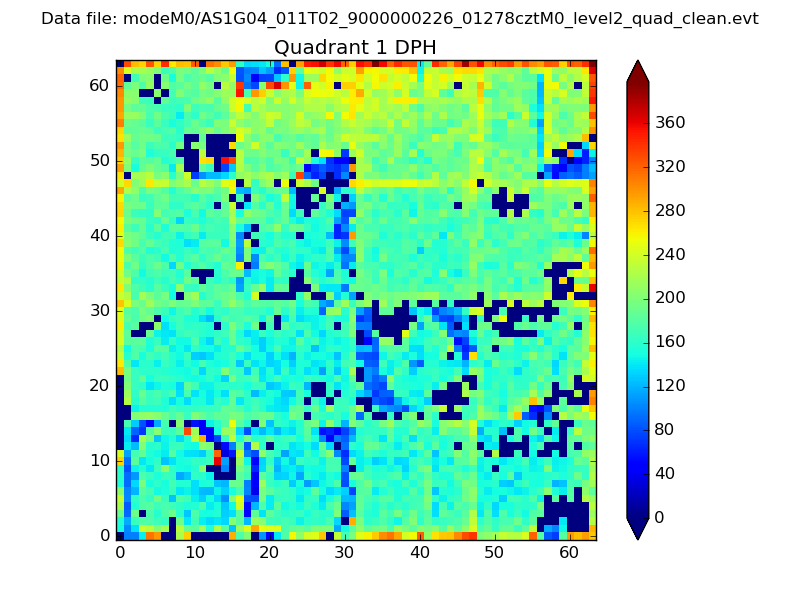 |
Quadrant B |
|---|---|---|---|
| Quadrant D | 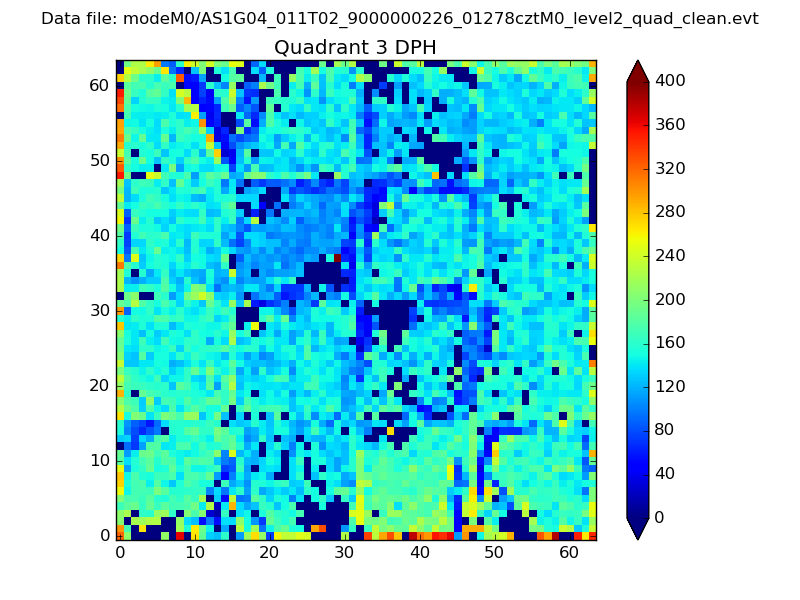 |
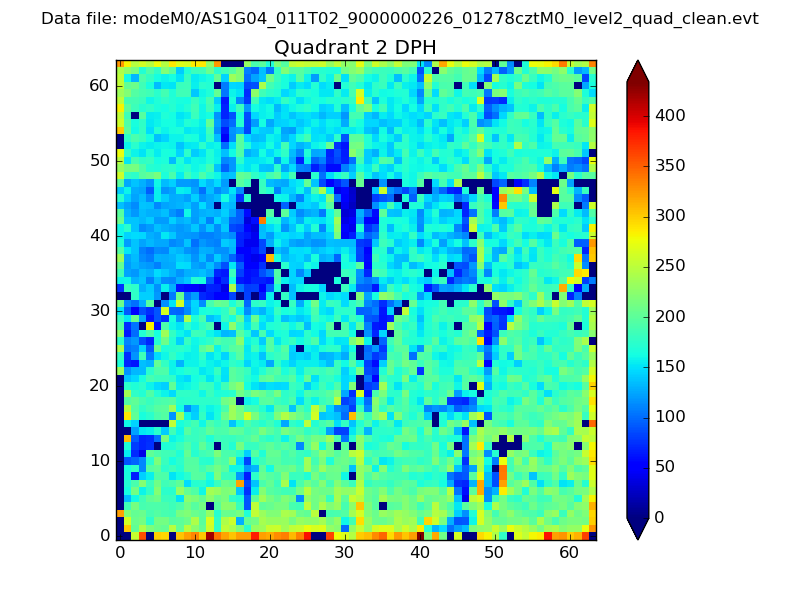 |
Quadrant C |
| Plot type | Count rate plots | Images |
|---|---|---|
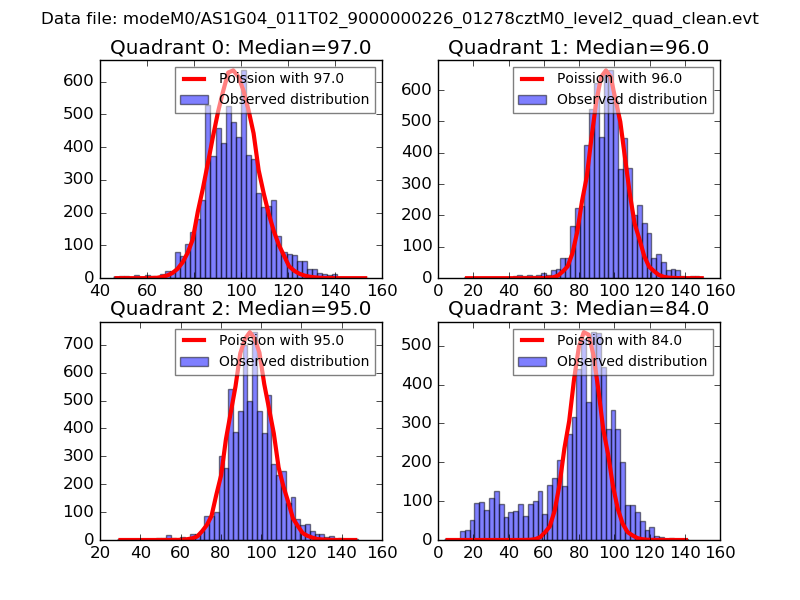
| Comparison with Poisson distribution Blue bars denote a histogram of data divided into 1 sec bins. Red curve is a Poisson curve with rate = median count rate of data. |
 |
 |
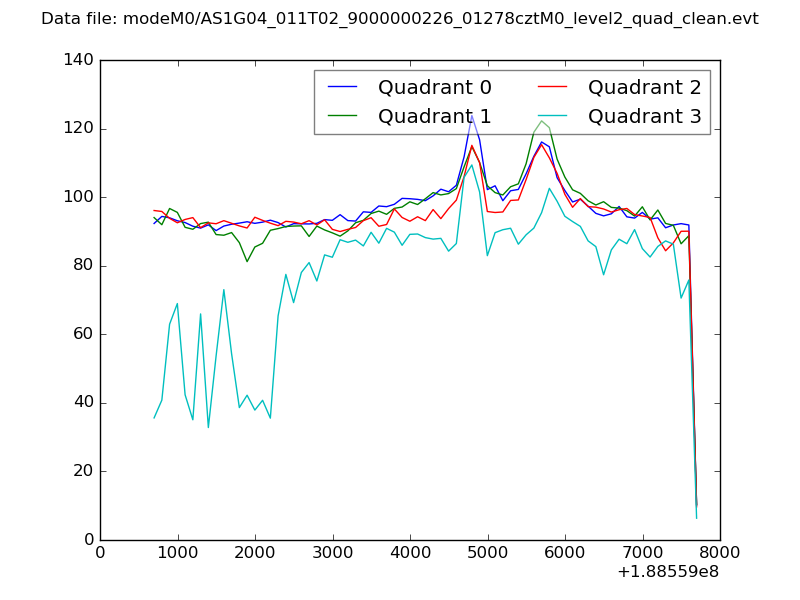
| Quadrant-wise count rates Data is divided into 100 sec bins |
 |
|
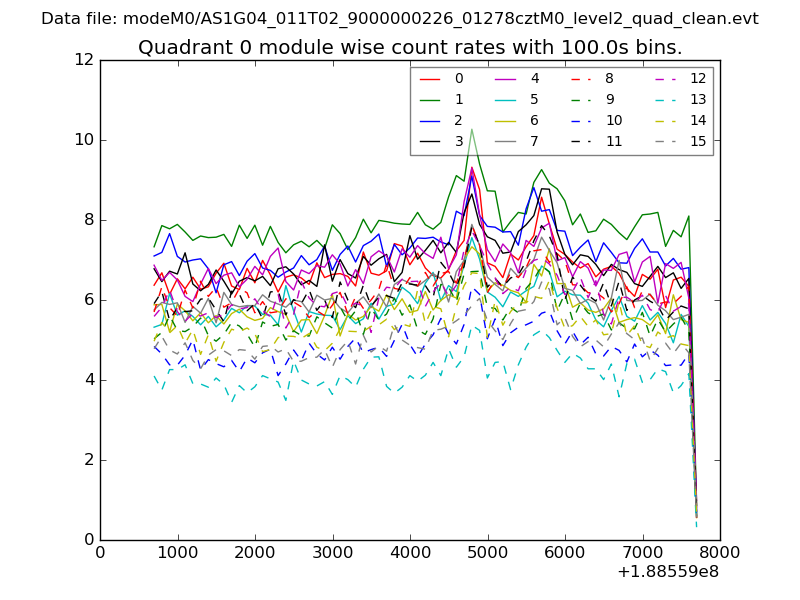
| Module-wise count rates for Quadrant A Data is divided into 100 sec bins |
 |
 |
| Module-wise count rates for Quadrant B Data is divided into 100 sec bins |
 |
 |
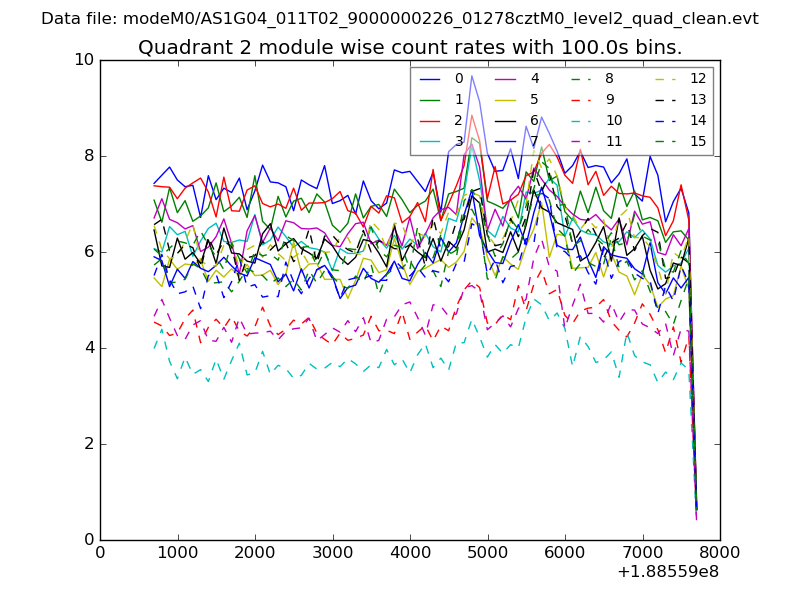
| Module-wise count rates for Quadrant C Data is divided into 100 sec bins |
 |
 |
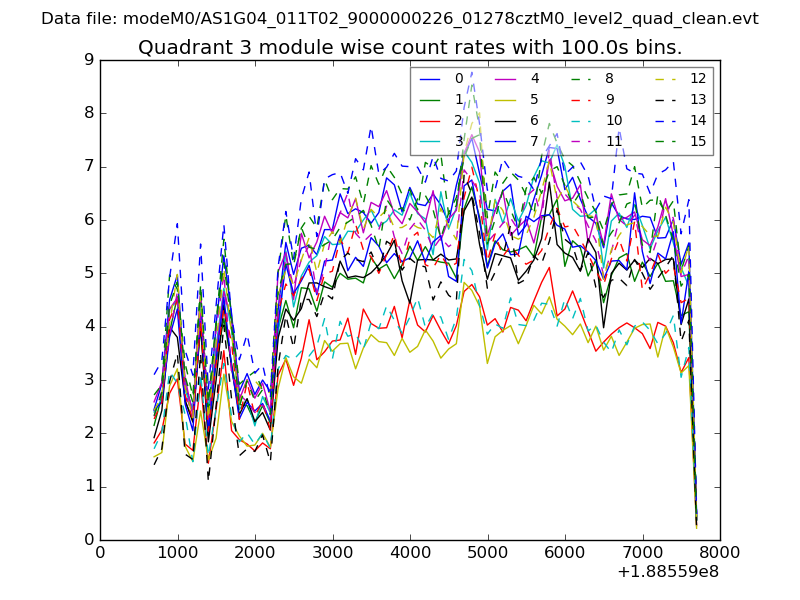
| Module-wise count rates for Quadrant D Data is divided into 100 sec bins |
 |
 |
| Parameter | Plot |
|---|---|
| CZT HV Monitor | 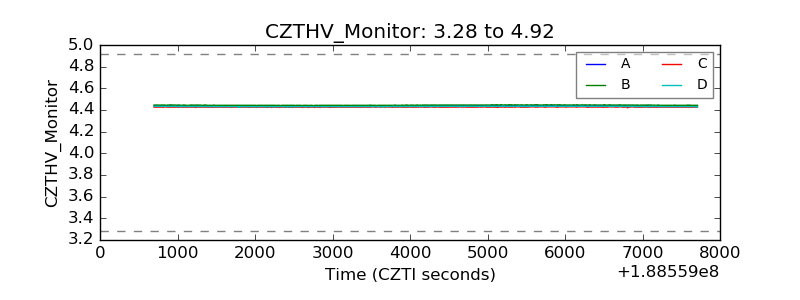 |
| D_VDD | 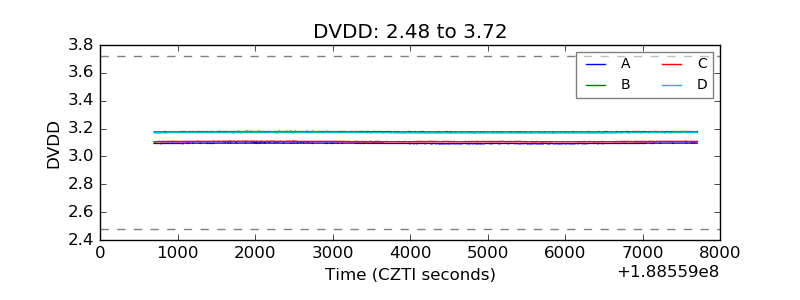 |
| Temperature 1 | 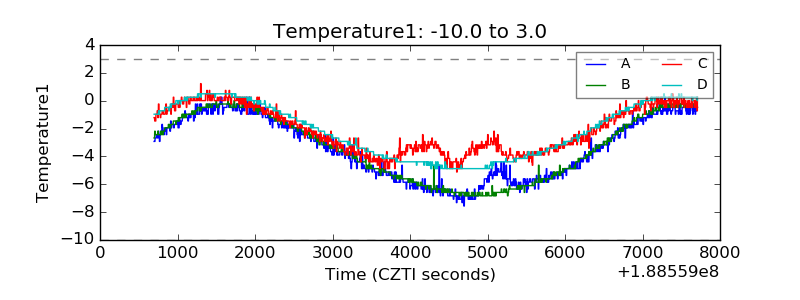 |
| Veto HV Monitor | 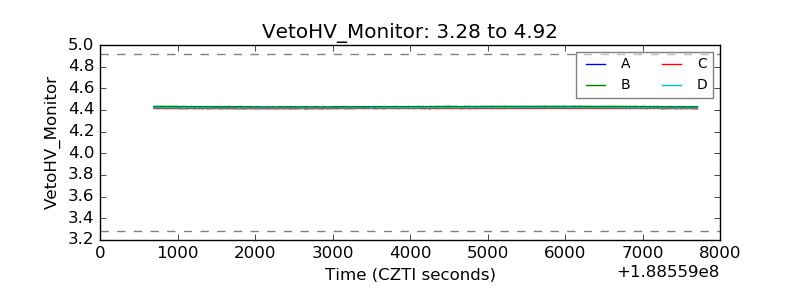 |
| Veto LLD | 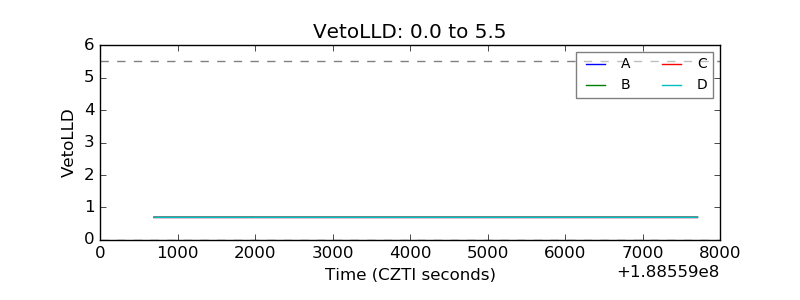 |
| Alpha Counter | 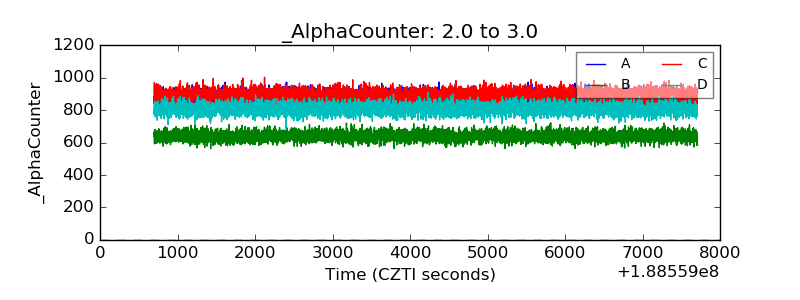 |
| _CPM_Rate | 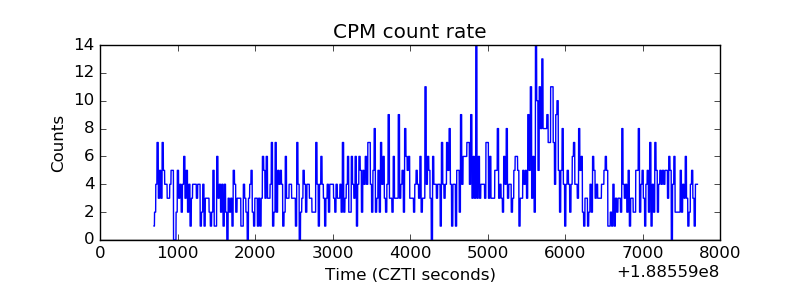 |
| CZT Counter |  |
| +2.5 Volts monitor |  |
| +5 Volts monitor |  |
| _ROLL_ROT | 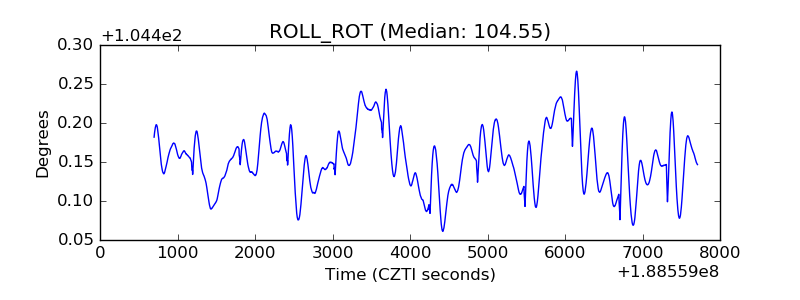 |
| _Roll_DEC | 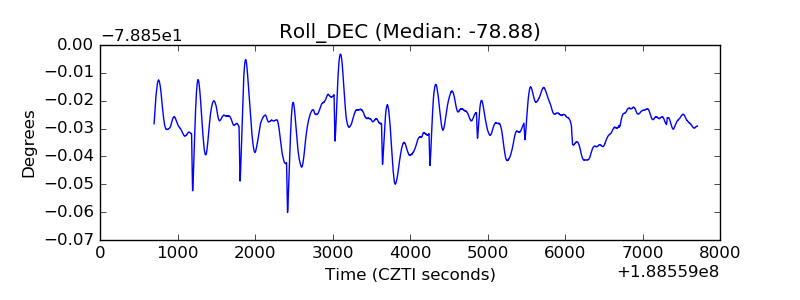 |
| _Roll_RA |  |
| Veto Counter | 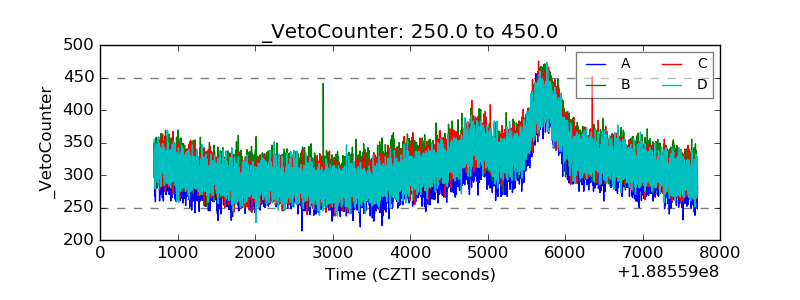 |