| Param | Original file | Final file |
|---|---|---|
| Filename | modeM0/AS1G04_011T02_9000000226_01279cztM0_level2.evt | modeM0/AS1G04_011T02_9000000226_01279cztM0_level2_quad_clean.evt |
| Size (bytes) | 1,559,085,120 | 104,889,600 |
| Size | 1.5 GB | 100.0 MB |
| Events in quadrant A | 9,012,929 | 698,949 |
| Events in quadrant B | 9,797,614 | 698,275 |
| Events in quadrant C | 9,905,499 | 682,762 |
| Events in quadrant D | 18,033,411 | 598,671 |
| Mode SS | |||
|---|---|---|---|
| Quadrant | BADHDUFLAG | Total packets | Discarded packets |
| A | 0 | 142 | 0 |
| B | 0 | 142 | 0 |
| C | 0 | 142 | 0 |
| D | 0 | 142 | 0 |
| Mode M0 | |||
|---|---|---|---|
| Quadrant | BADHDUFLAG | Total packets | Discarded packets |
| A | 0 | 31798 | 1 |
| B | 0 | 34203 | 0 |
| C | 0 | 34494 | 0 |
| D | 0 | 58872 | 0 |
| Quadrant | Total seconds | Saturated seconds | Saturation percentage |
|---|---|---|---|
| A | 7140 | 52 | 0.728291% |
| B | 7140 | 74 | 1.036415% |
| C | 7140 | 77 | 1.078431% |
| D | 7140 | 2224 | 31.148459% |
Noise dominated data is calculated using 1-second bins in cleaned event files. If a bin has >2000 counts, and if more than 50% of those come from <1% of pixels, then it is considered to be noise-dominated and hence unusable.
| Quadrant | # 1 sec bins | Bins with >0 counts | Bins with >2000 counts | High rate bins dominated by noise | Noise dominated (total time) | Noise dominated (detector-on time) | Marked lightcurve |
|---|---|---|---|---|---|---|---|
| A | 7140 | 7140 | 448 | 448 | 6.27% | 6.27% | 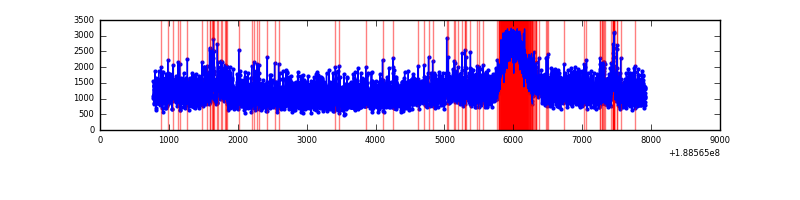 |
| B | 7140 | 7140 | 679 | 679 | 9.51% | 9.51% |  |
| C | 7140 | 7140 | 918 | 918 | 12.86% | 12.86% | 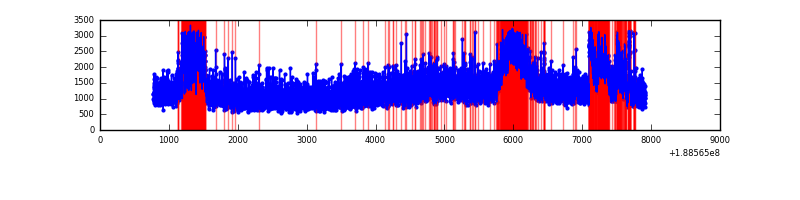 |
| D | 7140 | 7140 | 5668 | 5668 | 79.38% | 79.38% | 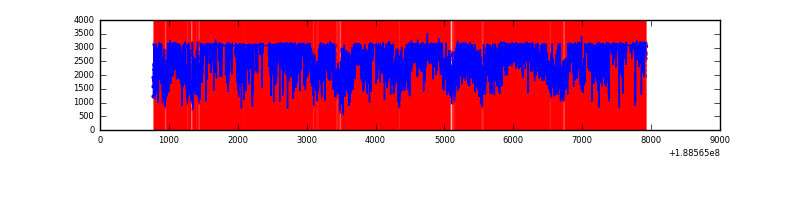 |
Top three noisy pixels from each quadrant. If the there are fewer than three noisy pixels in the level2.evt file, extra rows are filled as -1
| Pixel properties | Quadrant properties | ||||||
|---|---|---|---|---|---|---|---|
| Quadrant | DetID | PixID | Counts | Sigma | Mean | Median | Sigma |
| A | 12 | 243 | 208237 | 372.99 | 2283 | 2298 | 552.1 |
| A | 8 | 14 | 18444 | 29.24 | 2283 | 2298 | 552.1 |
| A | 0 | 183 | 13246 | 19.83 | 2283 | 2298 | 552.1 |
| B | 8 | 4 | 368146 | 655.56 | 2356 | 2364 | 558.0 |
| B | 6 | 53 | 112865 | 198.04 | 2356 | 2364 | 558.0 |
| B | 15 | 22 | 108370 | 189.99 | 2356 | 2364 | 558.0 |
| C | 8 | 208 | 579570 | 974.98 | 2122 | 2195 | 592.2 |
| C | 9 | 52 | 566587 | 953.05 | 2122 | 2195 | 592.2 |
| C | 15 | 241 | 365541 | 613.56 | 2122 | 2195 | 592.2 |
| D | 13 | 169 | 9967150 | 16362.2 | 1969 | 2034 | 609.0 |
| D | 13 | 70 | 405407 | 662.32 | 1969 | 2034 | 609.0 |
| D | 10 | 84 | 165281 | 268.04 | 1969 | 2034 | 609.0 |
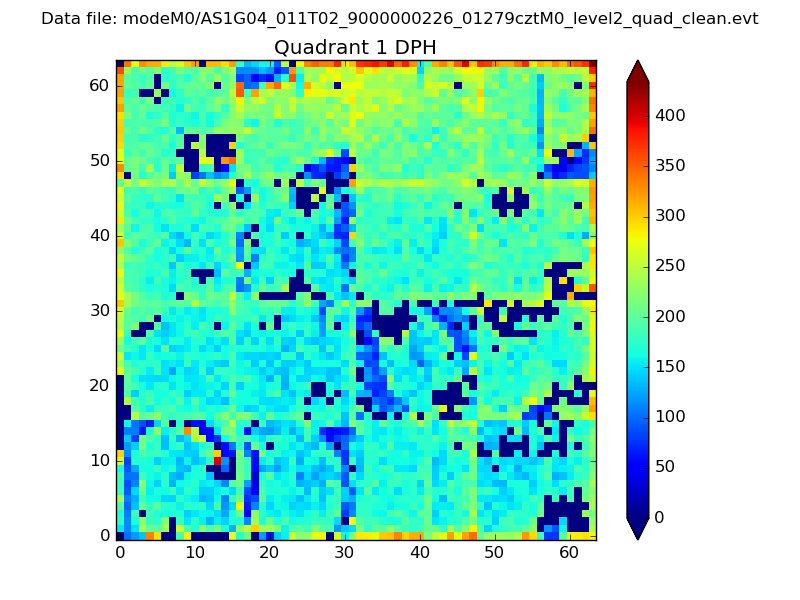
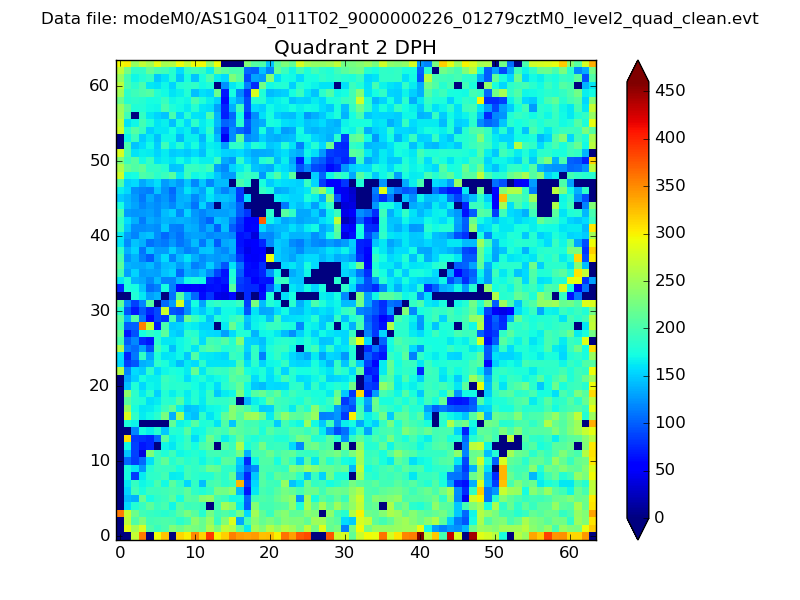
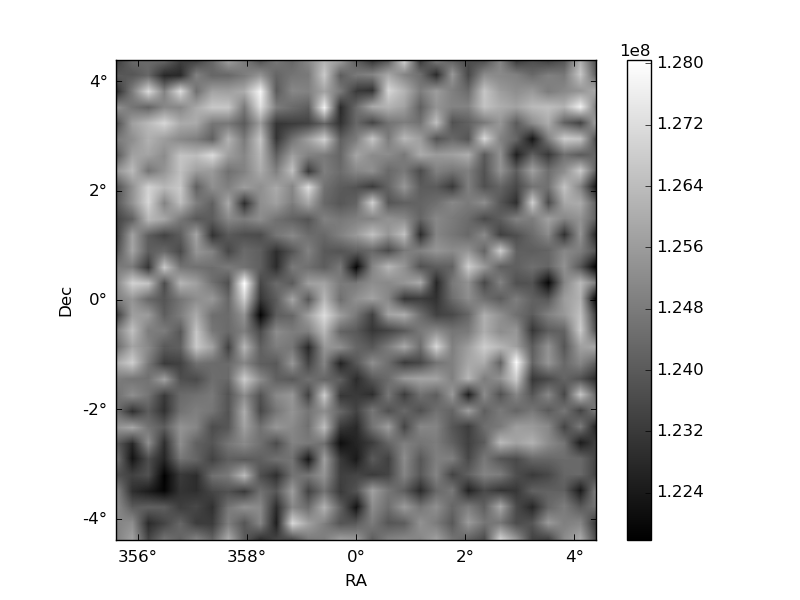
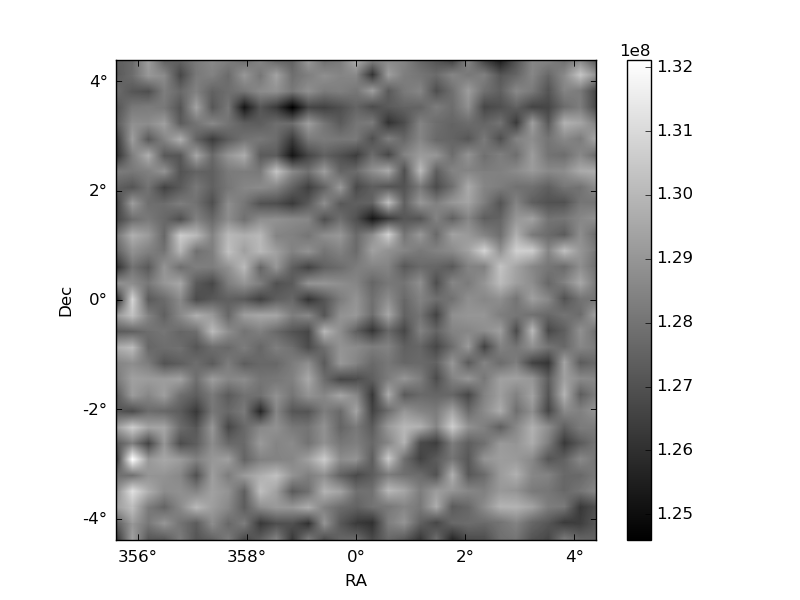
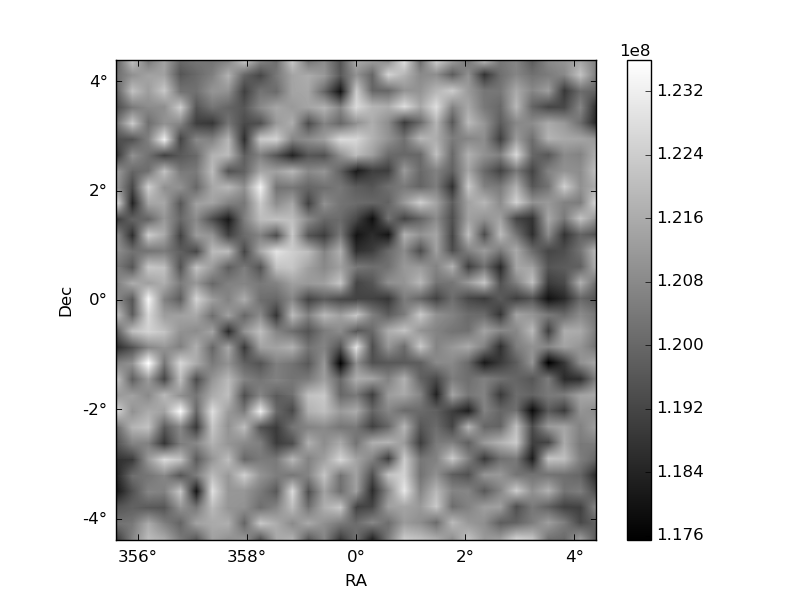
Histogram calculated using DETX and DETY for each event in the final _common_clean file
| Quadrant A | 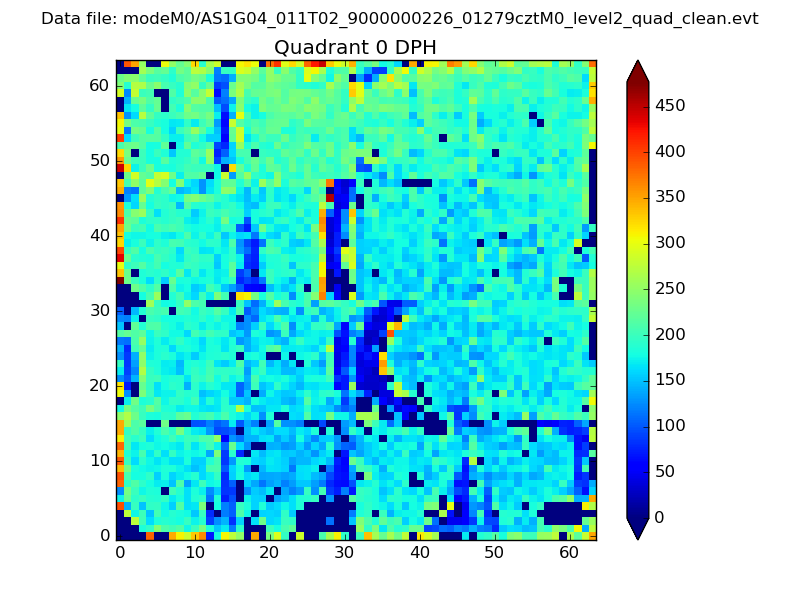 |
 |
Quadrant B |
|---|---|---|---|
| Quadrant D | 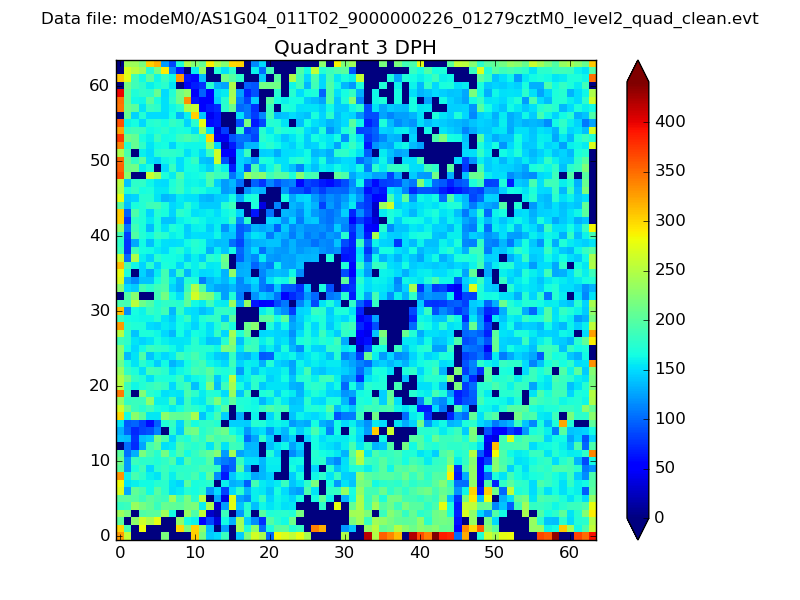 |
 |
Quadrant C |
| Plot type | Count rate plots | Images |
|---|---|---|
| Comparison with Poisson distribution Blue bars denote a histogram of data divided into 1 sec bins. Red curve is a Poisson curve with rate = median count rate of data. |
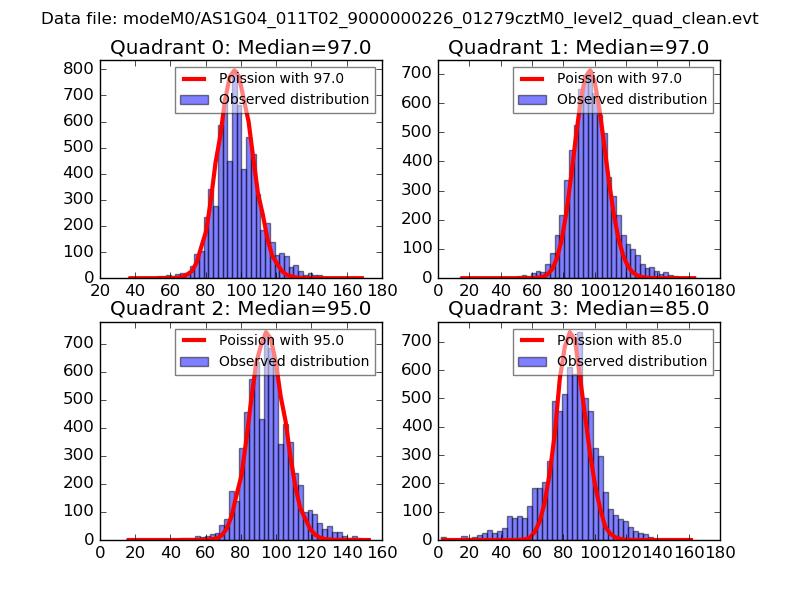 |
 |
| Quadrant-wise count rates Data is divided into 100 sec bins |
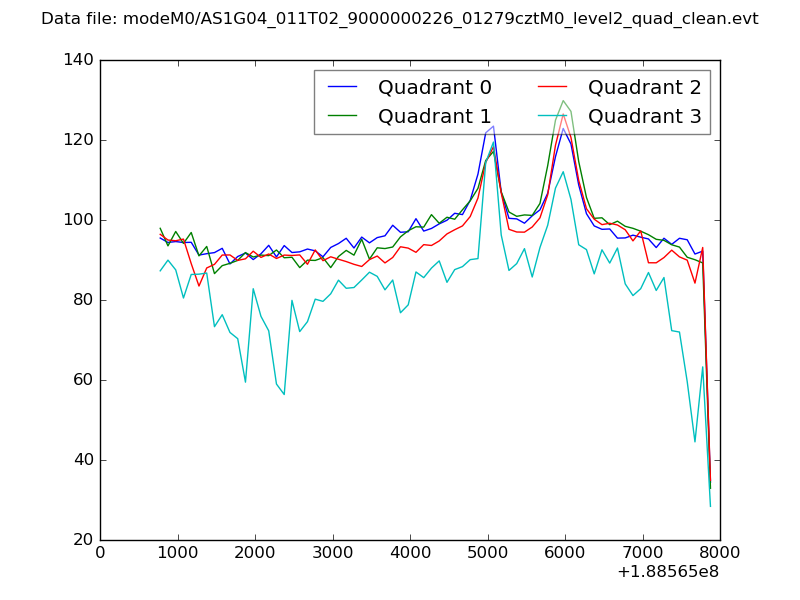 |
|
| Module-wise count rates for Quadrant A Data is divided into 100 sec bins |
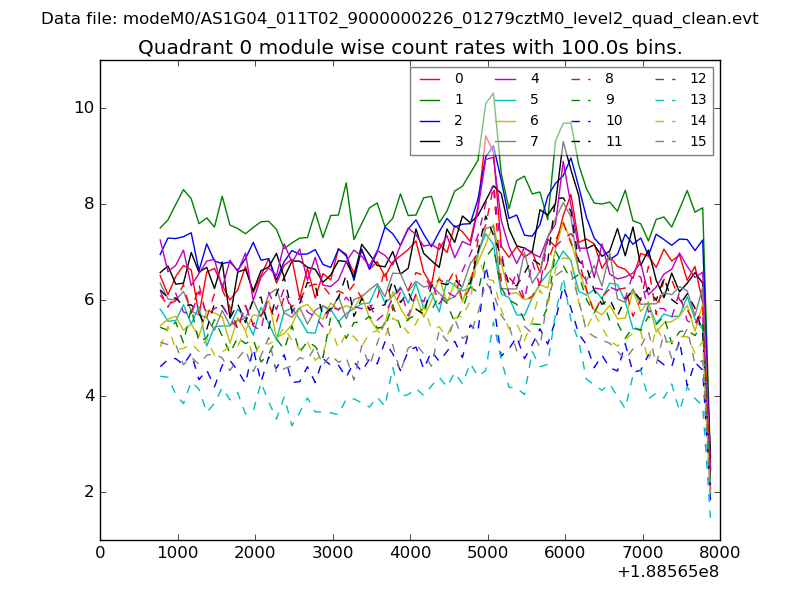 |
 |
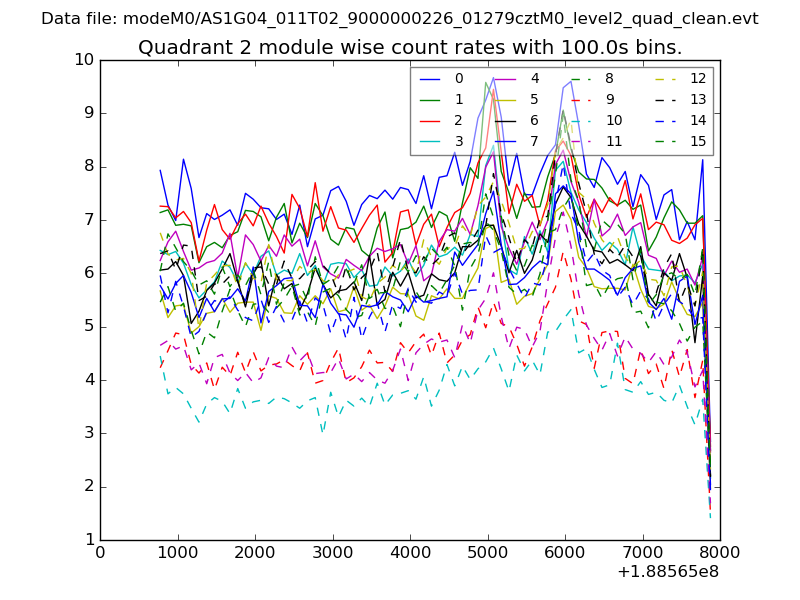
| Module-wise count rates for Quadrant B Data is divided into 100 sec bins |
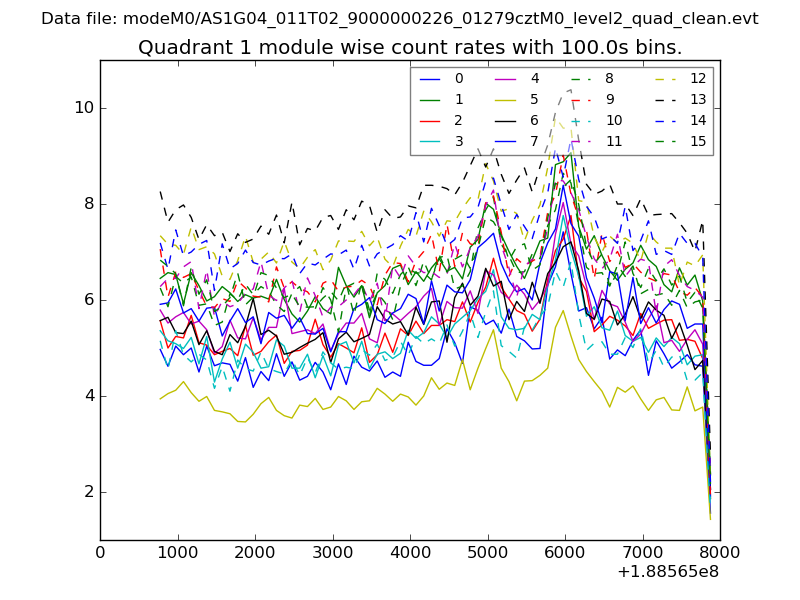 |
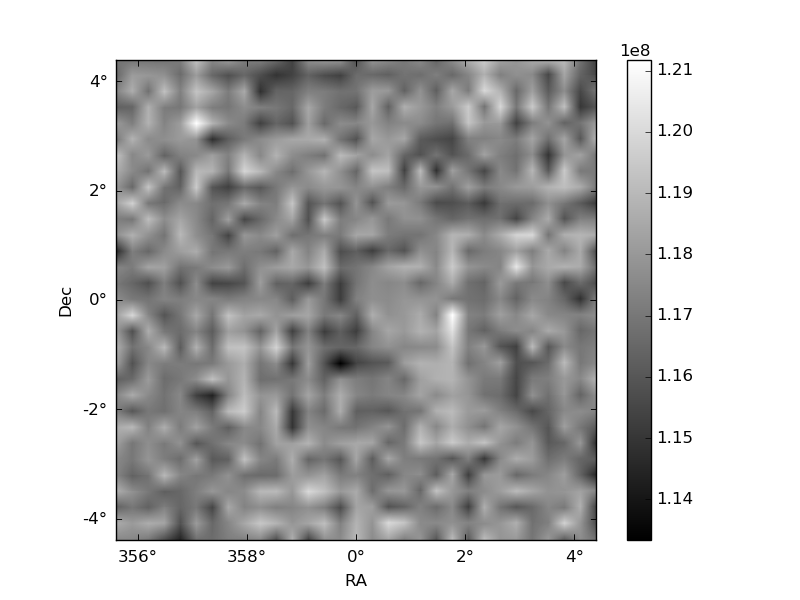 |
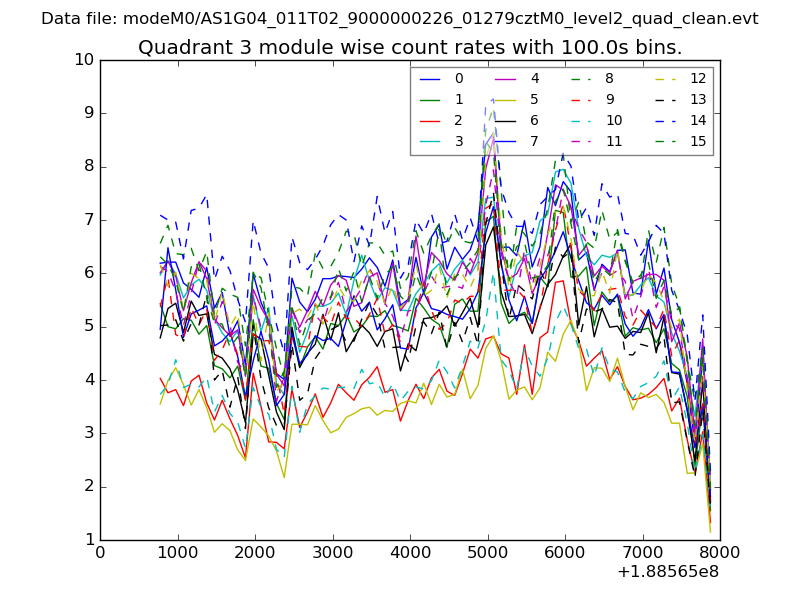
| Module-wise count rates for Quadrant C Data is divided into 100 sec bins |
 |
 |
| Module-wise count rates for Quadrant D Data is divided into 100 sec bins |
 |
 |
| Parameter | Plot |
|---|---|
| CZT HV Monitor | 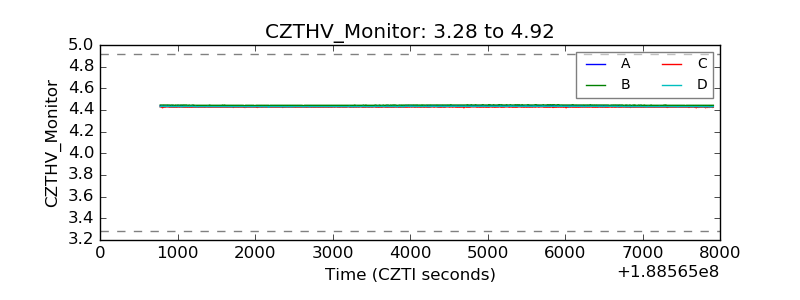 |
| D_VDD | 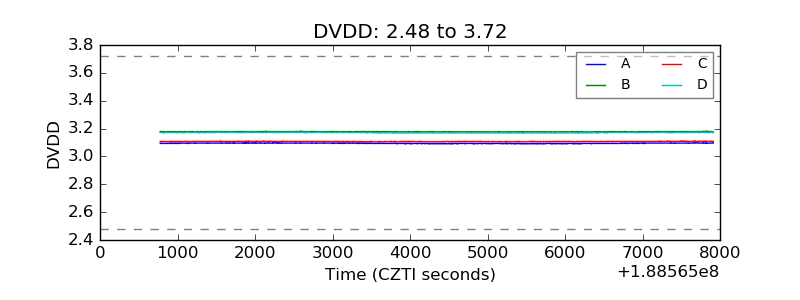 |
| Temperature 1 | 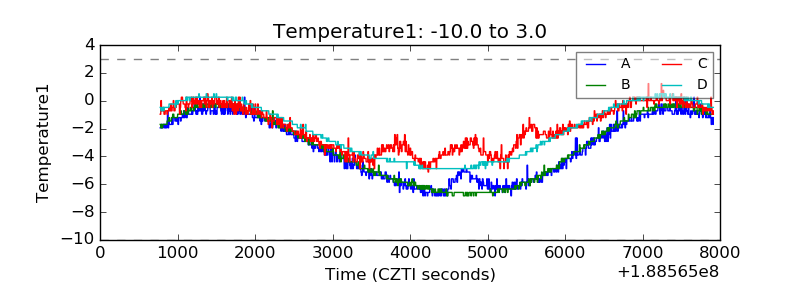 |
| Veto HV Monitor | 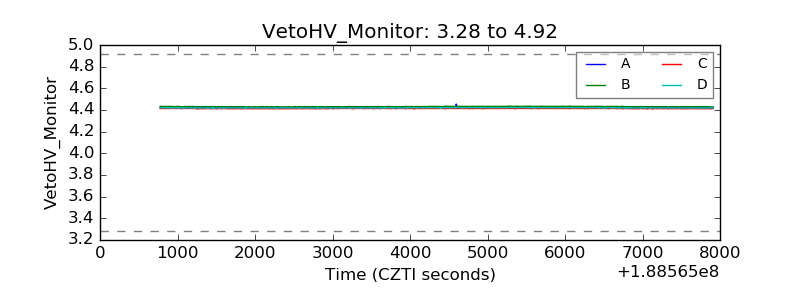 |
| Veto LLD | 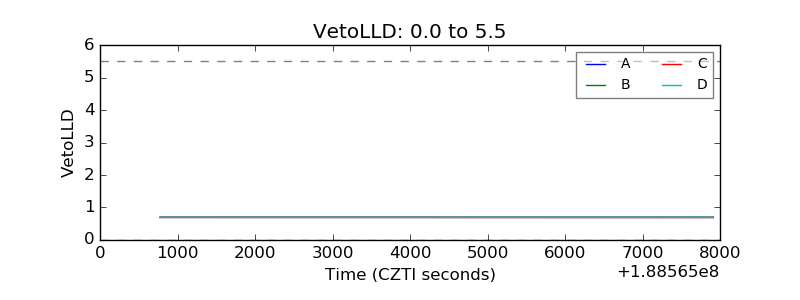 |
| Alpha Counter | 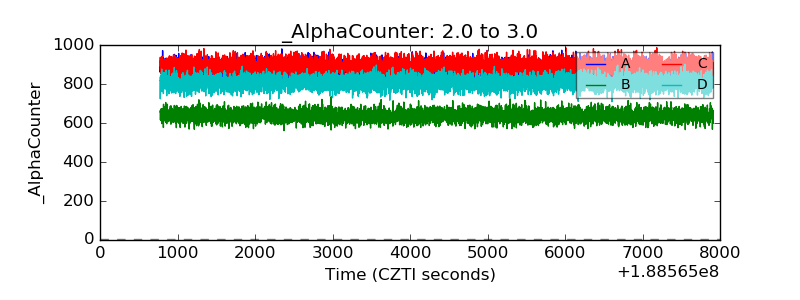 |
| _CPM_Rate | 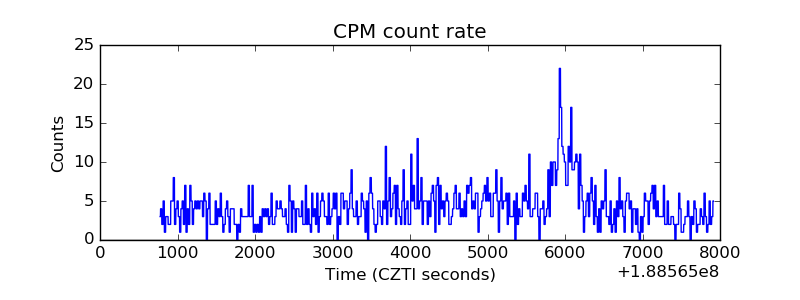 |
| CZT Counter | 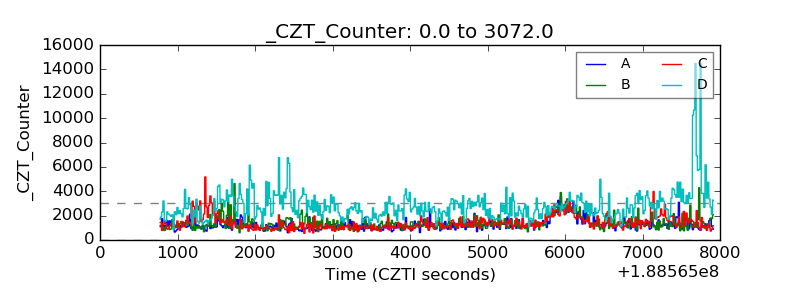 |
| +2.5 Volts monitor |  |
| +5 Volts monitor |  |
| _ROLL_ROT | 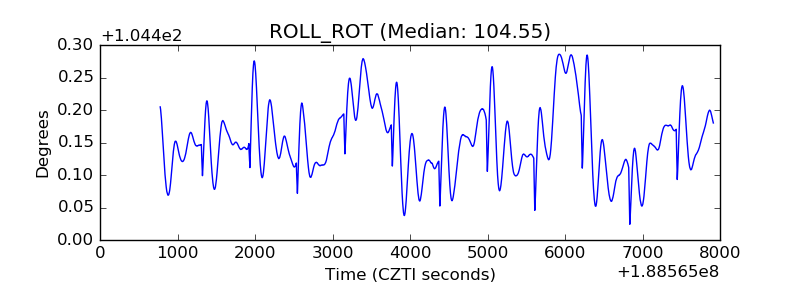 |
| _Roll_DEC | 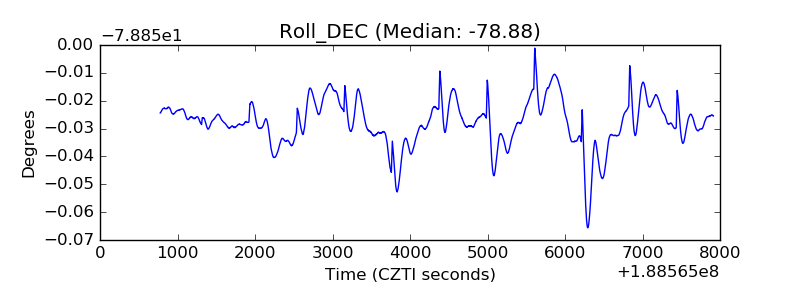 |
| _Roll_RA | 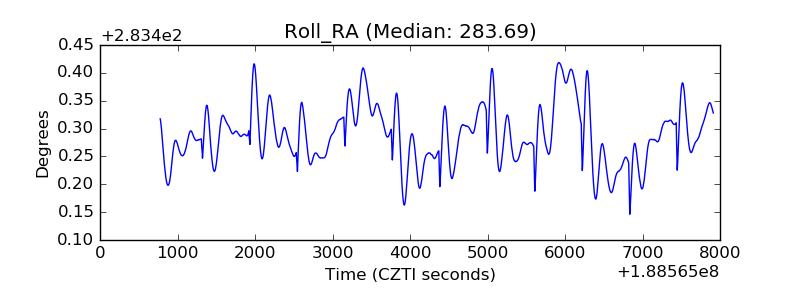 |
| Veto Counter | 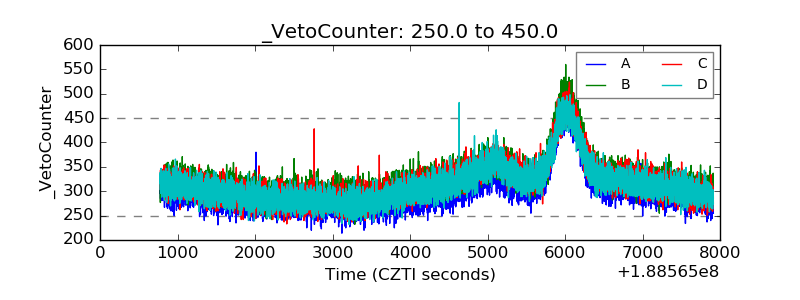 |