| Param | Original file | Final file |
|---|---|---|
| Filename | modeM0/AS1G04_011T02_9000000226_01282cztM0_level2.evt | modeM0/AS1G04_011T02_9000000226_01282cztM0_level2_quad_clean.evt |
| Size (bytes) | 1,242,244,800 | 91,175,040 |
| Size | 1.2 GB | 87.0 MB |
| Events in quadrant A | 7,309,823 | 612,265 |
| Events in quadrant B | 8,723,278 | 602,386 |
| Events in quadrant C | 7,555,577 | 590,586 |
| Events in quadrant D | 13,619,527 | 517,363 |
| Mode SS | |||
|---|---|---|---|
| Quadrant | BADHDUFLAG | Total packets | Discarded packets |
| A | 0 | 128 | 0 |
| B | 0 | 128 | 0 |
| C | 0 | 128 | 0 |
| D | 0 | 128 | 0 |
| Mode M9 | |||
|---|---|---|---|
| Quadrant | BADHDUFLAG | Total packets | Discarded packets |
| A | 0 | 8 | 0 |
| B | 0 | 8 | 0 |
| C | 0 | 8 | 0 |
| D | 0 | 8 | 0 |
| Mode M0 | |||
|---|---|---|---|
| Quadrant | BADHDUFLAG | Total packets | Discarded packets |
| A | 0 | 26207 | 2 |
| B | 0 | 30349 | 1 |
| C | 0 | 26924 | 1 |
| D | 0 | 45037 | 1 |
| Quadrant | Total seconds | Saturated seconds | Saturation percentage |
|---|---|---|---|
| A | 6269 | 24 | 0.382836% |
| B | 6269 | 121 | 1.930132% |
| C | 6269 | 14 | 0.223321% |
| D | 6269 | 1410 | 22.491625% |
Noise dominated data is calculated using 1-second bins in cleaned event files. If a bin has >2000 counts, and if more than 50% of those come from <1% of pixels, then it is considered to be noise-dominated and hence unusable.
| Quadrant | # 1 sec bins | Bins with >0 counts | Bins with >2000 counts | High rate bins dominated by noise | Noise dominated (total time) | Noise dominated (detector-on time) | Marked lightcurve |
|---|---|---|---|---|---|---|---|
| A | 7064 | 6269 | 129 | 129 | 1.83% | 2.06% | 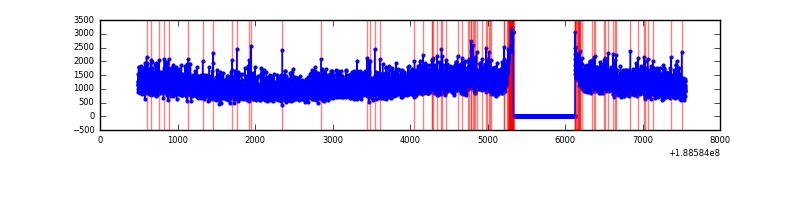 |
| B | 7064 | 6269 | 710 | 710 | 10.05% | 11.33% | 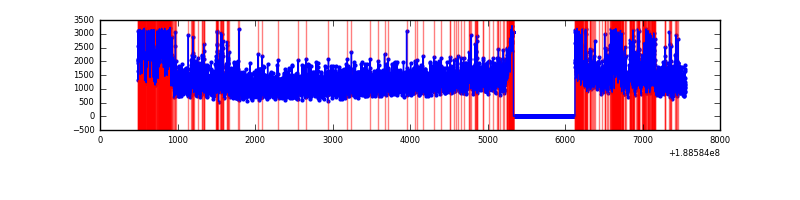 |
| C | 7064 | 6269 | 143 | 143 | 2.02% | 2.28% | 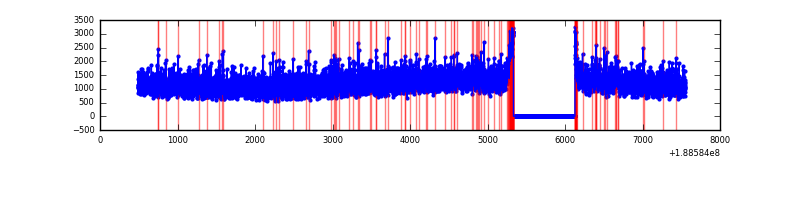 |
| D | 7063 | 6268 | 3349 | 3349 | 47.42% | 53.43% | 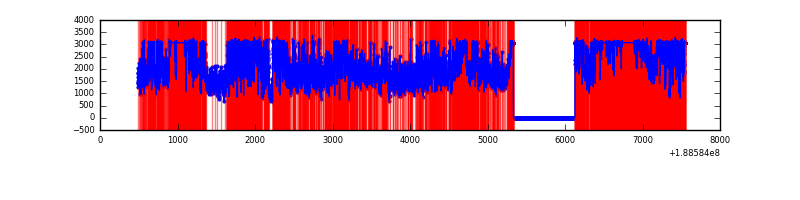 |
Top three noisy pixels from each quadrant. If the there are fewer than three noisy pixels in the level2.evt file, extra rows are filled as -1
| Pixel properties | Quadrant properties | ||||||
|---|---|---|---|---|---|---|---|
| Quadrant | DetID | PixID | Counts | Sigma | Mean | Median | Sigma |
| A | 11 | 79 | 9826 | 17.21 | 1899 | 1910 | 460.0 |
| A | 13 | 9 | 7805 | 12.82 | 1899 | 1910 | 460.0 |
| A | 0 | 214 | 5868 | 8.6 | 1899 | 1910 | 460.0 |
| B | 8 | 4 | 557566 | 1181.52 | 1987 | 1993 | 470.2 |
| B | 4 | 216 | 332022 | 701.86 | 1987 | 1993 | 470.2 |
| B | 6 | 53 | 115440 | 241.26 | 1987 | 1993 | 470.2 |
| C | 15 | 241 | 319503 | 646.45 | 1772 | 1832 | 491.4 |
| C | 8 | 208 | 236869 | 478.29 | 1772 | 1832 | 491.4 |
| C | 3 | 79 | 38619 | 74.86 | 1772 | 1832 | 491.4 |
| D | 13 | 169 | 6038588 | 12058.16 | 1601 | 1659 | 500.7 |
| D | 10 | 84 | 628188 | 1251.43 | 1601 | 1659 | 500.7 |
| D | 10 | 85 | 542988 | 1081.25 | 1601 | 1659 | 500.7 |
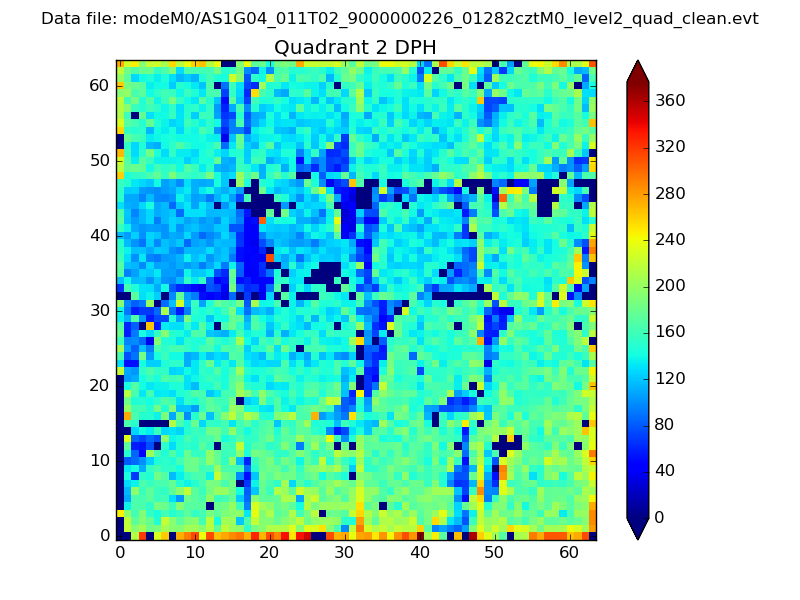
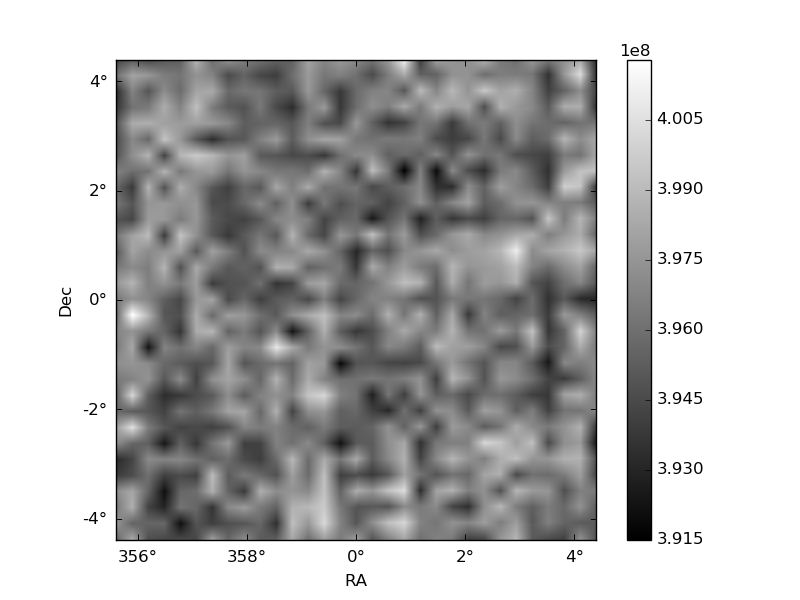
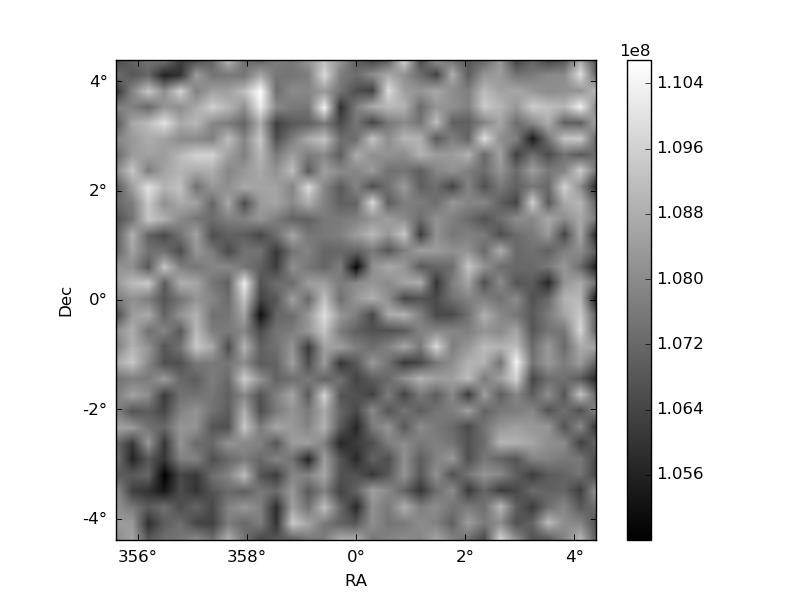
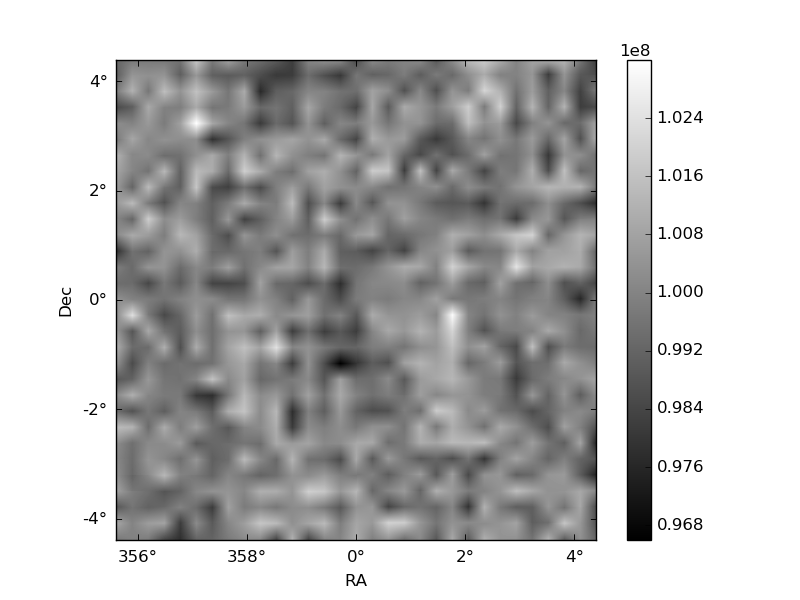
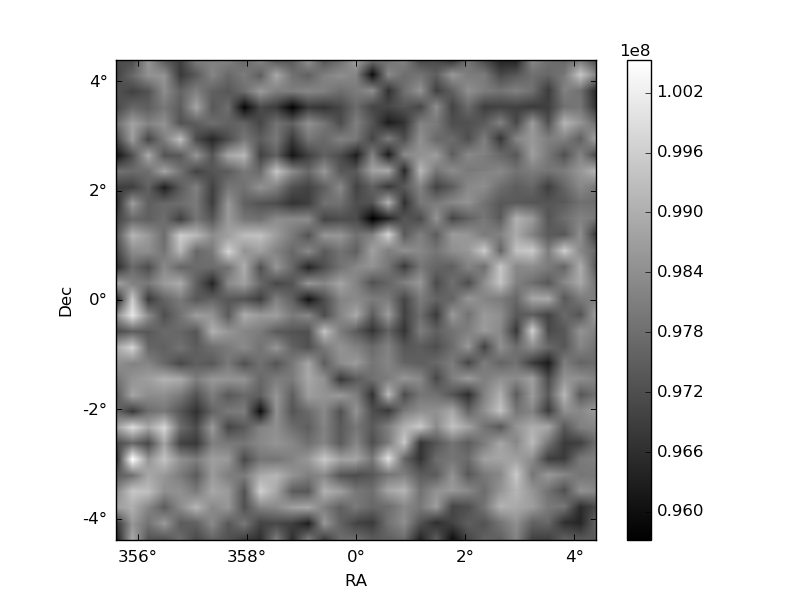
Histogram calculated using DETX and DETY for each event in the final _common_clean file
| Quadrant A | 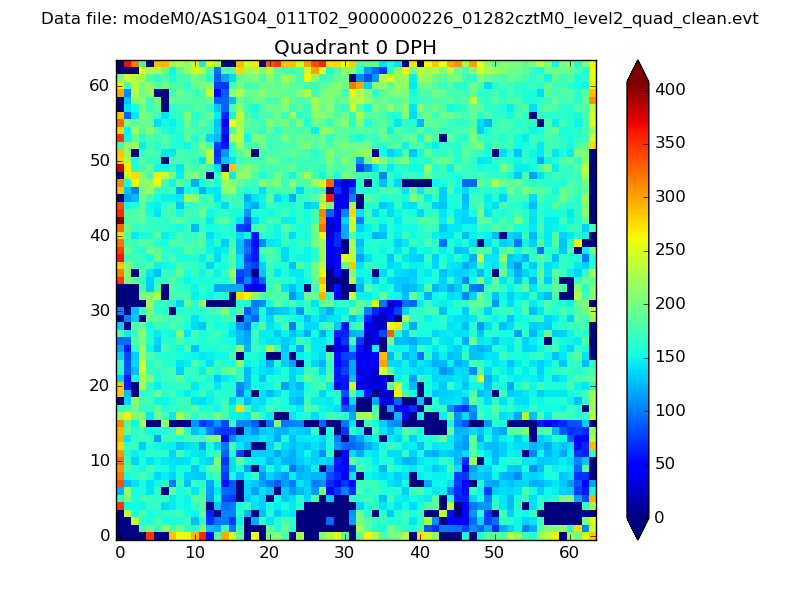 |
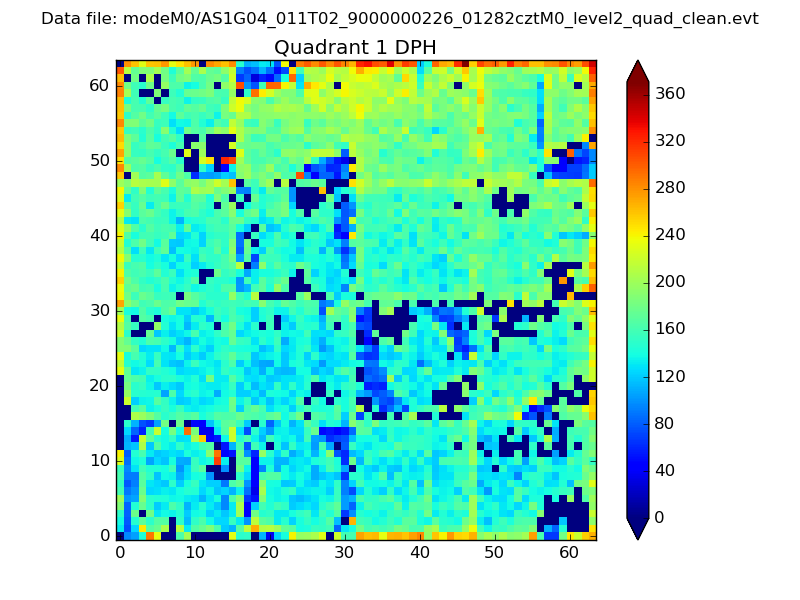 |
Quadrant B |
|---|---|---|---|
| Quadrant D | 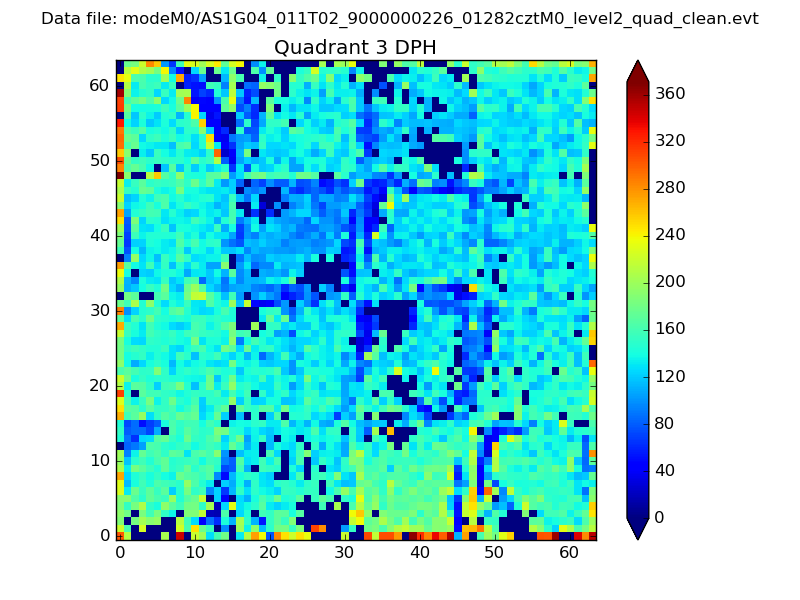 |
 |
Quadrant C |
| Plot type | Count rate plots | Images |
|---|---|---|
| Comparison with Poisson distribution Blue bars denote a histogram of data divided into 1 sec bins. Red curve is a Poisson curve with rate = median count rate of data. |
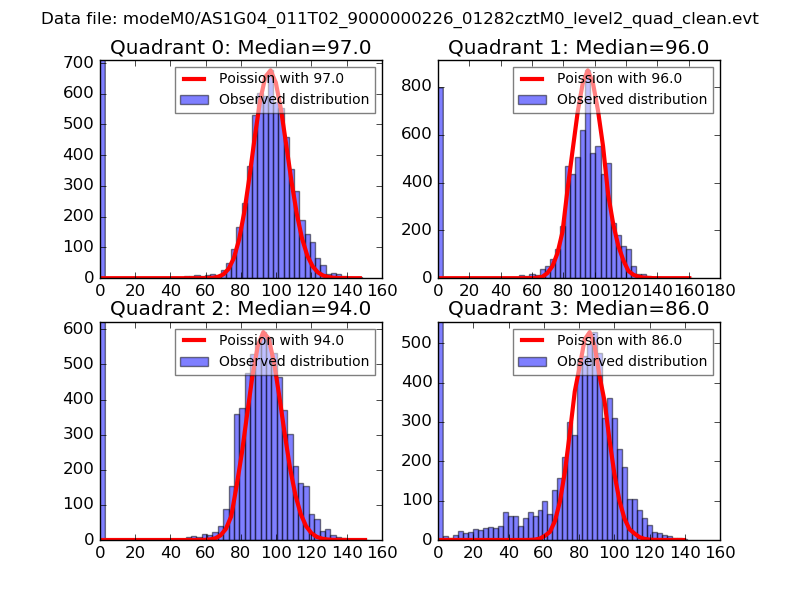 |
 |
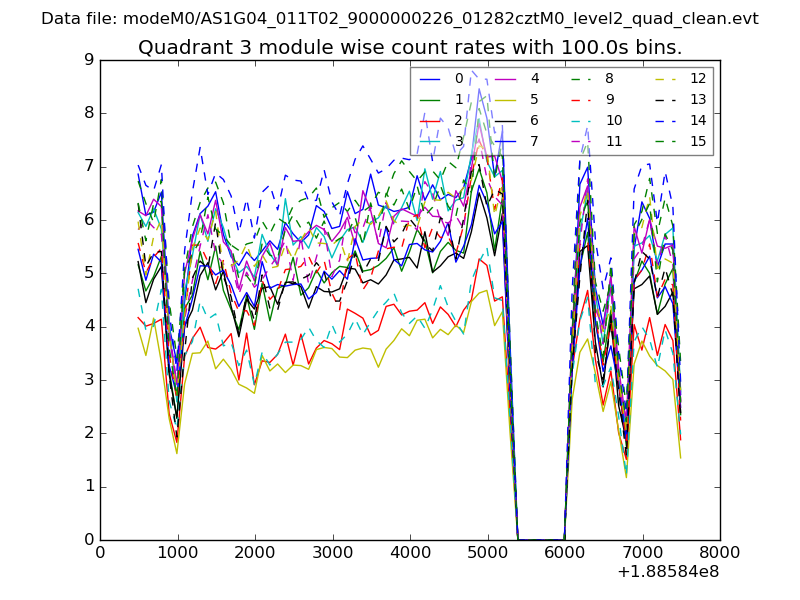
| Quadrant-wise count rates Data is divided into 100 sec bins |
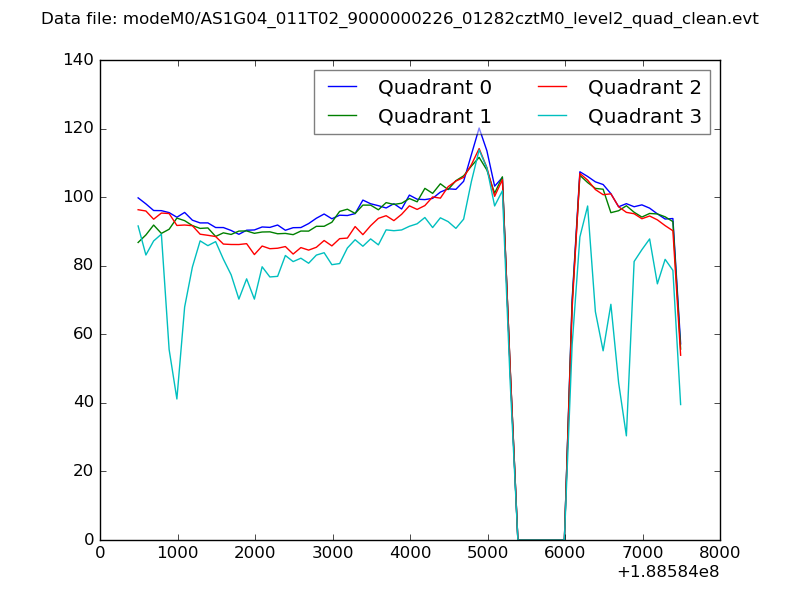 |
|
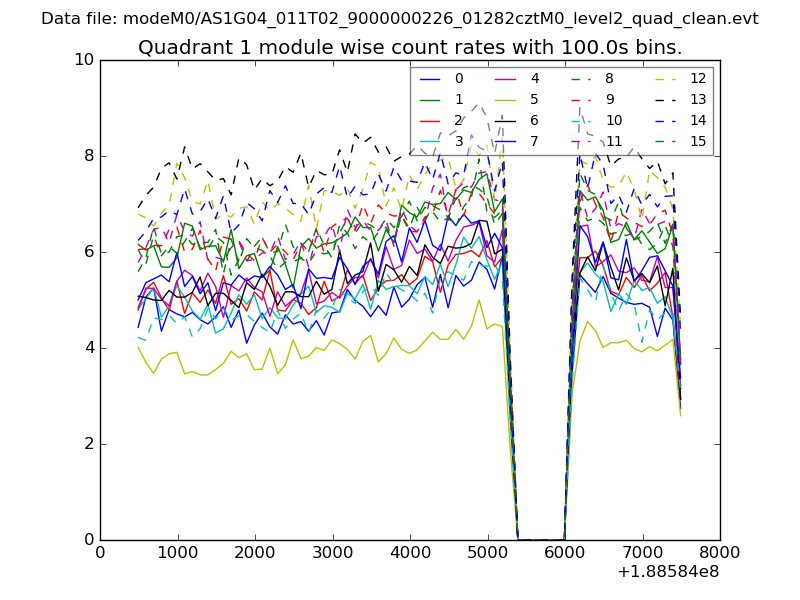
| Module-wise count rates for Quadrant A Data is divided into 100 sec bins |
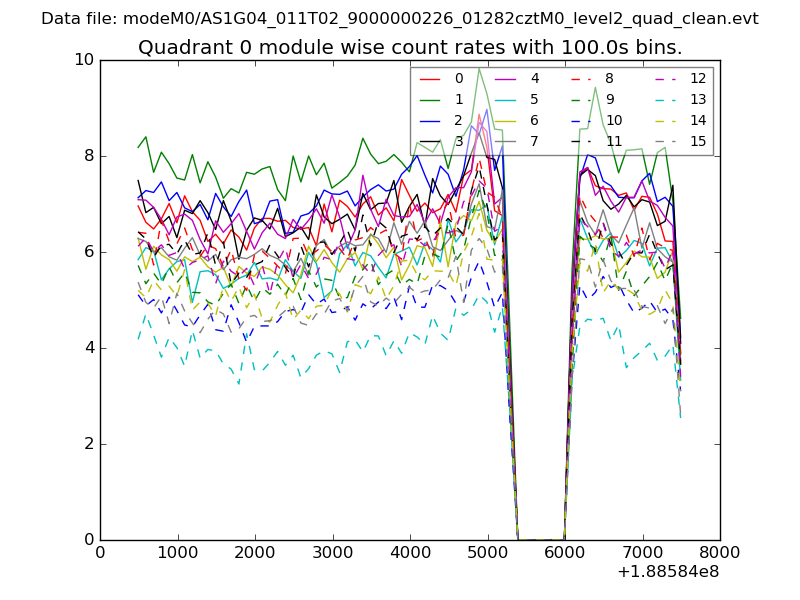 |
 |
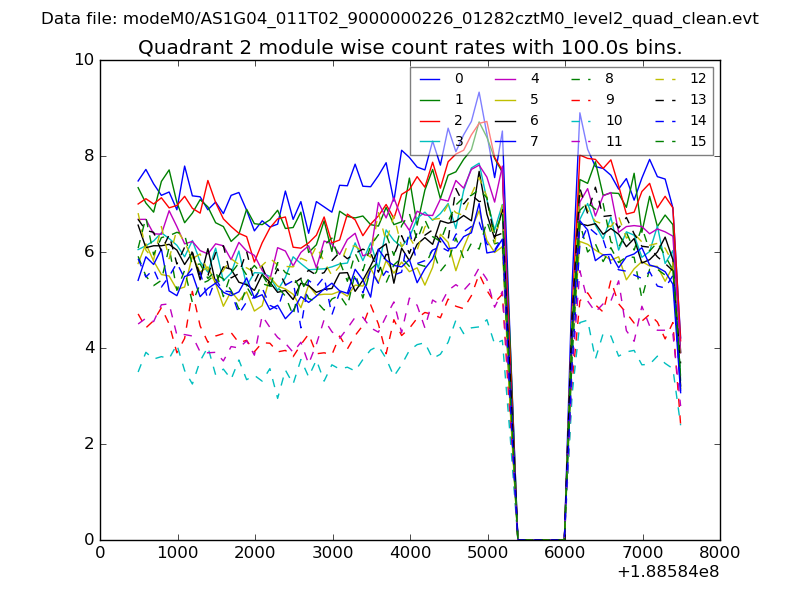
| Module-wise count rates for Quadrant B Data is divided into 100 sec bins |
 |
 |
| Module-wise count rates for Quadrant C Data is divided into 100 sec bins |
 |
 |
| Module-wise count rates for Quadrant D Data is divided into 100 sec bins |
 |
 |
| Parameter | Plot |
|---|---|
| CZT HV Monitor | 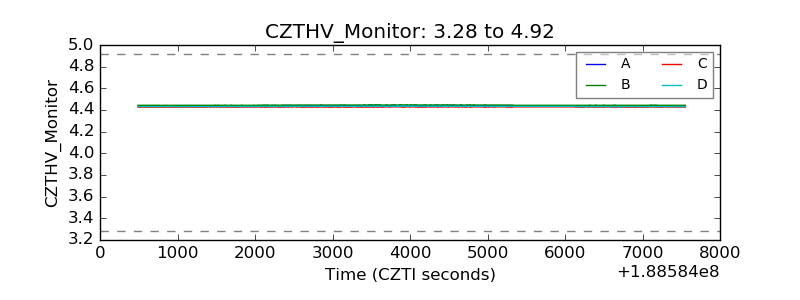 |
| D_VDD | 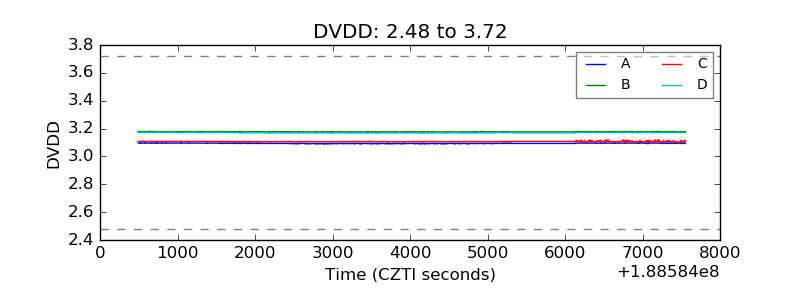 |
| Temperature 1 | 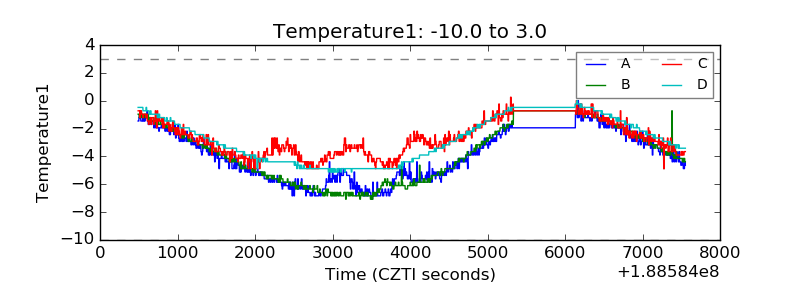 |
| Veto HV Monitor | 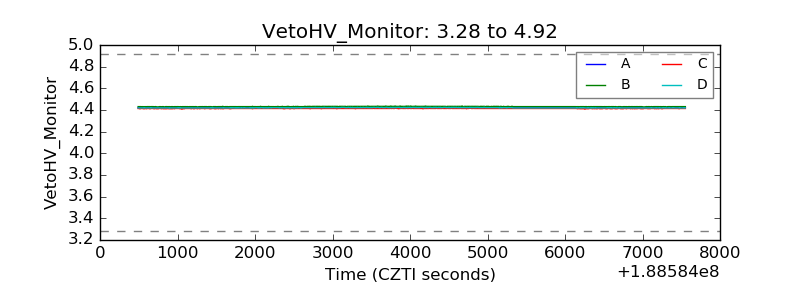 |
| Veto LLD | 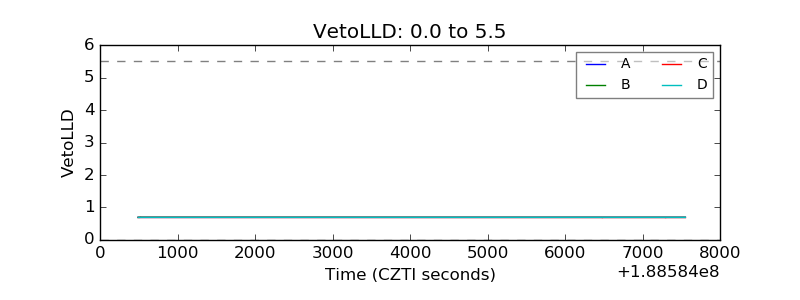 |
| Alpha Counter | 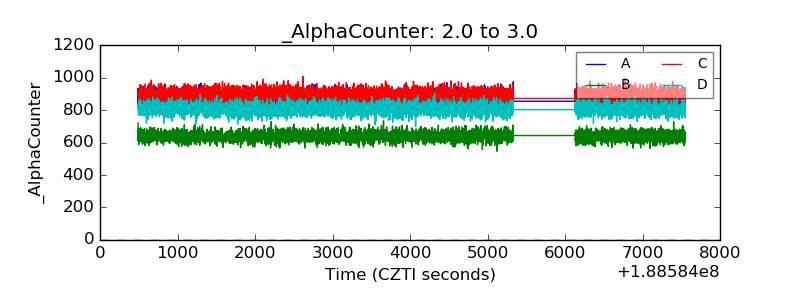 |
| _CPM_Rate | 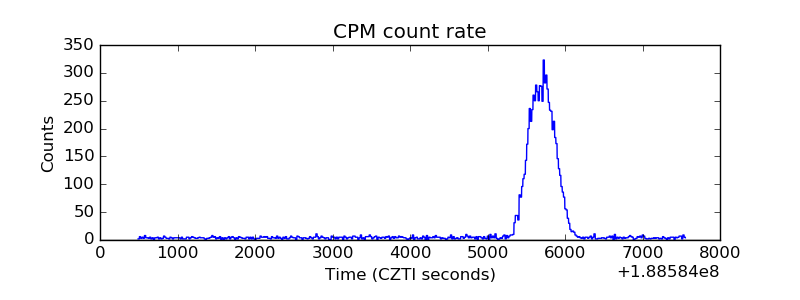 |
| CZT Counter | 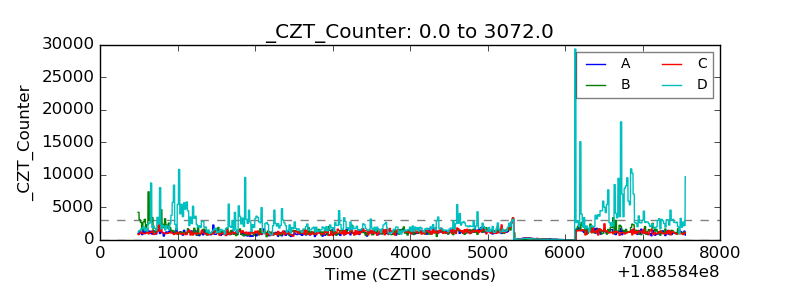 |
| +2.5 Volts monitor |  |
| +5 Volts monitor |  |
| _ROLL_ROT | 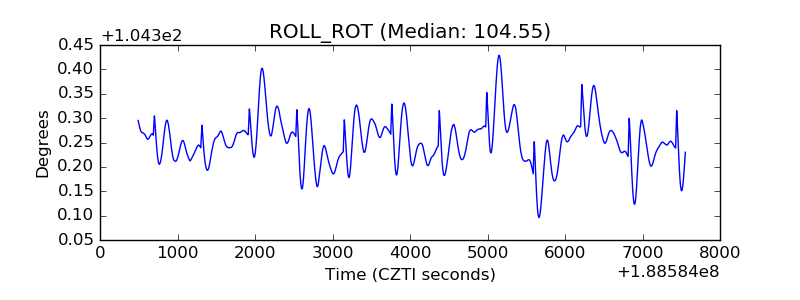 |
| _Roll_DEC | 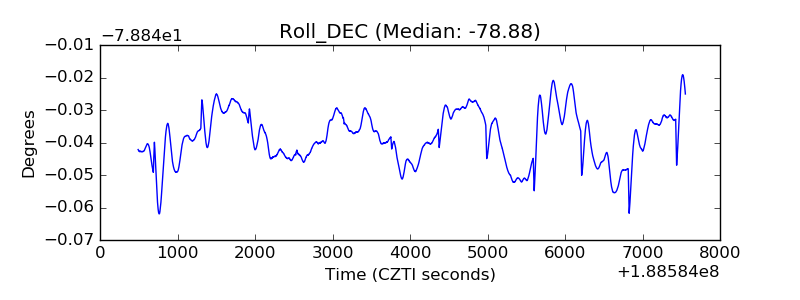 |
| _Roll_RA | 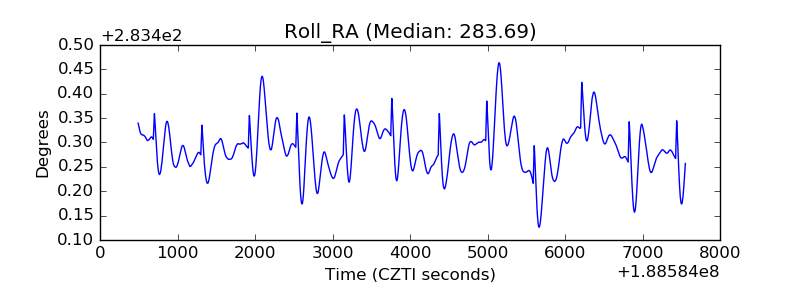 |
| Veto Counter | 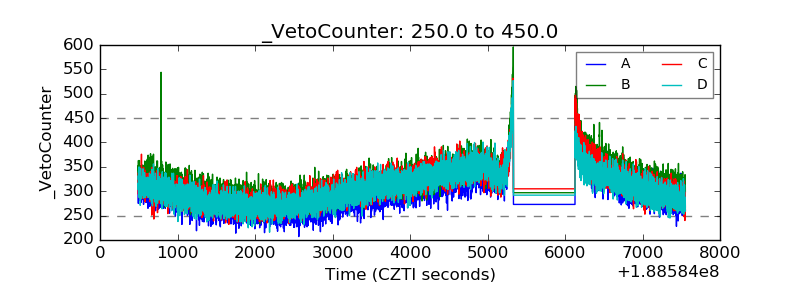 |